. 2021 Mar 1;220(3):e202007210.
doi: 10.1083/jcb.202007210.

Induction of spontaneous human neocentromere formation and long-term maturation

Affiliations

Induction of spontaneous human neocentromere formation and long-term maturation

Marina Murillo-Pineda et al. J Cell Biol. .

Abstract

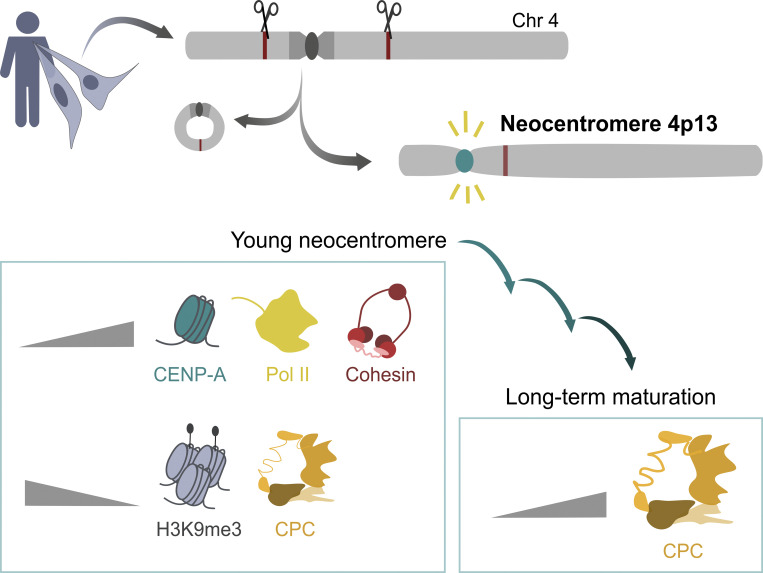
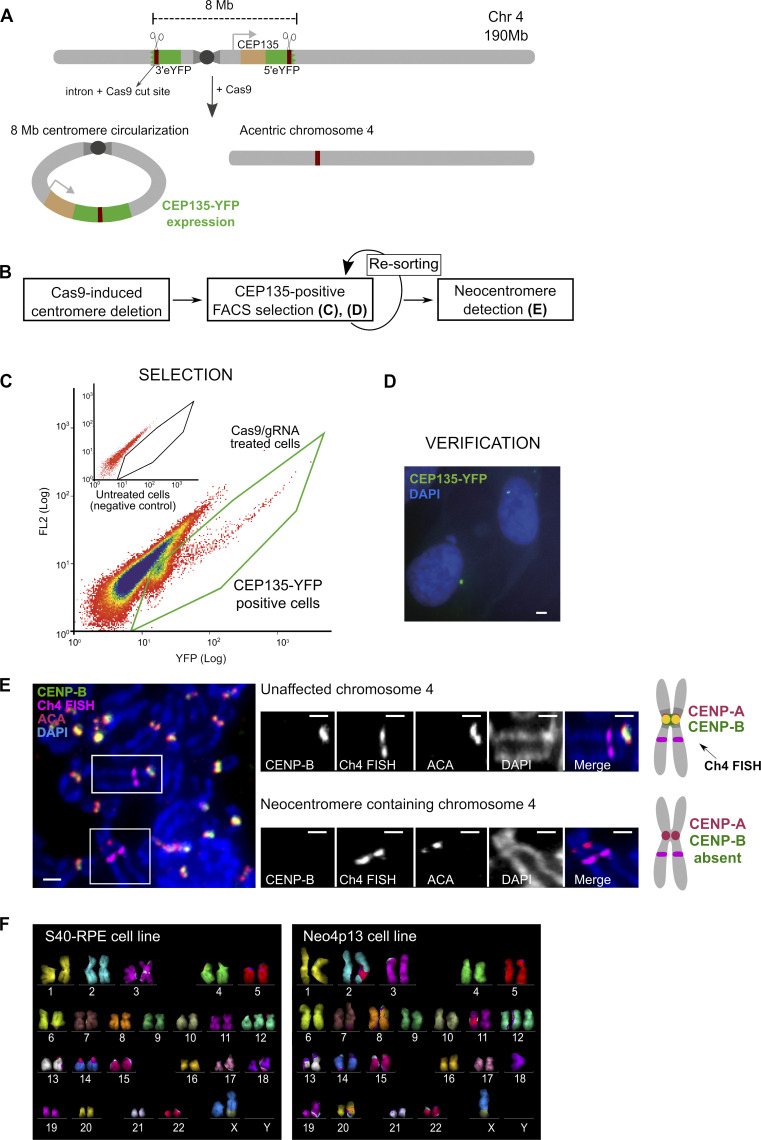
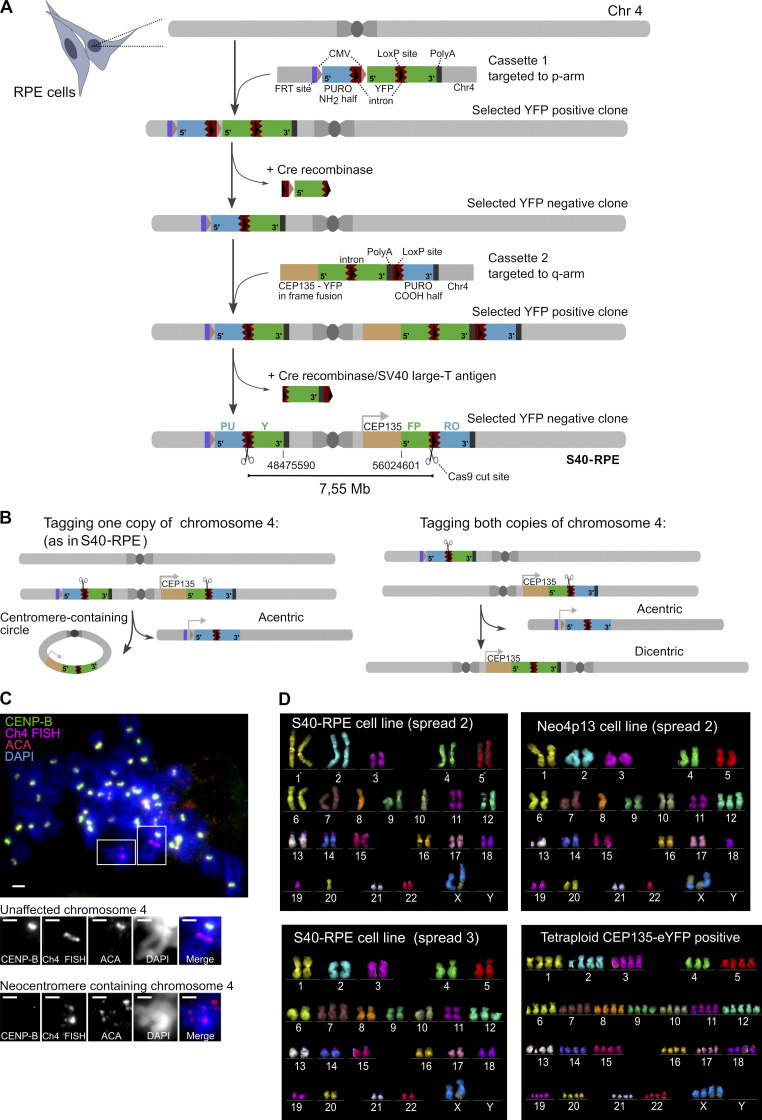
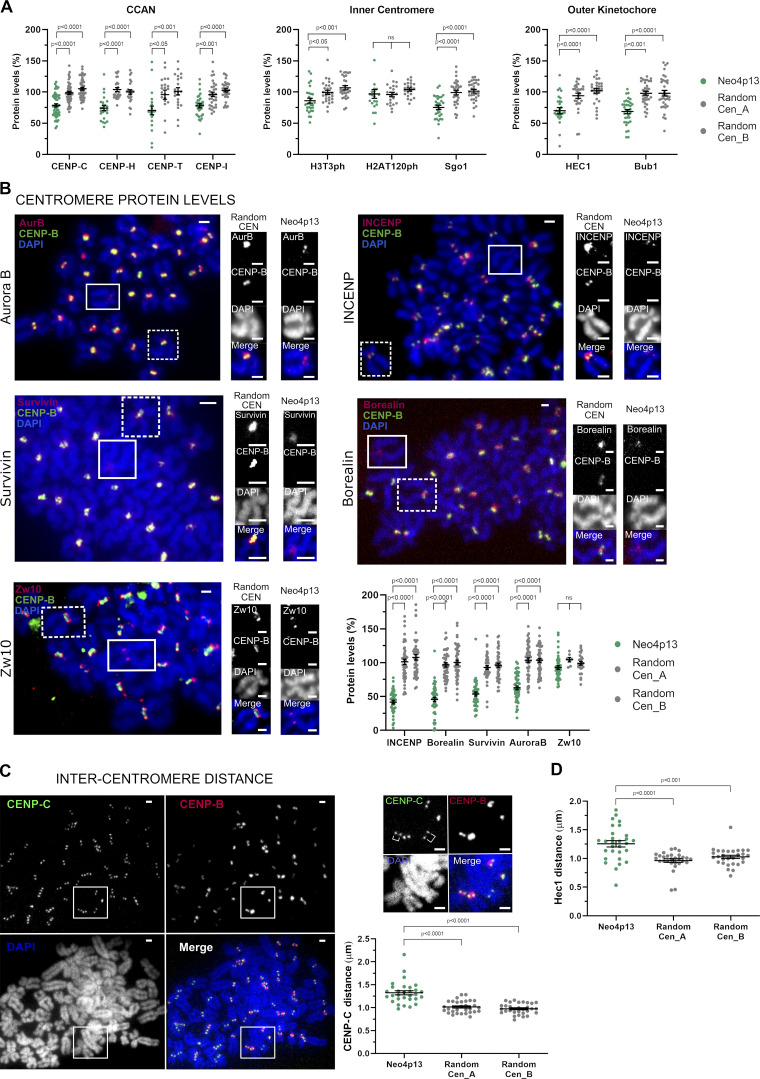
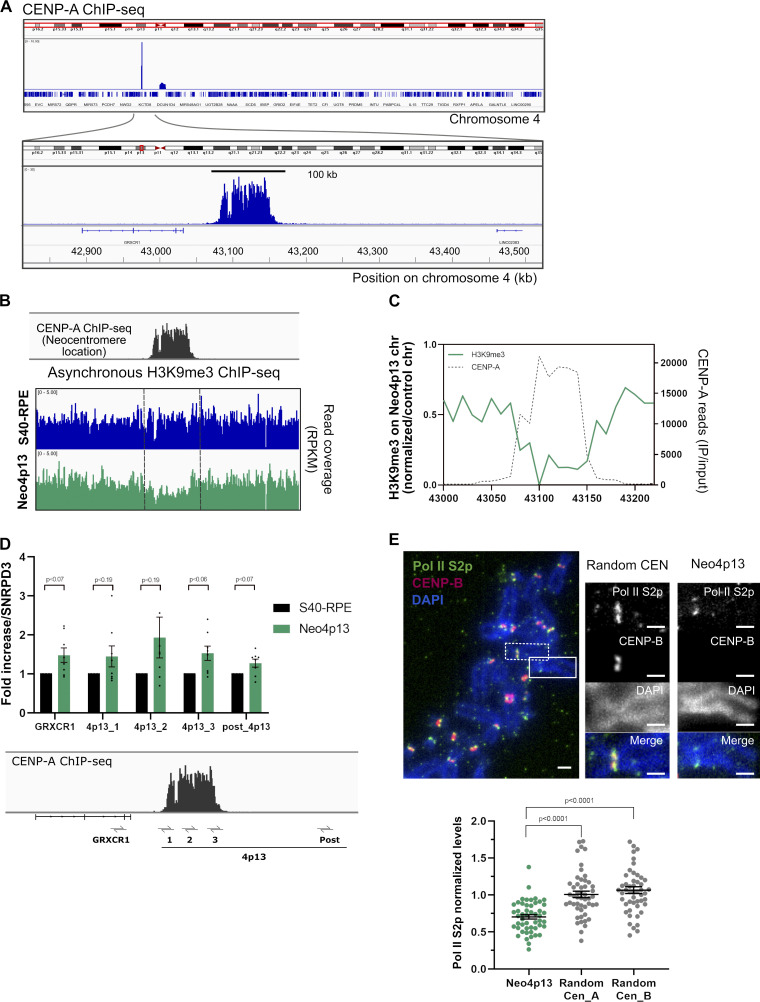
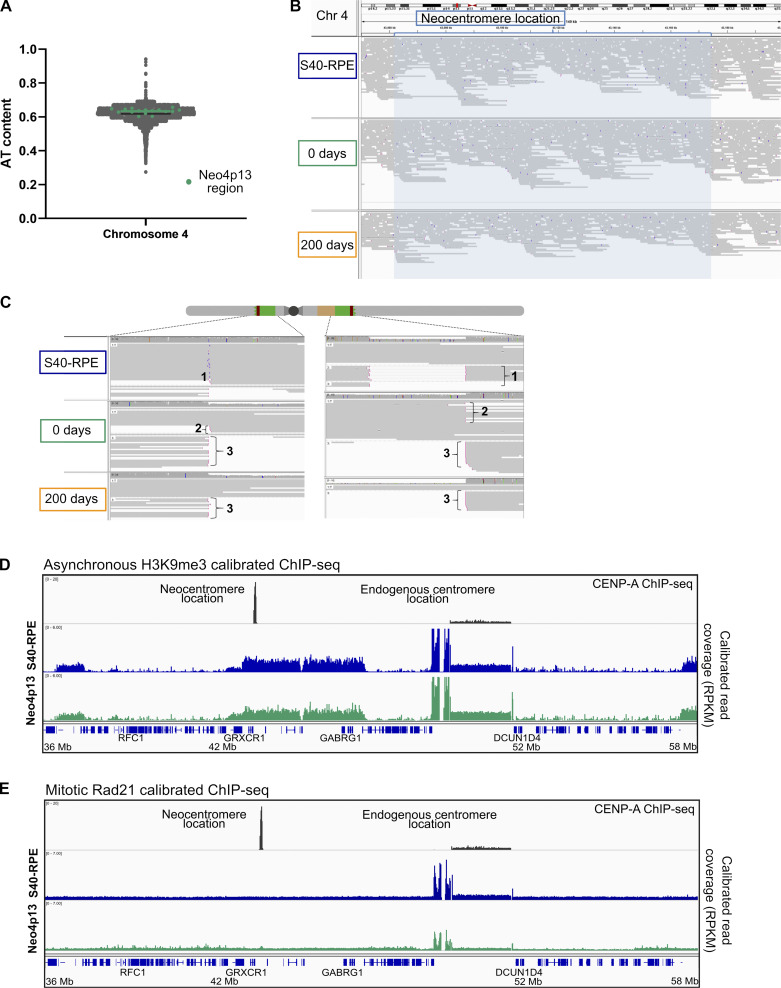
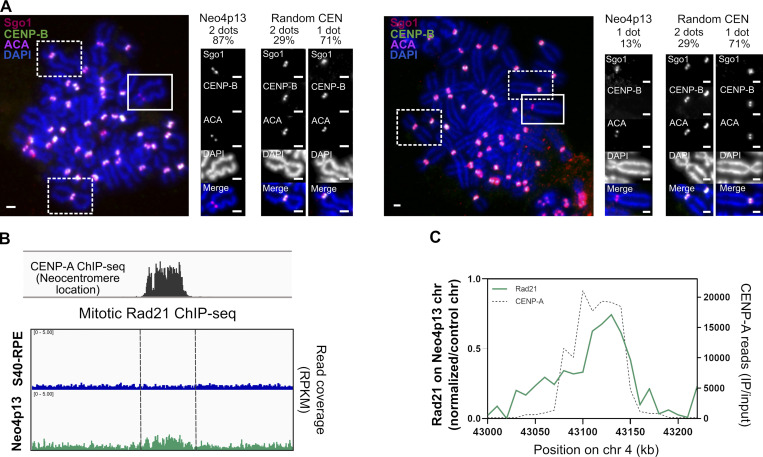
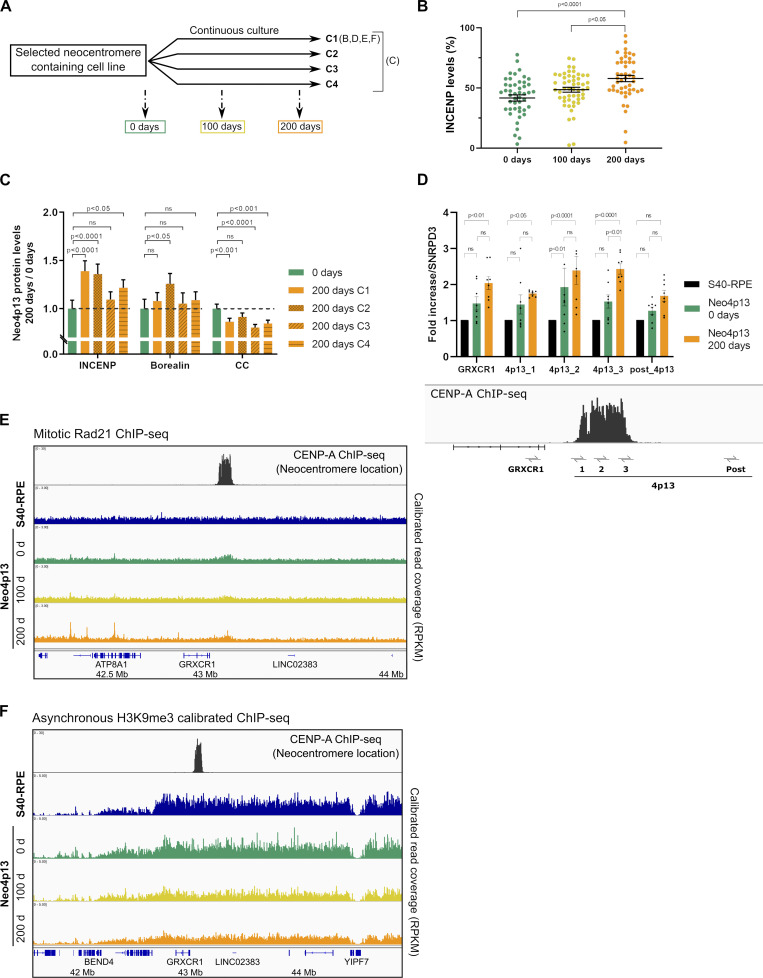
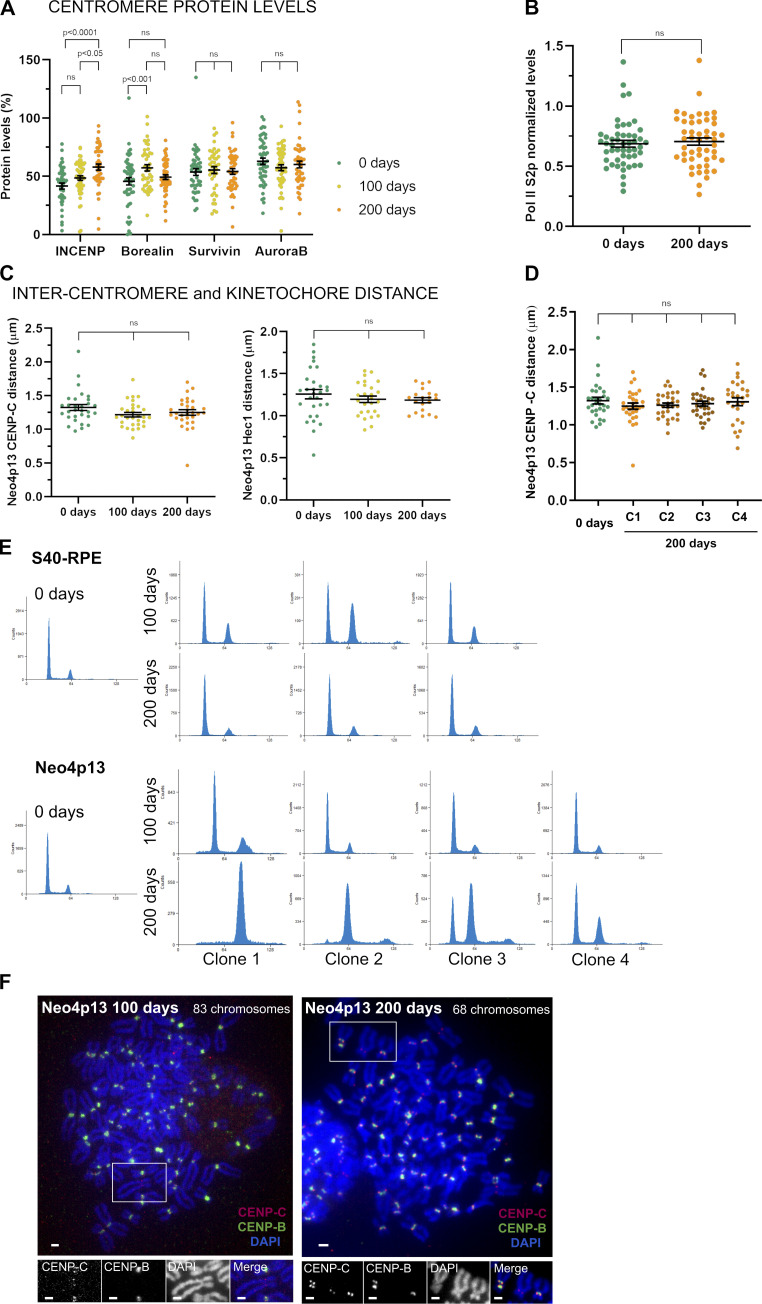
Human centromeres form primarily on α-satellite DNA but sporadically arise de novo at naive ectopic loci, creating neocentromeres. Centromere inheritance is driven primarily by chromatin containing the histone H3 variant CENP-A. Here, we report a chromosome engineering system for neocentromere formation in human cells and characterize the first experimentally induced human neocentromere at a naive locus. The spontaneously formed neocentromere spans a gene-poor 100-kb domain enriched in histone H3 lysine 9 trimethylated (H3K9me3). Long-read sequencing revealed this neocentromere was formed by purely epigenetic means and assembly of a functional kinetochore correlated with CENP-A seeding, eviction of H3K9me3 and local accumulation of mitotic cohesin and RNA polymerase II. At formation, the young neocentromere showed markedly reduced chromosomal passenger complex (CPC) occupancy and poor sister chromatin cohesion. However, long-term tracking revealed increased CPC assembly and low-level transcription providing evidence for centromere maturation over time.


Figures

None
Graphical abstract
Figure 1.
Figure 1.
Strategy for human centromere deletion and neocentromere isolation. (A) A cassette carrying the 5′ portion of the eYFP was integrated on the 4q-arm in frame with CEP135 protein (light brown) and the 3′ portion on the 4p-arm, flanking the centromere. Cassettes carry a murine intron (dark brown) that acts as a gRNA target for Cas9. Upon Cas9 cleavage one possible outcome is the circularization of the centromere fragment (∼8 Mb) leading to reconstitution of spliced CEP135-eYFP. The acentric chromosome serves as template for neocentromere formation (see Fig. S1). (B) Experimental design for centromere deletion and neocentromere selection and detection. (C) Selection of CEP135-eYFP positive cells by flow cytometry (FL2, fluorescence channel 2 used for scatter and autofluorescence measurements). (D) Micrograph showing CEP135-eYFP foci indicative of centromere fragment circularization. Scale bar, 2 µm. (E) Micrograph of neocentromere detection by FISH-IF in mitotic spreads. The FISH probe identifies chromosome 4, ACA (CENP-A, CENP-B, and CENP-C) localizes to active centromeres, and CENP-B binds specifically to alphoid DNA, absent from neocentromeres. Insets display the two chromosome 4s from the image on the left. Scale bars, 2 µm. Diagram on the right represents the expected staining pattern to identify the neocentromere. (F) Karyotypes of the parental and neocentromere cell lines by mFISH. S40-RPE carries a preexisting translocation (X,10) and an extra copy of chromosome 12, present in all the clones analyzed. Chr4, chromosome 4.
Figure S1.
Figure S1.
Genomic architecture of strategy for centromere deletion and karyotype of neocentromere-containing cells and alternative survivors. (A) Scheme of the sequential targeting steps and details of the targeting cassettes inserted into RPE cells flanking the centromere of chromosome 4. Constructs carry 5′ and 3′ fragments of the eYFP (green) split across the two genomic locations, separated by a mouse intronic sequence (brown) that is spliced efficiently (Lacy-Hulbert et al., 2001), and act as a target for gRNAs that will recruit Cas9 nuclease (scissors). Introns also carry a loxP site (black arrowhead). 5′ and 3′ fragments of a split Puromycin resistance gene (blue) are positioned downstream of the introns. Note that for the purposes of targeting the cassettes, a full-length eYFP gene was used to aid in fluorescence-based selection of targeted clones, followed by Cre-mediated removal of indicated gene fragments, ultimately resulting in the split eYFP arrangement flanking the centromere. Following Cas9 cut and repair, one possible outcome is the circularization of the centromere fragment (7.55-Mb region), leading to reconstitution of eYFP in frame with the centriole-associated protein CEP135. (Note that imperfect repair following the Cas9 cut is tolerated within the intronic region.) Conversely, the fusion of the acentric arms of the chromosome will lead to reconstitution of the Puromycin resistance gene driven from a cytomegalovirus (CMV) promoter (pink arrowhead) not used in this study. On the p arm, we also included an FRT (Flippase Recognition target) recombination site (purple), not used in this study. Indicated coordinates correspond to GRCh38 assembly. (B) Targeting of the p- and q-arm constructs from (A) result in two possible allele arrangements. Both possible scenarios (p- and q-targeted cassettes both inserted into the same chromosome 4 homologue [1] or in different ones [2]) lead to an acentric chromosome 4 formation after the Cas9 cut, serving as template for neocentromere formation. Based on mitotic spreads, multicolor karyotyping, and sequencing data, we deduced the S40-RPE parental cell line used in this study is of the scenario 1 type. (C) Early neocentromere detection by FISH-IF (performed as in Fig. 1 E) on the first CEP135-YFP–positive polyclonal population sorted 72 h after Cas9 electroporation and analyzed 3 d later. Scale bars, 2 µm. (D) Karyotype of indicated cell lines based on mFISH on different spreads, shortly after FACS-based isolation. Translocations and aneuploidies are detected in both the parental S40-RPE and Neo4p13 cell lines, possibly driven by SV40 expression. The tetraploid karyotype of a CEP135-eYFP–positive clone without an acquired neocentromere is also shown, indicative of single chromosome 4 loss. Chr, chromosome.
Figure 2.
Figure 2.
Experimentally induced human neocentromere shows inner-centromere defects. (A) Centromeric protein levels in the neocentromere (Neo4p13) compared with random endogenous centromeres. Quantification of mitotic spreads coimmunostained for indicated proteins and CENP-B. Mean and SEM of five (n = 50 spreads, for CENP-C) or three (n = 21–34 spreads, for all other proteins) independent experiments. P values based on one-way ANOVA with Tukey’s multiple comparison test. (B) CPC protein levels at Neo4p13 compared with random endogenous centromeres (Random CEN). Representative mitotic spreads coimmunostained for indicated CPC proteins and CENP-B. Zw10 outer kinetochore protein is included as a comparison to an unchanged reference protein. Insets show Neo4p13 and a random centromere equally scaled for visual comparison. Scale bars, 2 µm. Mean and SEM of five independent experiments (n = 45–52 spreads) analyzed as in A. (C) Intercentromere distance measured by coimmunostaining mitotic spreads for CENP-C and CENP-B. Quantification of distance (in micrometers) between the peak intensities of each CENP-C dot pair in one plane compared with equivalent pairs of random centromeres. Mean and SEM (n = 30 spreads) of three independent experiments. Scale bars, 2 µm. P values determined as in A. (D) Intercentromere distance based on Hec1 staining measured and analyzed as in C. Mean and SEM (n = 29 spreads) of three independent experiments.
Figure 3.
Figure 3.
Neocentromere spans 100 kb in a novel heterochromatic gene-poor region and recruits RNA Pol II upon formation. (A) CENP-A occupancy along chromosome 4 analyzed by ChIP-seq. Below, blowup of neocentromere region spanning around 100 kb at the novel 4p13 location. (B) Genomic snapshot of quantitative ChIP-seq reads (RPKM, reads per kilobase per million) for H3K9me3 (asynchronous cells) plotted across the 4p13 location, before (S40-RPE) and after neocentromere formation (Neo4p13). (C) Estimated allele specific coverage of H3K9me3 on the 4p13 region (marked by CENP-A ChIP-seq, gray line) on the neocentromere-containing chromosome in Neo4p13 cells. Calculation is based on the assumption that the read coverage from the nonaffected chromosome 4 in Neo4p13 cells is equivalent to average coverage in S40-RPE cells (see methods). (D) Quantitative RT-PCR analysis of the 4p13 CENP-A domain and adjacent regions before (S40-RPE) and after neocentromere formation (Neo4p13). Primer locations are indicated below the CENP-A ChIP profile. Mean fold changes and SEM of eight independent experiments are plotted relative to S40-RPE and normalized against the SNRPD3 reference gene (Eisenberg and Levanon, 2013). Adjusted P values from a multiple t test analysis are shown. (E) Pol II S2p levels in Neo4p13 compared with random endogenous centromeres. Quantification of mitotic spreads as in Fig. 2 A. Scale bars, 2 µm. Mean and SEM of five (n = 50 spreads) independent experiments. P values based on one-way ANOVA with Tukey’s multiple comparison test.
Figure S2.
Figure S2.
Neocentromere formation is driven by epigenetic mechanisms. (A) AT content along chromosome 4 (Chr 4)in 10-kb windows using isochore function from EMBOSS 5.0.0. Mean value for chromosome 4 (61.85%, black line) and overlay of the AT content at the neocentromere region (63.4%, green line). (B) Long-reads (12 kb average) from nanopore sequencing (PromethION) mapped against the hs37d5 human reference genome resulting in 93 Gb, 99 Gb, and 59 Gb of mapped data for the S40-RPE, Neo4p13 0 d and 200 d of culture, respectively. Neocentromere location snapshot is shown (blue shade) with purple bars indicating insertions larger than 10 bp. (C) Long-read coverage identified cassette integration sites in the control cell line (1). Pink ends indicate clipped reads, where at least 100 bp at the end of the read is either unmapped or maps to another location in the genome. We also detected reads supporting the centromere deletion in Neo4p13 at both time points (3) and reads from the excised circular centromeric DNA region (containing eYFP sequence) only at time 0 (2). (D and E) Genomic snapshot of calibrated ChIP-seq reads (RPKM, reads per kilobase per million) from H3K9me3 from asynchronous cells (D) and Rad21 from mitotically enriched cells (E), covering 22 Mb of chromosome 4, including the neocentromere location and the endogenous centromere region, before (S40-RPE) and after neocentromere formation (Neo4p13).
Figure 4.
Figure 4.
Sgo1 localization at the neocentromere is kinetochore biased. (A) Sgo1 localization in Neo4p13 compared with random endogenous centromeres. Representative mitotic spreads coimmunostained for Sgo1, ACA, and CENP-B. Insets show Neo4p13 and random centromeres with Sgo1 localization toward the kinetochores (two dots) or the inner centromere (one dot) and the quantification of each localization pattern (%) from three independent experiments (n = 50 spreads). P < 0.0001 (t test). Scale bars, 2 µm. (B) Genomic snapshot of quantitative ChIP-seq reads (RPKM, reads per kilobase per million) for Rad21 (mitotic cells) plotted as in Fig. 3 B. (C) Estimated allele specific coverage of Rad21 on the 4p13 region on the neocentromere-containing chromosome in Neo4p13 cells inferred as in Fig. 3 C. chr, chromosome; IP, immunoprecipitation.
Figure 5.
Figure 5.
Neocentromere formation and maturation promote changes in transcription, chromatin, and inner-centromere protein recruitment. (A) Experimental design to propagate independent clonal populations (C, independent clones) and compare neocentromere status early after isolation and after adaptation through successive generations. (B) INCENP levels at Neo4p13 at different times points (0, 100, and 200 ds of continuous culture) determined as in Fig. 2 A. Mean and SEM of five independent experiments (n = 47–52 spreads). P values based on one-way ANOVA with Tukey’s multiple comparison test. (C) INCENP, Borealin, and CENP-C (CC) levels in different clones of Neo4p13 (C1–C4) after 200 d of continuous culture measured as in Fig. 2 A, normalized to protein levels at day 0. Mean and SEM of five independent experiments (n = 44–50 spreads). P values determined as in B. (D) Quantitative RT-PCR analysis of 4p13 CENP-A domain and adjacent regions before (S40-RPE) and at 0 and 200 d of continuous culture following neocentromere formation (Neo4p13) as in Fig. 3 D. Mean fold changes and SEM of eight independent experiments. P values from two-way ANOVA analysis are shown. (E and F) Neocentromere chromatin status at 0, 100, and 200 d of continuous culture measured by quantitative ChIP-seq. Genomic snapshot of 4p13 location showing Rad21 (mitotic cells; E) and H3K9me3 (asynchronous cells; F) normalized coverage.
Figure S3.
Figure S3.
The neocentromere adapts by accumulating INCENP and Borealin. (A) CPC component protein levels at Neo4p13 at indicated times points (0, 100, and 200 d of continuous culture) measured as in Fig. 2 A. Mean and SEM of five independent experiments (n = 47–54 spreads). P values are based on one-way ANOVA with Tukey’s multiple comparison test. (B) Pol II S2p levels at Neo4p13 at 0 and 200 d of continuous culture measured as in Fig. 3 E. Mean and SEM of five independent experiments (n = 50 spreads). P values were determined as in A. (C) Intercentromere and inter-kinetochore distance at Neo4p13 at indicated time points based on CENP-C and Hec1 immunostaining measured as in Fig. 2 C. Mean and SEM of three independent experiments (n = 20–32 spreads; P values are indicated in the figure, determined as in A). (D) Intercentromere distance based on CENP-C of different clones of Neo4p13 (C1–C4, four independent clones) after 200 d in continuous culture measured as in Fig. 2 C. Mean and SEM of three independent experiments (n = 27–30 spreads). P values are defined as in A. (E) Cell cycle profiles determined by flow cytometry using PI DNA staining of S40-RPE and Neo4p13 at 0, 100, and 200 d of continuous culture. Three independent populations for S40-RPE and four for Neo4p13 subjected to long-term culture experiments are shown. (F) Representative spreads of polyploid cells of Neo4p13 cell line after 100 or 200 d in continuous culture, stained for indicated proteins and DNA (as for Fig. 2 B). A neocentromere-containing chromosome is identified by lack of CENP-B staining. Scale bars, 2 µm.

Comment in

Similar articles

Cited by

References

    1. Alonso, A., Hasson D., Cheung F., and Warburton P.E.. 2010. A paucity of heterochromatin at functional human neocentromeres. Epigenetics Chromatin. 3:6. 10.1186/1756-8935-3-6 - DOI - PMC - PubMed
    1. Amor, D.J., Bentley K., Ryan J., Perry J., Wong L., Slater H., and Choo K.H.A.. 2004. Human centromere repositioning “in progress”. Proc. Natl. Acad. Sci. USA. 101:6542–6547. 10.1073/pnas.0308637101 - DOI - PMC - PubMed
    1. Ando, S., Yang H., Nozaki N., Okazaki T., and Yoda K.. 2002. CENP-A, -B, and -C chromatin complex that contains the I-type alpha-satellite array constitutes the prekinetochore in HeLa cells. Mol. Cell. Biol. 22:2229–2241. 10.1128/MCB.22.7.2229-2241.2002 - DOI - PMC - PubMed
    1. Bassett, E.A., Wood S., Salimian K.J., Ajith S., Foltz D.R., and Black B.E.. 2010. Epigenetic centromere specification directs aurora B accumulation but is insufficient to efficiently correct mitotic errors. J. Cell Biol. 190:177–185. 10.1083/jcb.201001035 - DOI - PMC - PubMed
    1. Berdougo, E., Terret M.-E., and Jallepalli P.V.. 2009. Functional dissection of mitotic regulators through gene targeting in human somatic cells. Methods Mol. Biol. 545:21–37. 10.1007/978-1-60327-993-2_2 - DOI - PubMed

Publication types