. 2021 Aug;41(8):1842-1857.
doi: 10.1177/0271678X20980296. Epub 2021 Jan 14.

Role of perivascular and meningeal macrophages in outcome following experimental subarachnoid hemorrhage

Affiliations

Role of perivascular and meningeal macrophages in outcome following experimental subarachnoid hemorrhage

Hoyee Wan et al. J Cereb Blood Flow Metab. 2021 Aug.

Abstract

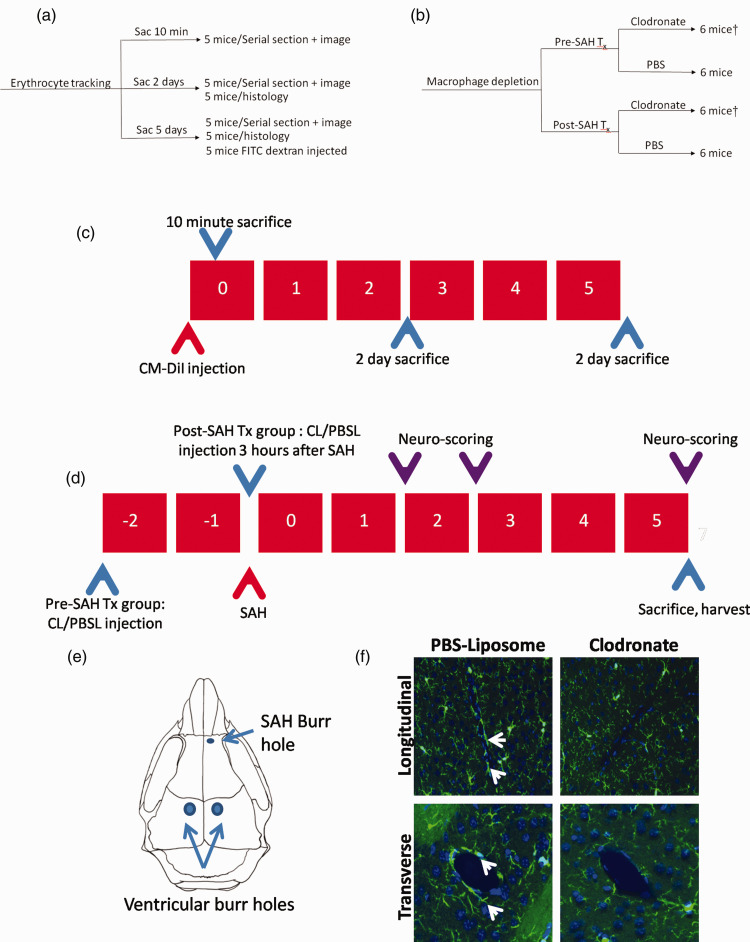
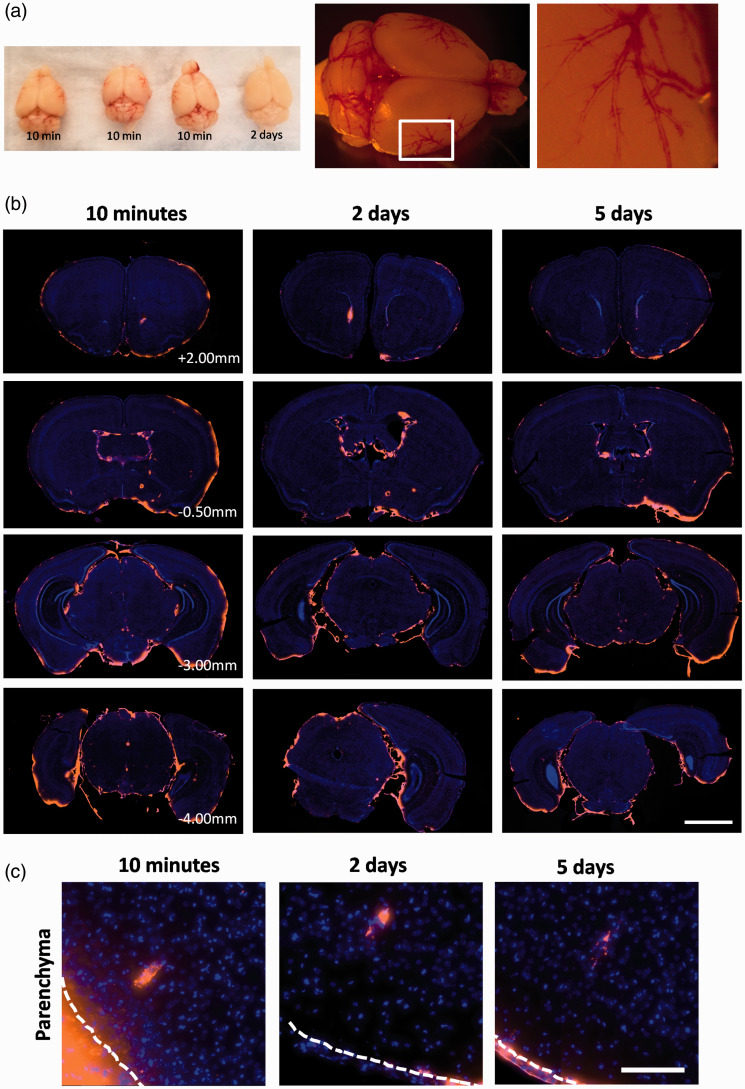
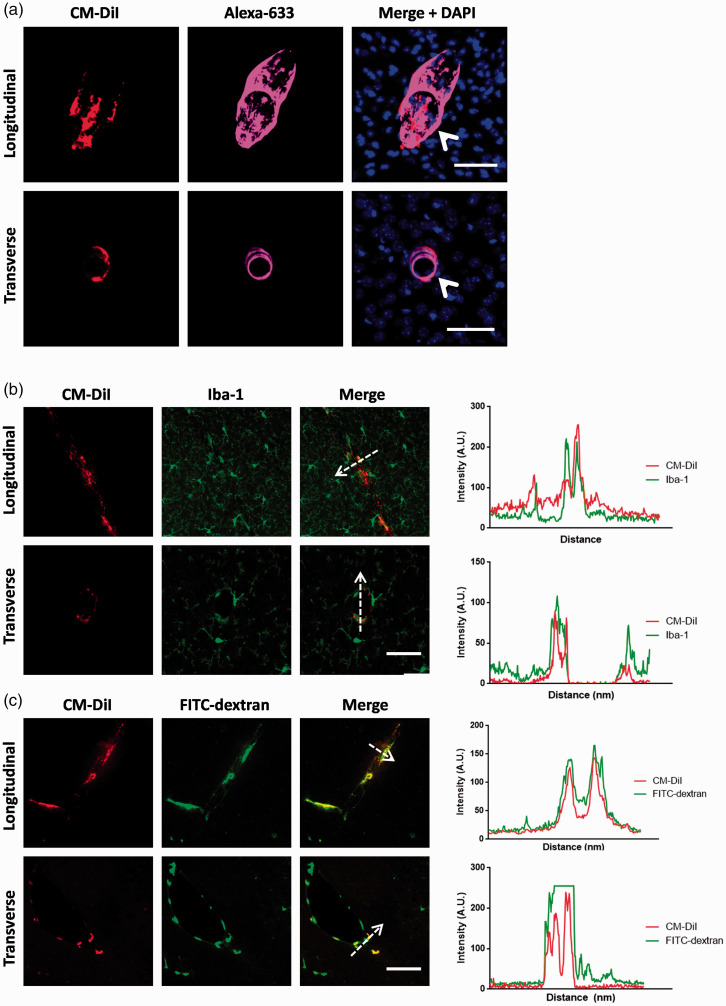
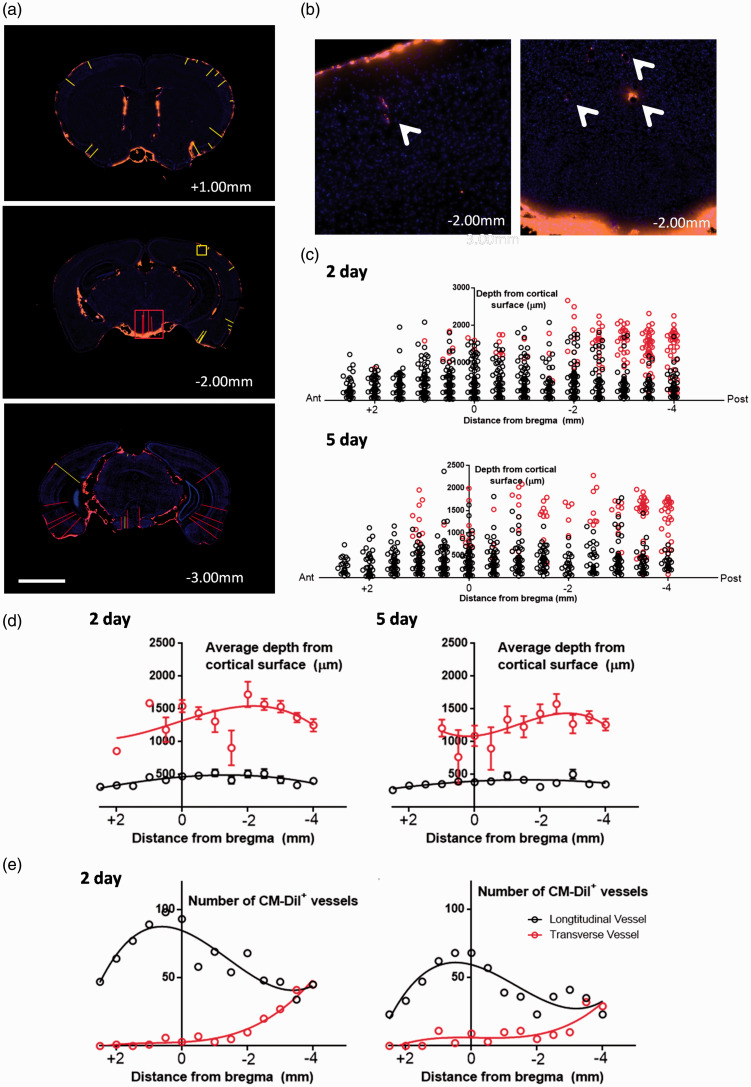
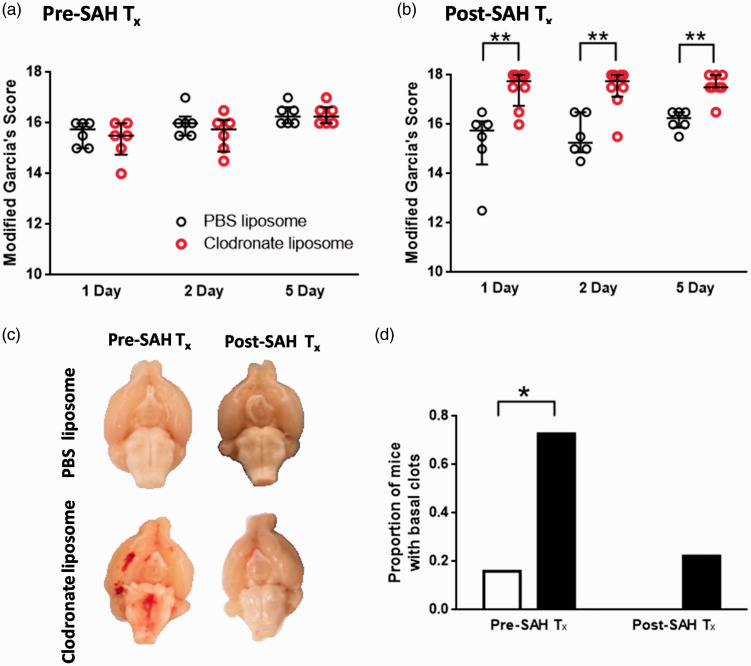
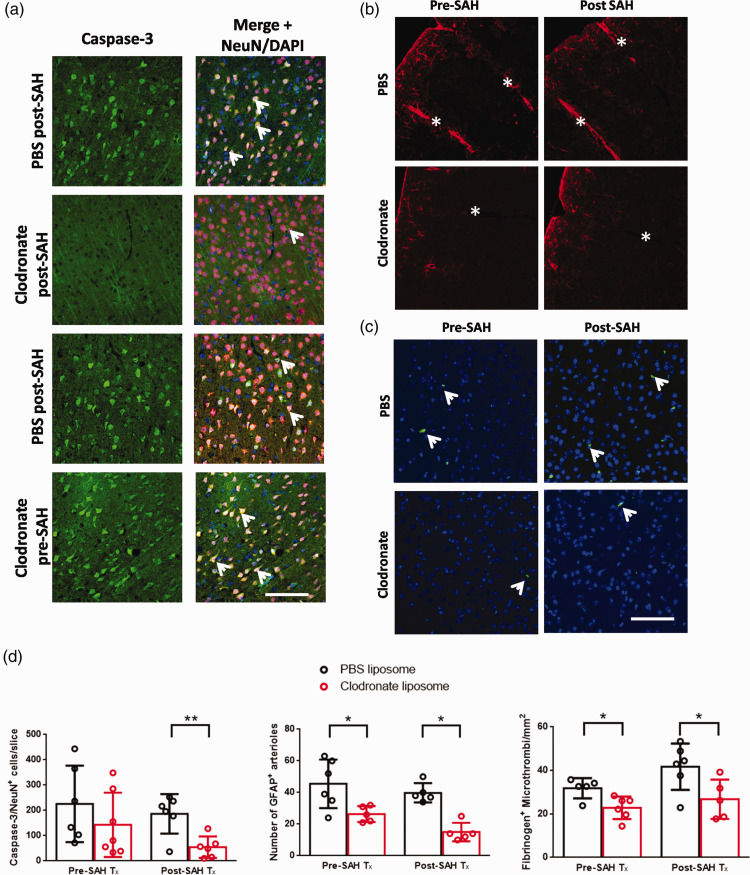
The distribution and clearance of erythrocytes after subarachnoid hemorrhage (SAH) is poorly understood. We aimed to characterize the distribution of erythrocytes after SAH and the cells involved in their clearance. To visualize erythrocyte distribution, we injected fluorescently-labelled erythrocytes into the prechiasmatic cistern of mice. 10 minutes after injection, we found labelled erythrocytes in the subarachnoid space and ventricular system, and also in the perivascular spaces surrounding large penetrating arterioles. 2 and 5 days after SAH, fluorescence was confined within leptomeningeal and perivascular cells. We identified the perivascular cells as perivascular macrophages based on their morphology, location, Iba-1 immunoreactivity and preferential uptake of FITC-dextran. We subsequently depleted meningeal and perivascular macrophages 2 days before or 3 hours after SAH with clodronate liposomes. At day 5 after SAH, we found increased blood deposition in mice treated prior to SAH, but not those treated after. Treatment post-SAH improved neurological scoring, reduced neuronal cell death and perivascular inflammation, whereas pre-treatment only reduced perivascular inflammation. Our data indicate that after SAH, erythrocytes are distributed throughout the subarachnoid space extending into the perivascular spaces of parenchymal arterioles. Furthermore, meningeal and perivascular macrophages are involved in erythrocyte uptake and play an important role in outcome after SAH.

Keywords: Perivascular macrophage; clodronate liposome; erythrocytes; inflammation; subarachnoid hemorrhage.


Conflict of interest statement

Declaration of conflicting interests: The author(s) declared no potential conflicts of interest with respect to the research, authorship, and/or publication of this article.

Figures

Figure 1.
Figure 1.
Allocation of mice and experimental design. (a) Allocation of mice in erythrocyte tracking experiments. (b) Allocation of mice in macrophage depletion experiments (Tx=treatment). †indicates a pilot group of mice, that were used only for analysis of clot burden (n = 3 mice for post-SAH clodronate treatment and n = 5 mice for post-SAH clodronate treatment). (c) Sacrifice timeline of mice in the erythrocyte tracking experiments. Mice were sacrificed at 10 minutes, 2 days and 5 days after SAH onset. (d) Design of macrophage depletion study. Clodronate/PBS liposomes are administered into the lateral ventricles 2 days before (pre-SAH treatment) or 3 hours after SAH induction. Neurobehavioral scoring was assessed 1, 2 and 5 days after SAH induction. Mice are sacrificed 5 days after SAH to observe degree of neuronal injury and perivascular inflammation after SAH; CL – Clodronate liposomes, PBSL – PBS liposomes. (e) Location of SAH burr hole relative to the location of the ventricular injection burr holes. (f) Clodronate depletes perivascular macrophages as demonstrated by absence of perivascular Iba-1 staining surrounding both transversely and longitudinally-cut vessels at 5 days after intraventricular clodronate injection (white arrows pointing to perivascular macrophages).
Figure 2.
Figure 2.
Macro- and microscopic distribution of erythrocytes after SAH. (a) Macroscopic images of mouse brains 10 minutes and 2 days after SAH. On the right is a mouse brain 10 minutes after SAH demonstrating macroscopic perivascular blood distribution. (b) Representative distribution of blood in the mouse brain in several coronal levels relative to bregma. Blood is labelled in orange, and nuclei are in the blue channel to highlight brain tissue (AP +2.00, +0.5 mm, –3.00 mm, –4.00 mm). Blood is distributed throughout the ventricular system and the base of the brain. Scale bar represents 2 mm (c) Dye can also be observed within the brain parenchyma at each time point, surrounding penetrating vessels. Note that dye appears to be contained in distinct cells at 2 and 5 days after SAH. White dotted line denotes the pia mater. Scale bar represents 250 µm.
Figure 3.
Figure 3.
Distribution and identity of parenchymal perivascular CM-DiI+ cells. These samples are stained at the 5 day time point. (a) The majority of parenchymal CM-DiI+ cells were located along vessels that are labelled with Alexa-633, which specifically labels larger arterioles (>20 µm). Both longitudinally and transversely cut vessels with surrounding CM-DiI+ cells were labelled with Alexa-633. Scale bar represents 50 µm (top row) or 20 µm (bottom row). (b) CM-DiI+ cells (red) express relatively low levels of Iba-1 (green). Note the co-localization of CM-DiI with Iba-1 immunolabelling, along the direction of the dotted arrow. Scale bar represents 40 µm. (c) All CM-DiI+ cells (red) were also involved in uptake of FITC-dextran (green). Note the co-localization of CM-DiI with FITC-dextran labelling, along the direction of the dotted arrow. Scale bar represents 40 µm. The perivascular location, low expression of Iba-1 (relative to surrounding microglia) and uptake of FITC-dextran indicate these cells are perivascular macrophages. Data are representative of n = 5 independent experiments.
Figure 4.
Figure 4.
Distribution of perivascular CM-DiI+ macrophages after SAH. (a) Representative coronal slices obtained 2 days after SAH, at +1.00 mm, −2.00 mm, and −3.00 mm from the bregma. Red lines indicate distance from cortical surface to a vessel that was perpendicular to the coronal cut (i.e., transverse vessel), and yellow lines indicate distance from cortical surface to a vessel that was parallel to the coronal cut (i.e., longitudinal vessel). Note that longitudinally-cut vessels with perivascular CM-DiI+ cells were found more often on the ipsilateral slide to the side of burr hole (right of mouse, left side of image), particularly towards the anterior brain. Scale bar represents 2 mm. (b) Inset of two regions from second slice in A (AP −2.00 mm) or a longitudinal vessel (inset of yellow box, right figure) or transverse vessel (inset of red box, left figure). (c) Graphical representation of the spatial distribution of cortical vessels with surrounding perivascular CM-DiI+ macrophages. Red circles indicate transversely-cut vessels, and black circles indicate longitudinally-cut vessels. (d) Summary data of the average cortical depth of transverse or longitudinal arterioles in various brain slices at 2 (left) or 5 (right) days. Note that transversely-cut vessels were typically found in deeper cortical regions than longitudinally-cut vessels. Data are expressed as means ± standard deviation. (e) Summary data of the total number of vessels that had surrounding perivascular CM-DiI+ macrophages. Note that the number of vessels peaked around the level of the bregma for longitudinally-cut vessels, whereas the number of transversely-cut vessels increases progressively towards the posterior sections. Curves of best fit are applied for data visualization. Data are obtained from n = 5 mice per time point in each graph from (d-e).
Figure 5.
Figure 5.
Gliosis surrounding blood vessels with perivascular CM-DiI+ macrophages and primary findings of erythrocyte tracking experiments. (a) Representative images of cortical blood vessels (highlighted with the dotted line), stained with GFAP, a specific marker of astrocytes. Increased GFAP expression (green) is associated with inflammation and gliosis. No significant gliosis was observed surrounding CM-DiI- vessels. In contrast, we observed a large increase in the perivascular GFAP expression surround blood vessels labelled with perivascular CM-DiI+ cells (red). Scale bar represents 30 µm. (b) Quantification of perivascular gliosis. CM-DiI+ vessels were compared to CM-DiI- vessels in the same animal for both 2 and 5 days after SAH. ***P < 0.0001, *P < 0.05, paired t-test (n = 4 independent samples/group). (c) Schematic of the primary findings in the erythrocyte tracing studies. At 10 minutes, free intact erythrocytes were found in the basal cisterns and ventricles. Intact erythrocytes were also found in the perivascular spaces of apical, basal and subcortical arterioles. At 2 days after SAH, there was decreased blood and erythrocytes in the basal cistern. Blood in the ventricles was phagocytosed by discrete cells. Erythrocyte uptake was observed by perivascular and meningeal macrophages (in purple) but not microglia. Perivascular gliosis was observed primarily around arterioles with perivascular macrophages that engaged in erythrocyte clearance (swollen endfeet, in blue). At 5 days after SAH, little or no blood was found in basal cisterns. Blood in the ventricles were contained by discrete cells. Some turnover of the perivascular macrophages and more perivascular inflammation were observed. Overall, we found that perivascular and meningeal macrophages are involved in erythrocyte clearance, and contribute to perivascular inflammation and neuronal cell death after SAH. Note that erythrocytes, macrophages and astrocytic endfeet are not drawn to scale.
Figure 6.
Figure 6.
Depletion of perivascular and meningeal macrophages affects gross behaviorial deficits and blood load after SAH. (a) (a) Neurological scoring of mice receiving pre-SAH treatment with clodronate or PBS liposomes. No difference in behavioural scoring was observed between the PBS and clodronate groups. (b) Neurological scoring of mice receiving post-SAH treatment of clodronate or PBS liposomes (n = 6 mice per group). Clodronate-treated mice scored significantly better in neurobehavioural scoring compared to the PBS-treated controls (*P < 0.05, **P < 0.01, Mann-Whitney-U test). (c) Representative ventral view of the brain surface of clodronate or PBS treated mice, sacrificed at 5 days after SAH. Typically, no blood is observed on the ventral brain surface by 5 days after SAH, but after clodronate pre-treatment, there was a clear basal clot in a significant proportion of mice compared with controls (quantified in (d), * P < 0.05, Fisher’s exact test).
Figure 7.
Figure 7.
Depletion of perivascular and meningeal macrophages affects neuronal cell death, perivascular gliosis and microthrombosis after SAH. (a) Representative images of caspase-3 (green) staining in PBS or clodronate treated mice. Images are merged with NeuN (red) and DAPI (blue). Positive cells are yellow in the merge (white arrows). (b) Representative GFAP staining visualizing astrocyte activation surrounding penetrating vessels after SAH in PBS or clodronate treated animals. Vessels are indicated with a white asterisk, and are identified by the presence of a vascular lumen. (c) Representative images of fibrinogen staining (green), with DAPI (blue) in PBS or clodronate treated mice. d) Quantification of neuronal cell death, perivascular gliosis and thrombosis in clodronate or PBS-treated animals. Neuronal cell death was only significantly reduced in SAH animals treated with clodronate vs. PBS controls treated on the same day. In both pre-SAH and post-SAH treated clodronate-treated SAH animals, the number of GFAP+ arterioles and number of thrombi was significantly reduced vs. PBS-treated animals from the same cohort, *P < 0.05, **P < 0.01, Student’s t-test, n = 5-6 per group. Scale bars: (a) 50 µm, (b,c) 60 µm.

Similar articles

Cited by

References

    1. Sandvei MS, Romundstad PlR, MüLler TommBrostrup, et al.. Risk factors for aneurysmal subarachnoid hemorrhage in a prospective population study: the HUNT study in Norway. Stroke 2009; 40: 1958–1962. - PubMed
    1. Rivero-Arias O, Gray A, Wolstenholme J.Burden of disease and costs of aneurysmal subarachnoid haemorrhage (aSAH) in the United Kingdom. Cost Eff Resour Alloc 2010; 8: 6. - PMC - PubMed
    1. Fujii M, Yan J, Rolland WB, et al.. Early brain injury, an evolving frontier in subarachnoid hemorrhage research. Transl Stroke Res 2013; 4: 432–446. - PMC - PubMed
    1. Macdonald RL.Delayed neurological deterioration after subarachnoid haemorrhage. Nat Rev Neurol 2014; 10: 44–58. - PubMed
    1. Rowland MJ, Hadjipavlou G, Kelly M, et al.. Delayed cerebral ischaemia after subarachnoid haemorrhage: looking beyond vasospasm. Br J Anaesth 2012; 109: 315–329. - PubMed

Publication types

MeSH terms

LinkOut - more resources