. 2021 Mar 1;131(5):e141380.
doi: 10.1172/JCI141380.

Targeting a Braf/Mapk pathway rescues podocyte lipid peroxidation in CoQ-deficiency kidney disease

Affiliations

Targeting a Braf/Mapk pathway rescues podocyte lipid peroxidation in CoQ-deficiency kidney disease

Eriene-Heidi Sidhom et al. J Clin Invest. .

Abstract

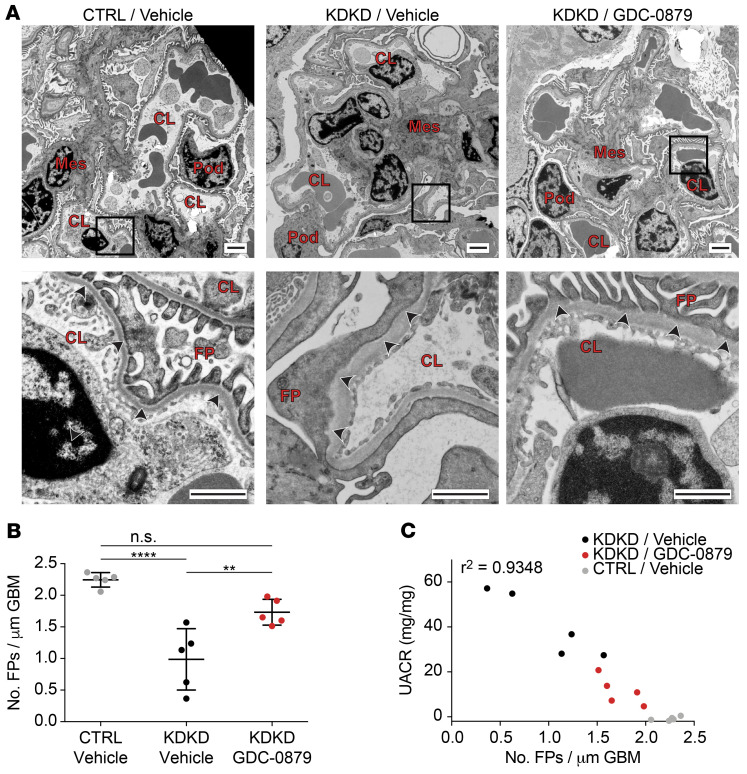
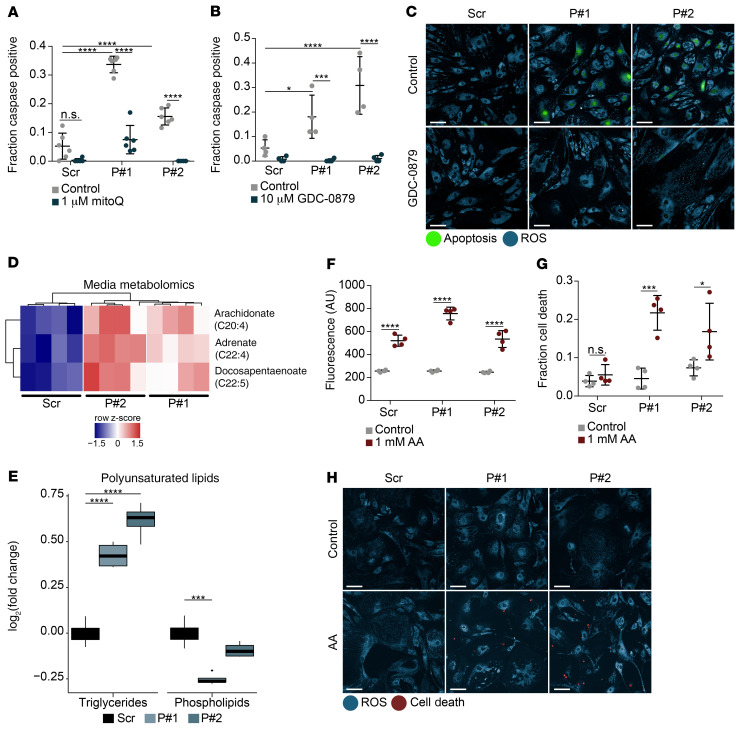
Mutations affecting mitochondrial coenzyme Q (CoQ) biosynthesis lead to kidney failure due to selective loss of podocytes, essential cells of the kidney filter. Curiously, neighboring tubular epithelial cells are spared early in disease despite higher mitochondrial content. We sought to illuminate noncanonical, cell-specific roles for CoQ, independently of the electron transport chain (ETC). Here, we demonstrate that CoQ depletion caused by Pdss2 enzyme deficiency in podocytes results in perturbations in polyunsaturated fatty acid (PUFA) metabolism and the Braf/Mapk pathway rather than ETC dysfunction. Single-nucleus RNA-Seq from kidneys of Pdss2kd/kd mice with nephrotic syndrome and global CoQ deficiency identified a podocyte-specific perturbation of the Braf/Mapk pathway. Treatment with GDC-0879, a Braf/Mapk-targeting compound, ameliorated kidney disease in Pdss2kd/kd mice. Mechanistic studies in Pdss2-depleted podocytes revealed a previously unknown perturbation in PUFA metabolism that was confirmed in vivo. Gpx4, an enzyme that protects against PUFA-mediated lipid peroxidation, was elevated in disease and restored after GDC-0879 treatment. We demonstrate broader human disease relevance by uncovering patterns of GPX4 and Braf/Mapk pathway gene expression in tissue from patients with kidney diseases. Our studies reveal ETC-independent roles for CoQ in podocytes and point to Braf/Mapk as a candidate pathway for the treatment of kidney diseases.

Keywords: Cell Biology; Chronic kidney disease; Genetic diseases; Mitochondria; Nephrology.


Conflict of interest statement

Conflict of interest: AG has a financial interest in Goldfinch Biopharma in the form of equity.

Figures

Figure 1
Figure 1. SNuc-Seq from kidneys of Pdss2kd/kd mice reveals a podocyte-specific Mapk pathway, and treatment of mice with the Braf/Mapk-targeted compound GDC-0879 reverses kidney filter damage.
(A) UMAP visualization of single-nucleus transcriptomic profiles from three 5-month-old Pdss2kd/kd mice (KDKD) and 3 age-matched control mice (CTRL). Cell-type clusters identified by canonical marker genes. (B) Proportions of clusters across control and Pdss2kd/kd mice (left) with corresponding cell numbers (right). Pdss2kd/kd-specific clusters indicated with black arrowheads. CNT, connecting tubule; CD, collecting duct; PC, principal cell; IC, intercalated cell. (C) Analysis of leading edge genes from GSEA on differentially expressed genes between control and Pdss2kd/kd podocytes shows 3 pathway clusters: an actin cytoskeleton pathway (Actb, Actg1, Actn4, Actn1), a Mapk pathway (Raf1, Mapk1, Braf), and an ETC pathway (Uqcrq, Cox6a1, Uqcrh, Ndufs7). (D) Dot plot shows gene expression of Mapk pathway genes identified by GSEA in podocyte and PT clusters in control versus KDKD mice. (E) Urine albumin to creatinine ratio (UACR) of Pdss2kd/kd mice treated with 100 mg/kg/d or vehicle for 14 days. n = 5 animals per condition. Two-way ANOVA, Tukey’s multiple comparison test. ***P < 0.001.
Figure 2
Figure 2. Histologic analysis of mouse kidney tissue demonstrates podocyte filter barrier rescue by GDC-0879.
(A) Electron micrographs of kidneys of control, vehicle-treated KDKD, and GDC-0879–treated KDKD mice to assess integrity of the kidney filter, measured by the appearance and number of podocyte foot processes (arrowheads). Diffuse foot process simplification (called effacement) is seen in glomeruli of vehicle-treated KDKD mice. Rescue of foot process effacement is observed following treatment with GDC-0879. Pod, podocyte; Mes, mesangial cell; CL, capillary lumen; FP, podocyte foot processes. Scale bars: 2 μm (upper); 1 μm (lower). (B) Vehicle-treated KDKD mice have significantly reduced podocyte foot process numbers, which is reversed following treatment with GDC-0879. n = 5 animals per condition; 14–16 images quantified per animal.Shapiro-Wilk normality test, 1-way ANOVA, Tukey’s multiple comparison test. (C) Decreased number of foot processes correlates with escalating individual animal proteinuria levels. **P < 0.01; ****P < 0.0001.
Figure 3
Figure 3. Metabolomics reveal altered lipid/PUFA profiles in CoQ-deficient Pdss2-depleted podocytes.
(A) Caspase-positive quantification of podocytes expressing either scrambled or Pdss2-targeted shRNAs (P#1, P#2) and rescue of apoptosis with mitoQ. n = 6. (B) Apoptosis quantification after 1-week GDC-0879 treatment of Pdss2-depleted podocytes and scrambled controls. n = 4. (C) Live-cell fluorescence imaging of cellular ROS (blue) and apoptosis (green) in cells treated with GDC-0879 (10 μM). Scale bars: 100 μm. (D) Heatmap of statistically significant metabolites (FDR < 10%, Benjamini-Hochberg correction on Student’s t test) from conditioned media of Pdss2-depleted podocytes versus scrambled controls. n = 4. (E) Log2 fold change of polyunsaturated TAGs and polyunsaturated PLs in Pdss2-depleted podocytes versus scrambled controls. n = 4. Polyunsaturated lipids limited to lipids with 4–8 double bonds. (F) Cellular ROS quantification after AA treatment for 12 hours. n = 4. (G) Cell viability quantification after AA treatment for 84 hours, n = 4. (H) Live cell fluorescence imaging of cellular ROS (blue) and cell death (red) in cells treated with AA (1 mM) for 84 hours. Scale bars: 100 μm. Two-way ANOVA, Tukey’s multiple comparison test, unless otherwise noted. *P < 0.05; ***P < 0.001; ****P < 0.0001.
Figure 4
Figure 4. Retinoic acid exacerbates podocyte injury and increases the abundance of PUFAs, whose effect on Mapk signaling is mitigated by GDC-0879.
(A) Significantly enriched KEGG pathways following GSEA on bulk RNA-Seq data from Pdss2-depleted podocytes versus scrambled controls. n = 3. (B) Luminescence readout from RARE -luciferase reporter assay following 24 hours of treatment with 100 nM atRA or 48 hours of treatment with 10 μM GGdP. Both increase Rar-mediated transcription. n = 3. (C) Luminescence readout from RARE-luciferase reporter assay, showing Rar-mediated transcription from Pdss2-depleted podocytes versus scrambled controls at baseline and after either 10 μM GGdP or 100 nM atRA. n = 3. (D) Cell death quantification after atRA treatment for 4 days. n = 4. Two-way ANOVA, Šidák’s multiple comparison test. (E) Live cell fluorescence imaging of cellular ROS (blue) and cell death (red) in cells treated with atRA (1 μM) for 84 hours. Scale bars: 100 μm. (F) Heatmap of statistically significant metabolites (FDR <10%, Benjamini-Hochberg correction on Student’s t test) from podocyte-conditioned media treated with 1 μM atRA versus DMSO control. n = 3. (G) Representative Western blot of P-ERK1/2 and total ERK1/2. Increased ERK1/2 phosphorylation following treatment with AA (500 μM) is reversed with GDC-0879 (10 μM). (H) Densitometric Western blot quantification of n = 4 biological replicates. Two-way ANOVA, Tukey’s multiple comparison test, unless otherwise noted. **P < 0.01; ***P < 0.001; ****P < 0.0001.
Figure 5
Figure 5. Podocyte-specific lipid metabolism pathways identified in vivo independently validate pathways derived in vitro.
(A) Violin plot of PUFA gene signatures (PUFA up: upregulated PUFA gene signature; PUFA down: downregulated PUFA gene signature) in podocytes versus all PT clusters combined. (B) Cohen’s d effect size in PUFA gene signatures across all clusters with significance determined by 1-tailed Wilcoxon’s rank sum test (alternative hypothesis: control left-shifted compared with KDKD for PUFA up; control right-shifted compared with KDKD for PUFA down). (C) Dot plot shows gene expression of Gpx4 in podocyte and PT clusters in control versus KDKD mice. (D) Immunofluorescence staining for Gpx4 and podocytes (Synpo) in control versus KDKD mice shows increased Gpx4 expression in KDKD glomeruli. Scale bars: 100 μm. (E) Violin plots of individual glomeruli Gpx4 immunofluorescence quantification in vehicle-treated control and KDKD mice and GDC-0879-treated KDKD mice. n = 4 animals per condition; 2 sections analyzed per animal. Wilcoxon’s rank sum test with Bonferroni’s correction (n = 3 comparisons). *P < 0.05; **P < 0.01; ****P < 0.0001.
Figure 6
Figure 6. Mapk and lipid peroxidation gene-expression profiles in human kidney diseases associated with podocyte injury.
(A) Summary of NephroSeq, version 5, data filtered for significant results (P < 0.05), fold change > 1.5 (disease versus control), and Pearson’s correlation coefficient, r > 0.5 (Proteinuria) show increased GPX4 and Mapk pathway gene expression in human kidney disease samples (left) and correlation with disease severity, as measured by proteinuria (right). SYNPO expression, used as a control, is expected to be decreased in diseases involving podocyte injury. (B) Scatter plot showing correlation between Mapk pathway gene expression, RAF1, and proteinuria in human FSGS. (C) Scatter plot showing correlation among lipid peroxidation gene expression, GPX4, and proteinuria in human kidney disease samples (FSGS). (D) Scatter plot showing correlation between GPX4 and RAF1 gene expression in human FSGS.

Similar articles

Cited by

References

    1. Zhou Y, et al. A small-molecule inhibitor of TRPC5 ion channels suppresses progressive kidney disease in animal models. Science. 2017;358(6368):1332–1336. doi: 10.1126/science.aal4178. - DOI - PMC - PubMed
    1. Yu H, et al. A role for genetic susceptibility in sporadic focal segmental glomerulosclerosis. J Clin Invest. 2016;126(3):1067–1078. doi: 10.1172/JCI82592. - DOI - PMC - PubMed
    1. Dvela-Levitt M, et al. Small molecule targets TMED9 and promotes lysosomal degradation to reverse proteinopathy. Cell. 2019;178(3):521–535. doi: 10.1016/j.cell.2019.07.002. - DOI - PubMed
    1. Endo A. A historical perspective on the discovery of statins. Proc Jpn Acad Ser B Phys Biol Sci. 2010;86(5):484–493. doi: 10.2183/pjab.86.484. - DOI - PMC - PubMed
    1. Priori SG. Inherited arrhythmogenic diseases. Circ Res. 2004;94(2):140–145. doi: 10.1161/01.RES.0000115750.12807.7E. - DOI - PubMed

Publication types

MeSH terms

Substances

Supplementary concepts