. 2021 Feb 15;131(4):e140903.
doi: 10.1172/JCI140903.

Disrupting the DREAM transcriptional repressor complex induces apolipoprotein overexpression and systemic amyloidosis in mice

Affiliations

Disrupting the DREAM transcriptional repressor complex induces apolipoprotein overexpression and systemic amyloidosis in mice

Pirunthan Perampalam et al. J Clin Invest. .

Abstract

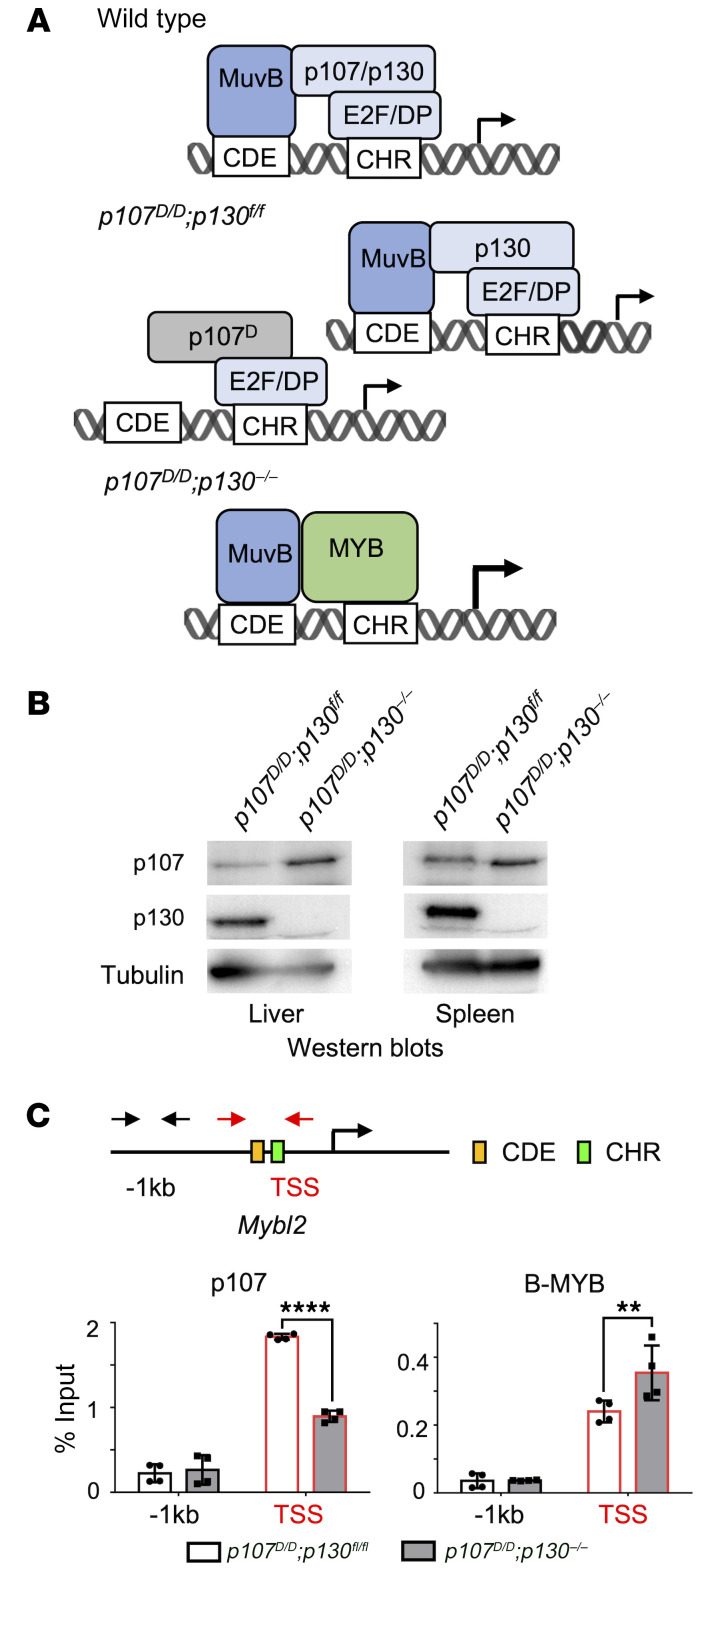
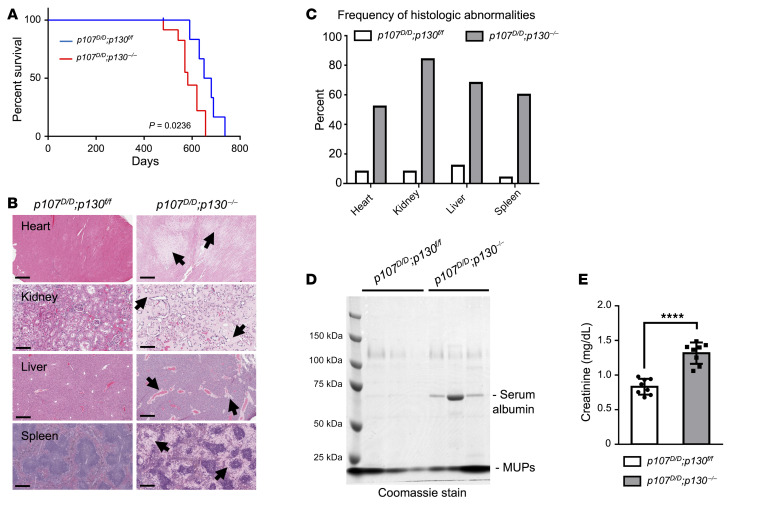
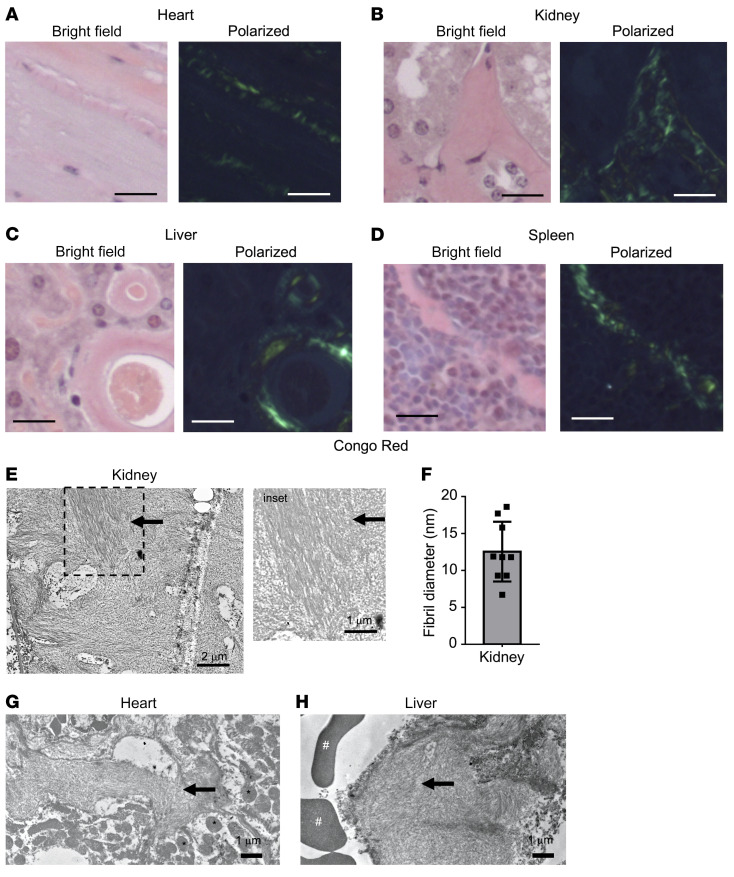
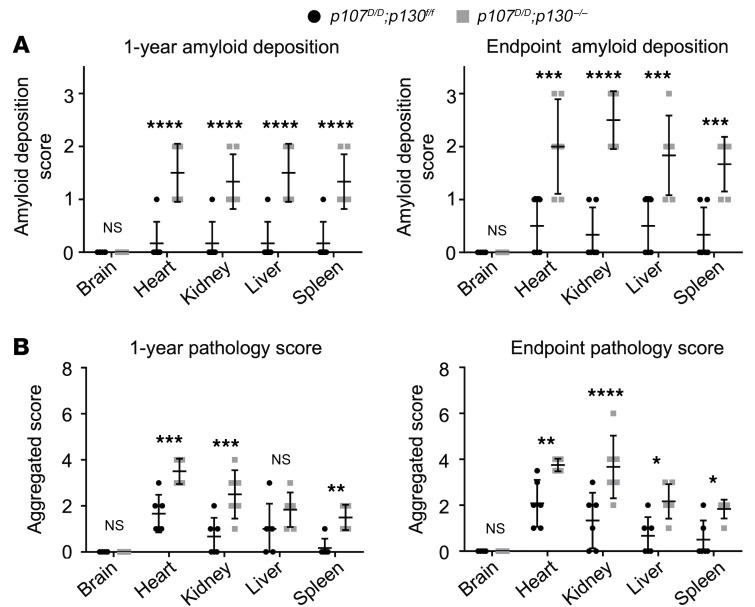
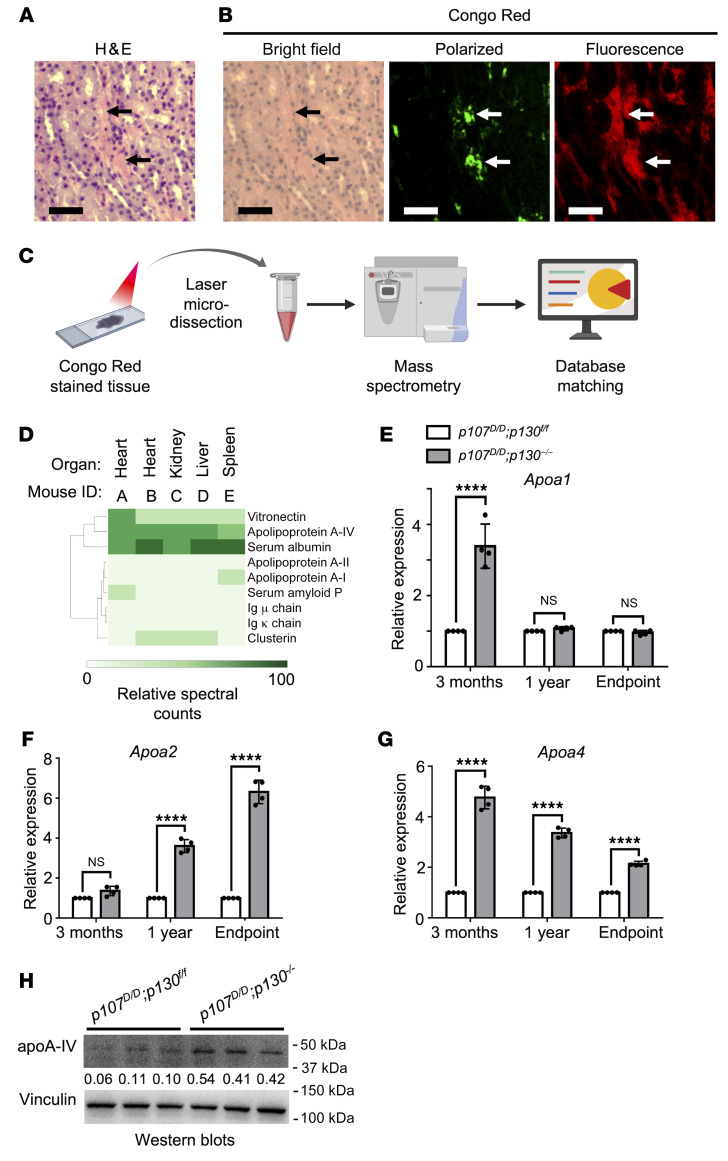
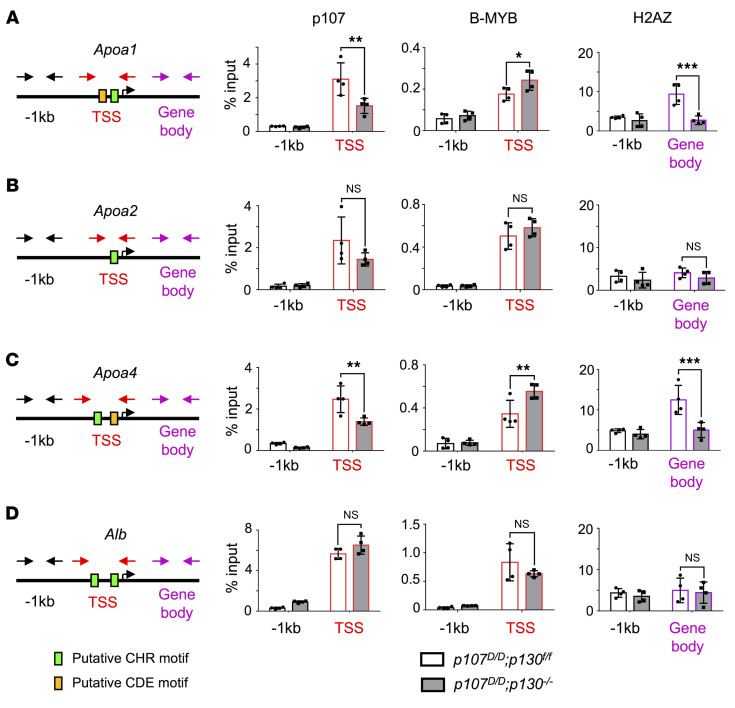
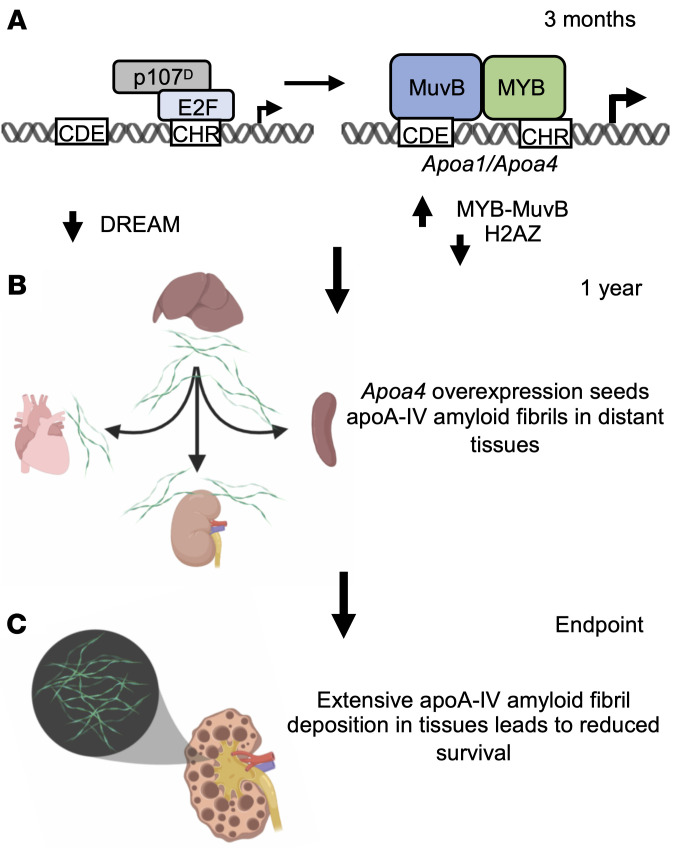
DREAM (Dp, Rb-like, E2F, and MuvB) is a transcriptional repressor complex that regulates cell proliferation, and its loss causes neonatal lethality in mice. To investigate DREAM function in adult mice, we used an assembly-defective p107 protein and conditional deletion of its redundant family member p130. In the absence of DREAM assembly, mice displayed shortened survival characterized by systemic amyloidosis but no evidence of excessive cellular proliferation. Amyloid deposits were found in the heart, liver, spleen, and kidneys but not the brain or bone marrow. Using laser-capture microdissection followed by mass spectrometry, we identified apolipoproteins as the most abundant components of amyloids. Intriguingly, apoA-IV was the most detected amyloidogenic protein in amyloid deposits, suggesting apoA-IV amyloidosis (AApoAIV). AApoAIV is a recently described form, whereby WT apoA-IV has been shown to predominate in amyloid plaques. We determined by ChIP that DREAM directly regulated Apoa4 and that the histone variant H2AZ was reduced from the Apoa4 gene body in DREAM's absence, leading to overexpression. Collectively, we describe a mechanism by which epigenetic misregulation causes apolipoprotein overexpression and amyloidosis, potentially explaining the origins of nongenetic amyloid subtypes.

Keywords: Epigenetics; Lipoproteins; Mouse models; Nephrology; Vascular Biology.


Conflict of interest statement

Conflict of interest: The authors have declared that no conflict of interest exists.

Figures

Figure 1
Figure 1. DREAM assembly is disrupted in p107D/D p130–/– mice.
(A) Either one of the RB-like proteins, p107 or p130, can participate in DREAM assembly by binding to MuvB in WT mice and repressing transcription. In p107D/D p130+/+ mice, the p107D mutation prevents it from binding MuvB, rendering p107D unable to participate in DREAM assembly but still able to form p107-E2F complexes at CHR elements. p130 is now the only RB-like family member able to mediate DREAM assembly in p107D/D p130+/+ mice. In p107D/D p130–/– mice, ablation of p130 (p130–/–) combined with p107D prevents DREAM assembly. The MuvB core now binds to B-MYB to form MYB-MuvB and activates transcription. (B) Protein extracts were prepared from the livers and spleens of 3-month-old p107D/D p130–/– and p107D/D p130fl/fl control mice. The expression of p107D and p130 protein levels was detected by Western blotting, and tubulin served as a loading control. (C) ChIP-qPCR assay to detect p107D and B-MYB binding at the TSS of Mybl2, a known DREAM target. Illustration depicts the primers used for qPCR and the regions of interest: black arrows indicate the negative control 1 kb upstream of the TSS, and red arrows indicate an approximately 100 bp region surrounding the TSS and containing CDE (blue box) and CHR (green) motifs. Chromatin was prepared from livers, and p107 and B-MYB antibodies were used to precipitate associated DNA (n = 4 for each). Graphs show mean quantities of the indicated genome locations precipitated, and error bars indicate 1 SD. Two-way ANOVA was performed for each graph, and significance levels are indicated (**P < 0.01; ****P < 0.0001).
Figure 2
Figure 2. p107D/D p130–/– mice have shortened lifespan and compromised organ function.
(A) Cohorts of p107D/D p130–/– (n = 30) and p107D/D p130fl/fl control mice (n = 37) were aged to humane endpoints. Kaplan-Meier survival plots reveal survival proportions and a log-rank test was used to compare outcomes (P = 0.0236). (B) H&E staining of tissues obtained from p107D/D p130fl/fl and p107D/D p130–/– mice at endpoint. Examples of poorly staining homogeneous, acellular, eosinophilic areas found in p107D/D p130–/– mice are indicated by arrows. Data are representative of 21 p107D/D p130fl/fl and 25 p107D/D p130–/– mice. Scale bars: 400 μm for heart, liver, and spleen. Scale bars: 100 μm for kidney. (C) Frequency of histologic abnormalities in p107D/D p130fl/fl (n = 21) and p107D/D p130–/– mice (n = 25) for each of the indicated organs. (D) Urine samples were collected from endpoint p107D/D p130fl/fl and p107D/D p130–/– mice, and proteins were resolved on SDS-PAGE gel and stained with Coomassie blue. MUPs, major urinary proteins. (E) Serum samples were collected from endpoint mice and were analyzed for levels of creatinine. Bar graph represents mean quantities for the indicated genotypes, and error bars indicate 1 SD (n = 8). ****P < 0.0001, by Student’s t test.
Figure 3
Figure 3. Systemic amyloidosis in p107D/D p130–/– mice.
(AD) Tissue sections of heart (A), kidney (B), liver (C), and spleen (D) from endpoint p107D/D p130–/– mice were stained with Congo red. Bright field images were captured along with corresponding apple green birefringence under polarized light. Scale bars: 20 μm. (E) FFPE tissues were processed for TEM. Ultrastructure of acellular material in the kidney is shown. Black arrows indicate fibril structure in this organ. Scale bars: 2 μm and 1 μm (enlarged inset). (F) Fibril diameters in kidney TEM images were measured. Bar graph represents mean diameter obtained from individual fibril measurements, and error bars indicate 1 SD (n = 9). (GH) TEM images of FFPE heart (G) and liver (H) tissue. Black arrows indicate areas of fibril deposition. For orientation, the asterisk indicates mitochondria in cardiomyocytes, and the pound sign denotes red blood cells in a hepatic capillary.
Figure 4
Figure 4. Tissue distribution and disease severity of amyloidosis in p107D/D p130–/– mice.
(A) Tissues from 1-year-old and endpoint mice from p107D/D p130fl/fl and p107D/D p130–/– cohorts were scored for amyloid deposition on a scale of 0–3 (n = 6). Average scores were plotted for 1-year-old and endpoint mice and error bars represent 1 SD. Means were compared by 2-way ANOVA and significance levels are indicated (***P < 0.001; ****P < 0.0001; and NS is not significant, P > 0.05). (B) Tissues from 1-year-old and endpoint mice from p107D/D p130fl/fl and p107D/D p130–/– cohorts were scored for 3 criteria (amyloid deposition, cellular degeneration, inflammation) on a scale of 0–3 (n = 6). Scores were aggregated for each mouse and plotted. Mean scores are indicated along with 1 SD. Means were compared by 2-way ANOVA, and significance levels are indicated (*P < 0.05; **P < 0.01; ***P < 0.001; ****P < 0.0001; and NS, P > 0.05).
Figure 5
Figure 5. ApoA-IV is the most abundant amyloidogenic protein in p107D/D p130–/– amyloid deposits.
(A) H&E staining of kidney from an endpoint p107D/D p130–/– mouse. Arrows indicate acellular eosinophilic material. Scale bar: 50 μm. (B) Congo red staining of a serial section of the same kidney as in A. Black arrows indicate the same acellular material under bright-field optics as in A. White arrows mark the same locations under polarized and fluorescent optics. Scale bars: 50 μm. (C) Schematic illustration of LMD/MS procedure: Congo red–positive regions were laser captured and processed for mass spectrometry to identify peptides present in amyloids. (D) Per spectral match quantities were scaled relative to the most abundant protein in each sample, apoE. Rows (proteins) were clustered and values are represented as indicated by the scale at the bottom. Each column represents an organ from an endpoint p107D/D p130–/– mouse. (EG) Total RNA was used to synthesize cDNA. Gene expression was determined by qPCR in 3-month-old, 1-year-old, and endpoint p107D/D p130fl/fl and p107D/D p130–/– mice and normalized to Gapdh for each age group (n = 4). Bar graphs show mean expression values for Apoa1 (E), Apoa2 (F), Apoa4 (G) and error bars represent 1 standard deviation. Values are normalized to that of p107D/D p130fl/fl at each age for each gene. Two-way ANOVA was performed for each gene and significance levels are indicated (****P < 0.0001; NS, P > 0.05). (H) Protein extracts from the livers of 3-month-old p107D/D p130fl/fl and p107D/D p130–/– mice were Western blotted for the indicated proteins. Numerical values represent band intensity ratio of apoA-IV relative to vinculin.
Figure 6
Figure 6. B-MYB is recruited to Apoa1 and Apoa4 promoters in DREAM assembly–deficient p107D/D p130–/– mice.
(AD) Chromatin was prepared from livers of 3-month-old p107D/D p130fl/fl and p107D/D p130–/– mice and utilized in ChIP assays to detect p107D, B-MYB, and H2AZ occupancy at promoters (n = 4). For each of Apoa1 (A), Apoa2 (B), Apoa4 (C), and Alb (D) genes, a schematic is shown to illustrate primer annealing sites. Arrows depicting primers are color coded: black represents a neutral location 1 kb upstream of the TSS; red is an approximately 100 bp region encompassing the CHR and/or CDE motifs near the TSS; purple is within the gene body. ChIP protein targets p107, B-MYB, and H2AZ are organized in columns across the top. Bar graphs depict the mean quantity of chromatin associated with each protein target as detected by qPCR and error bars represent 1 standard deviation. Two-way ANOVA was performed for each graph and significance levels are indicated (*P < 0.05; **P < 0.01; ***P < 0.001; and NS, P > 0.05).
Figure 7
Figure 7. Loss of DREAM assembly in p107D/D p130–/– mice promotes MYB-MuvB assembly that drives systemic AApoAIV amyloidosis due to constitutive overexpression of Apoa4.
A schematic model illustrating the development of systemic AApoAIV amyloidosis in p107D/D p130–/– mice. At 3 months of age, ablation of p130 by Cre activation combined with mutant p107D prevents DREAM assembly and promotes MYB-MuvB activation of transcription. In the liver, MYB-MuvB occupies CHR and CDE motifs at the TSSs of apolipoprotein genes, particularly Apoa4, leading to reduced H2AZ occupancy within its gene body and constitutive overexpression (A). In 1-year-old p107D/D p130–/– mice, small amyloid deposits are evident in the heart, liver, kidney, and spleen (B). By 2 years of age, apoA-IV deposition was more pronounced in the heart, liver, and spleen. Deposition in the kidney of most p107D/D p130–/– mice led to organ failure and reduced survival (C).

Similar articles

Cited by

References

    1. Wechalekar AD, et al. Systemic amyloidosis. The Lancet. 2016;387(10038):2641–2654. doi: 10.1016/S0140-6736(15)01274-X. - DOI - PubMed
    1. Benson MD, et al. Amyloid nomenclature 2018: recommendations by the International Society of Amyloidosis (ISA) nomenclature committee. Amyloid. 2018;25(4):215–219. doi: 10.1080/13506129.2018.1549825. - DOI - PubMed
    1. Luo H, et al. Extracellular deposition of mouse senile AApoAII amyloid fibrils induced different unfolded protein responses in the liver, kidney, and heart. Lab Invest. 2015;95(3):320–333. doi: 10.1038/labinvest.2014.158. - DOI - PubMed
    1. Nuvolone M, Merlini G. Systemic amyloidosis: novel therapies and role of biomarkers. Nephrol Dial Transplant. 2017;32(5):770–780. - PubMed
    1. Das M, Gursky O. Amyloid-forming properties of human apolipoproteins: sequence analyses and structural insights. Adv Exp Med Biol. 2015;855:175–211. doi: 10.1007/978-3-319-17344-3_8. - DOI - PMC - PubMed

Publication types

MeSH terms

Grants and funding