. 2021 Jan 14;19(1):e3001061.
doi: 10.1371/journal.pbio.3001061. eCollection 2021 Jan.

Versatile CRISPR/Cas9-mediated mosaic analysis by gRNA-induced crossing-over for unmodified genomes

Affiliations

Versatile CRISPR/Cas9-mediated mosaic analysis by gRNA-induced crossing-over for unmodified genomes

Sarah E Allen et al. PLoS Biol. .

Abstract

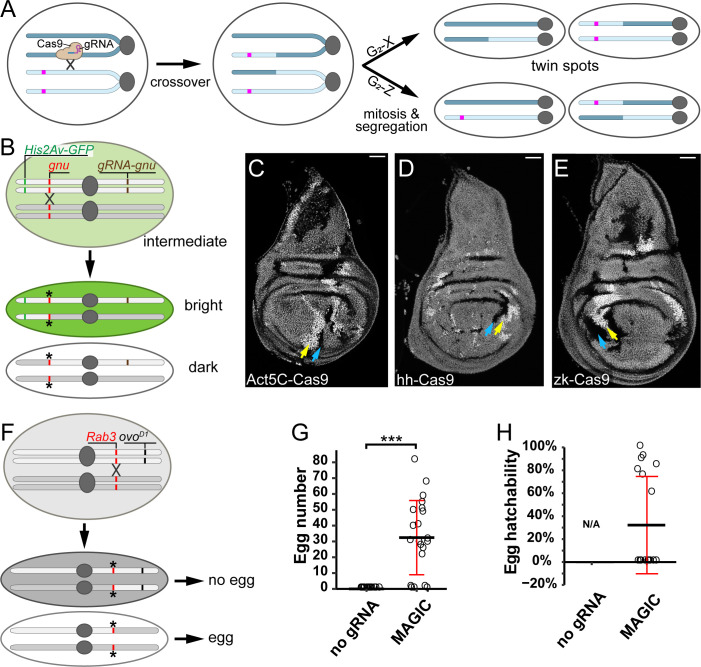
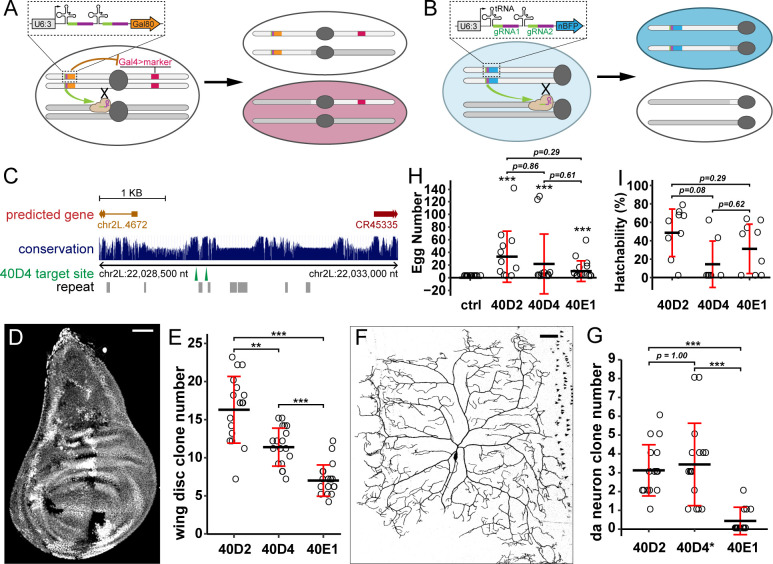
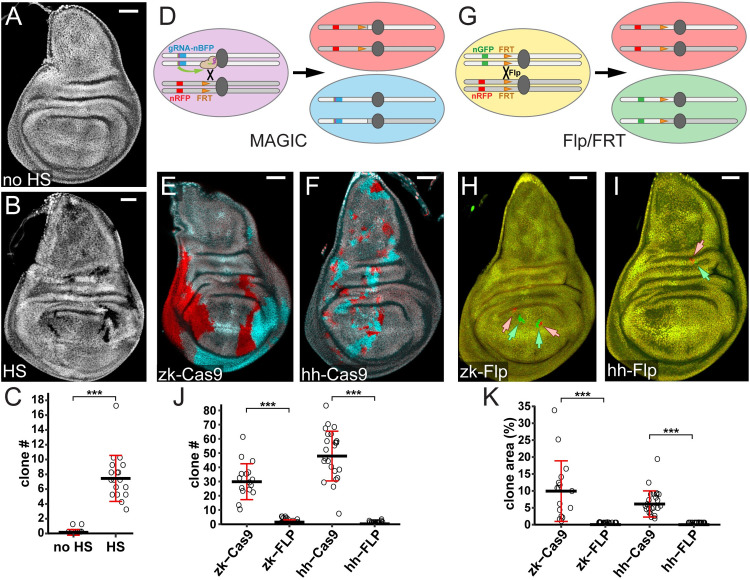
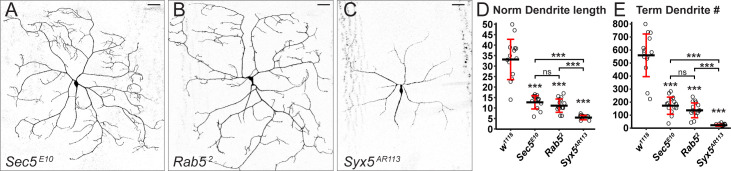
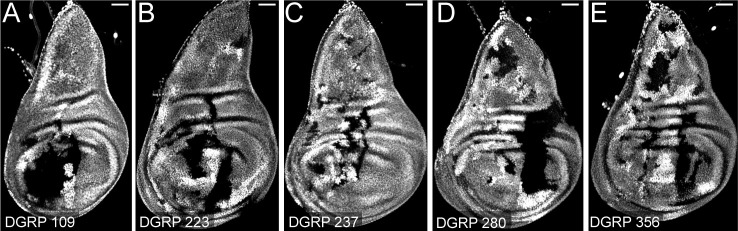
Mosaic animals have provided the platform for many fundamental discoveries in developmental biology, cell biology, and other fields. Techniques to produce mosaic animals by mitotic recombination have been extensively developed in Drosophila melanogaster but are less common for other laboratory organisms. Here, we report mosaic analysis by gRNA-induced crossing-over (MAGIC), a new technique for generating mosaic animals based on DNA double-strand breaks produced by CRISPR/Cas9. MAGIC efficiently produces mosaic clones in both somatic tissues and the germline of Drosophila. Further, by developing a MAGIC toolkit for 1 chromosome arm, we demonstrate the method's application in characterizing gene function in neural development and in generating fluorescently marked clones in wild-derived Drosophila strains. Eliminating the need to introduce recombinase-recognition sites into the genome, this simple and versatile system simplifies mosaic analysis in Drosophila and can in principle be applied in any organism that is compatible with CRISPR/Cas9.


Conflict of interest statement

The authors have declared that no competing interests exist.

Figures

Fig 1
Fig 1. CRISPR-induced crossover generates somatic and germline clones in Drosophila.
(A) A diagram illustrating the principle of MAGIC. The magenta bar indicates a marker that is lost from 1 daughter cell and becomes homozygous in the other in G2-X-generated twin spots. (B) Strategy for generating mosaic clones using the His2Av-GFP marker and a crossover at the gnu locus. Locations of the GFP marker (His2Av-GFP, green bar), the gRNA (gnu-gRNA, brown bar), and the target of the gRNA (gnu, red bar) are shown. Asterisks indicate mutated gRNA target sites. (C–E) Mosaic clones in wing discs visualized by levels of His2Av-GFP expression, as described in the text. A pair of arrows indicate His2Av-GFP+/+ (yellow) and His2Av-GFP−/− (blue) cells in each panel. Clones were induced by Act5C-Cas9 (C), hh-Cas9 (D), and zk-Cas9 (E). Scale bars, 50 μm. (F) Strategy for generating and detecting clones in the female germline using ovoD1. Figure labels are analogous to those in 1B; the gRNA is on another chromosome. (G) Number of eggs produced by females carrying nos-Cas9 and ovoD1, with (MAGIC) or without (no gRNA) gRNA-Rab3. ***p < 0.001, Student t test. n = number females: no gRNA (n = 18); MAGIC (n = 18). (H) Hatchability of eggs produced females carrying nos-Cas9 and ovoD1, with (MAGIC) or without (no gRNA) gRNA-Rab3. n = number females: no gRNA (N/A); MAGIC (n = 18). For quantifications in G and H, black bar, mean; red bar, SD. The data underlying this Figure can be found in S1 Data. GFP, green fluorescent protein; gRNA, guide RNA; MAGIC, mosaic analysis by gRNA-induced crossing-over.
Fig 2
Fig 2. A toolkit for generating labeled clones for genes on chromosome arm 2L.
(A) Strategy of pMAGIC for generating positively labeled clones for genes on 2L using Gal80. (B) Strategy of nMAGIC for genes on 2L using nuclear BFP marker. (C) A map for gRNA-(40D4) target sites derived from the UCSC Genome Browser. The height of the blue bar corresponds to the level of conservation among 23 Drosophila species. The locations of predicted genes (thick line, exon or mature RNA; thin line, intron; arrow, gene orientation), repeated DNA sequences (gray boxes), gRNA target sites (green arrowheads), and chromosomal coordinates are indicated. (D) A wing imaginal disc showing twin-spot clones generated by gRNA-40D2(nBFP) paired with hh-Cas9. (E) Number of clones in wing discs using 3 different gRNA(nBFP) constructs. n = number of discs: 40D2 (n = 17); 40D4 (n = 18); 40E1 (n = 18). **p ≤ 0.01, ***p ≤ 0.001; Welch ANOVA and Welch t tests, p-values corrected using Bonferroni method. (F) A C4da neuron clone generated by gRNA-40D2(Gal80) paired with SOP-Cas9 and ppk>CD4-tdTom. (G) Quantification of C4da clones using 3 different gRNA(Gal80) constructs. n = number of larvae: 40D2 (n = 16); 40D4 (n = 16); 40E1 (n = 16). Clones were visualized by ppk>CD4-tdTom. ***p ≤ 0.001; Welch ANOVA and Welch t tests, p-values corrected using the Bonferroni method. The asterisk on 40D4 indicates frequent labeling of C3da clones. (H) Number of eggs produced by using ovoD1(2L), nos-Cas9, and 3 different gRNA(nBFP) constructs. The ctrl has no gRNA. n = number of females: ctrl (n = 13); 40D2 (n = 12); 40D4 (n = 12); 40E1 (n = 14). Asterisks are from post hoc single sample t tests that compare the EMM of each gRNA against the control (μ = 0); ***p ≤ 0.001. p-Values are from contrasts of EMMs of each gRNA (excluding control). EMMs are based on a negative binomial model. All p-values were corrected using the Tukey method. (I) Hatchability of eggs produced by females carrying ovoD1(2L), nos-Cas9, and gRNA(nBFP) constructs. n = number of females: 40D2 (n = 9); 40D4 (n = 7); 40E1(n = 9). p-Values are from contrasts of EMMs of proportions of hatched/nonhatched eggs for each gRNA based on a binomial, mixed-effects model and were corrected using the Tukey method. For E, G, and H: black bar, mean; red bar, SD. Scale bars, 50 μm. The data underlying this Figure can be found in S1 Data. BFP, blue fluorescent protein; ctrl, control; EMM, estimated marginal mean; gRNA, guide RNA; nBFP, nuclear blue fluorescent protein; nMAGIC, negative MAGIC; pMAGIC, positive MAGIC.
Fig 3
Fig 3. Inducible MAGIC and comparison with Flp/FRT-mediated mosaic analysis.
(A and B) Wing imaginal discs of animals with gRNA-40D2(BFP) and HS-Cas9 with (B) and without (A) HS at 72 h at egg laying. (C) Quantification of clone number per disc induced by HS. n = number of discs: no HS (n = 13), HS (n = 18). ***p ≤ 0.001, Welch 2-sample t test. (D) Diagram of twin spot labeling using gRNA-40D2(nBFP) and nRFP FRT40A chromosomes via MAGIC. (E and F) Wing imaginal discs showing clones generated by MAGIC using zk-Cas9 (E) and hh-Cas9 (F) visualized with nBFP (cyan) and nRFP (red). (G) Diagram of twin spot labeling using nRFP FRT40A and nGFP FRT40A chromosomes through Flp/FRT-mediated site-specific recombination. (H and I) Wing imaginal discs showing clones generated by FRT/Flp-mediated site-specific recombination using zk-Flp (H) and hh-Flp (I) and visualized with nGFP (green, indicated by green arrows) and nRFP (red, indicated by pink arrows). (J and K) Quantification of clone number per disc (J) and percentage of total clone area (K). n = number of discs: zk-Cas9 (n = 16), zk-FLP (n = 18), hh-Cas9 (n = 23), hh-FLP (n = 19). ***p ≤ 0.001, Welch 2-sample t test. Scale bars, 50 μm. The data underlying this Figure can be found in S1 Data. Flp, Flippase; FRT, flippase recognition target; gRNA, guide RNA; HS, heat shock; MAGIC, mosaic analysis by gRNA-induced crossing-over; nBFP, nuclear blue fluorescent protein; nGFP, nuclear green fluorescent protein; nRFP, nuclear red fluorescent protein.
Fig 4
Fig 4. Mosaic analysis of example genes in neuronal dendrite development.
(A–C) MAGIC clones of C4da neurons mutant for Sec5E10 (A), Rab52 (B), and Syx5AR113 (C), visualized by ppk>MApHS. Scale bars, 50 μm. (D and E) Quantification of normalized dendrite length (total dendrite length/segment width) (D) and terminal branch number (E) of C4da clones of wild-type control (w1118) and mutants. n = number neurons: w1118 (n = 14); Sec5E10 (n = 14); Rab52 (n = 15); Syx5AR113 (n = 10). The asterisk above each genotype indicates comparison with the control. ***p ≤ 0.001, ns, not significant, Welch ANOVA and Welch t tests, p-values corrected using the Bonferroni method. The data underlying this Figure can be found in S1 Data. MAGIC, mosaic analysis by gRNA-induced crossing-over.
Fig 5
Fig 5. MAGIC generates clones with DGRP lines.
(A–E) Clones in wing imaginal discs by pairing gRNA-40D2(BFP); hh-Cas9 with DGRP line 109 (A), 223 (B), 237 (C), 280 (D), and 356 (E). Scale bars, 50 μm. DGRP, Drosophila Genetic Reference Panel; MAGIC, mosaic analysis by gRNA-induced crossing-over.

Similar articles

Cited by

References

    1. Perrimon N. Creating mosaics in Drosophila. Int J Dev Biol. 1998;42 (3):243–7. 10.1387/ijdb.9654004 - DOI - PubMed
    1. Garcia-Bellido A, Ripoll P, Morata G. Developmental compartmentalization in the dorsal mesothoracic disc of Drosophila. Dev Biol. 1976;48 (1):132–47. 10.1016/0012-1606(76)90052-x - DOI - PubMed
    1. Heitzler P, Simpson P. The choice of cell fate in the epidermis of Drosophila. Cell 1991;64 (6):1083–92. 10.1016/0092-8674(91)90263-x - DOI - PubMed
    1. Perrimon N, Engstromt L, Mahowald AP. Zygotic Lethals With Specific Maternal Effect Phenotypes in Drosophila melanogaster. I. Loci on the X Chromosome. Genetics. 1989;121:333–52. - PMC - PubMed
    1. Feng Y, Irvine KD. Fat and Expanded act in parallel to regulate growth through Warts. PNAS. 2007;104 (51):20362–7. 10.1073/pnas.0706722105 - DOI - PMC - PubMed

Publication types

Substances

LinkOut - more resources