. 2021 Jan 14;17(1):e1009302.
doi: 10.1371/journal.pgen.1009302. eCollection 2021 Jan.

UV-exposure, endogenous DNA damage, and DNA replication errors shape the spectra of genome changes in human skin

Affiliations

UV-exposure, endogenous DNA damage, and DNA replication errors shape the spectra of genome changes in human skin

Natalie Saini et al. PLoS Genet. .

Abstract

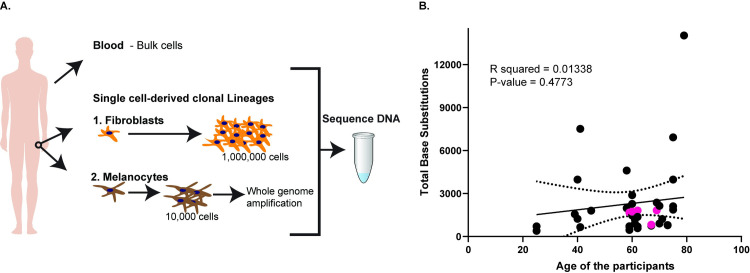
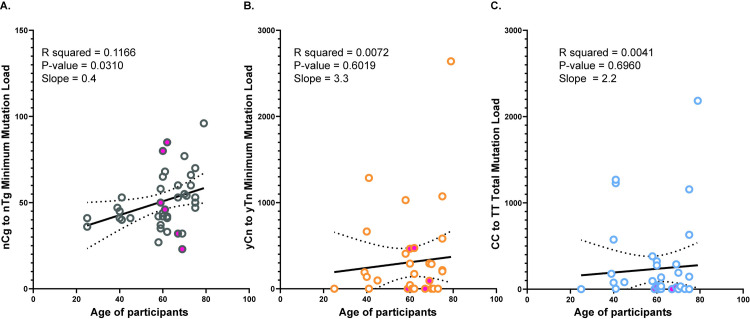
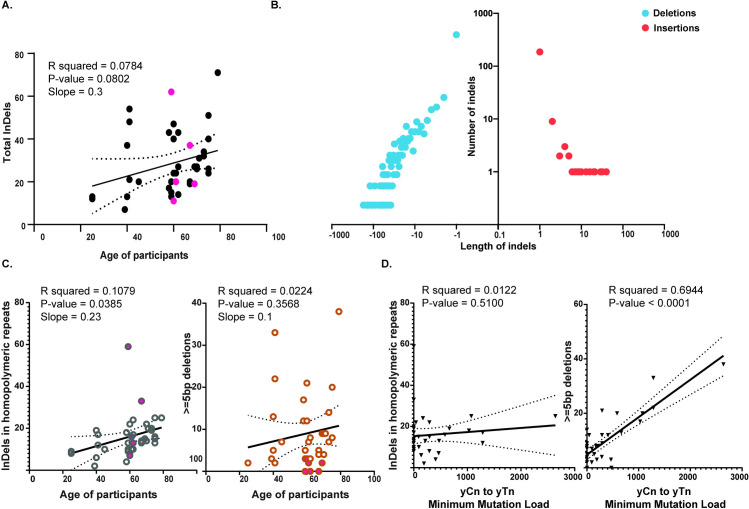
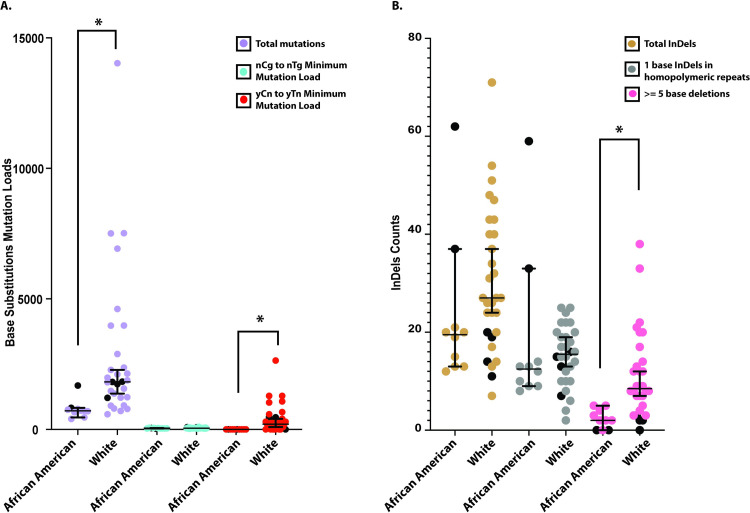
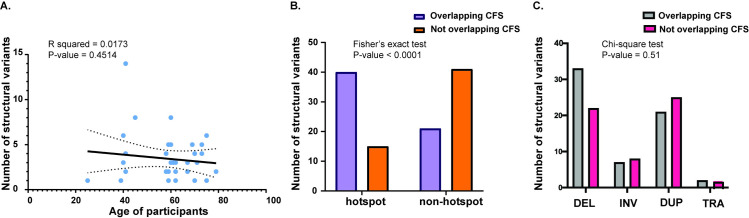
Human skin is continuously exposed to environmental DNA damage leading to the accumulation of somatic mutations over the lifetime of an individual. Mutagenesis in human skin cells can be also caused by endogenous DNA damage and by DNA replication errors. The contributions of these processes to the somatic mutation load in the skin of healthy humans has so far not been accurately assessed because the low numbers of mutations from current sequencing methodologies preclude the distinction between sequencing errors and true somatic genome changes. In this work, we sequenced genomes of single cell-derived clonal lineages obtained from primary skin cells of a large cohort of healthy individuals across a wide range of ages. We report here the range of mutation load and a comprehensive view of the various somatic genome changes that accumulate in skin cells. We demonstrate that UV-induced base substitutions, insertions and deletions are prominent even in sun-shielded skin. In addition, we detect accumulation of mutations due to spontaneous deamination of methylated cytosines as well as insertions and deletions characteristic of DNA replication errors in these cells. The endogenously induced somatic mutations and indels also demonstrate a linear increase with age, while UV-induced mutation load is age-independent. Finally, we show that DNA replication stalling at common fragile sites are potent sources of gross chromosomal rearrangements in human cells. Thus, somatic mutations in skin of healthy individuals reflect the interplay of environmental and endogenous factors in facilitating genome instability and carcinogenesis.


Conflict of interest statement

The authors have declared that no competing interests exist.

Figures

Fig 1
Fig 1. Schematics and total base substitutions identified per clonal lineage in this study.
(A) Schematics of the study design. From each donor, we obtained blood for whole-genome sequencing. In addition, we obtained skin biopsies from the hips of the donors from which fibroblasts and melanocyte clonal lineages were obtained. Fibroblasts were grown up to a million cells and their DNA was directly used for whole-genome sequencing, while melanocytes grew up to 10,000 cells and the DNA was whole-genome amplified and thereafter sequenced. (B) The total base substitutions in each clonal lineage versus the age of the donors. The pink filled circles denote melanocyte clones. The x-axis denotes the ages of the donors, while the y-axis denotes the number of base substitutions. The solid black line is the linear regression line for the samples, while the dotted black curves are the 95% confidence intervals. The source data for this figure is in S1 and S2 Tables.
Fig 2
Fig 2. Analysis of the motif-specific mutation signatures in the genomes of skin cells.
The minimum mutation load for the (A) nCg➔nTg mutation signature, (B) yCn➔yTn mutation signature and (C) the total mutation load for the CC➔TT dinucleotide changes are plotted against the ages of the participants. The solid pink circles denote the mutation load in melanocytes. The black solid line is the linear regression, and the dotted curves are the 95% confidence intervals for each dataset. The source data for this figure is S4 Table.
Fig 3
Fig 3. Analyses of indels in skin cells.
(A) The total number of indels identified in each sample plotted against the ages of the donors. The black dots denote fibroblast clones, while the pink dots denote the melanocyte clones. (B) The distribution of the lengths of the insertions and deletions detected in the clonal lineages. The source data for panels A and B is in S6 Table. (C) The number of insertions and deletions in homopolymeric repeats and the deletions spanning 5 bases or more plotted against the ages of the donors. The open circles denote fibroblast clones, while the filled in circles denote melanocyte clones. The source data for this figure are in S7 Table. (D) The number of insertions and deletions in homopolymeric repeats and the deletions spanning five bases or more plotted against the yCn➔yTn minimum mutation load in skin cells. The source data for this panel are in S4 and S6 Tables. In the graphs, the black solid line is the linear regression of the data, and the dotted black curves are the 95% confidence intervals.
Fig 4
Fig 4. Base substitutions and indels in African American and White donors.
(A) The total number of base substitutions, the nCg➔nTg minimum mutation load and the yCn➔yTn minimum mutation load in African American and White donors. Melanocytes are depicted as filled black circles. (B) The total number of indels, single nucleotide indels in homopolymeric repeats and deletions spanning five bases or more in the African American and White donors. Melanocytes are depicted as filled black circles. A two-sided Mann-Whitney U-test was performed to compare the mutation load across the two cohorts. * denotes a Bonferroni corrected P-value < 0.05. The source data for this figure is in S10 Table.
Fig 5
Fig 5. The structural variants identified in the genomes of skin cells.
(A) The number of structural variants in each donor plotted against the ages of the donors. The black inclined line denotes the linear regression of the data, while the dotted curves denote the 95% confidence intervals. (B) The number of structural variants that were or were not within hotspots and common fragile sites. A Fisher’s exact test was performed to determine if structural variants in hotspots were also preferentially present within common fragile sites. (C) The types of structural variants that overlap and do not overlap common fragile sites. A Chi-square test was performed to determine if the structural variant types within common fragile sites were different from those that did not overlap common fragile sites. The source data for this figure are in S11 Table.

References

    1. Tubbs A, Nussenzweig A. Endogenous DNA Damage as a Source of Genomic Instability in Cancer. Cell. 2017;168(4). 10.1016/j.cell.2017.01.002 WOS:000396277600015. - DOI - PMC - PubMed
    1. Lindahl T, Barnes DE. Repair of endogenous DNA damage. Cold Spring Harb Sym. 2000;65:127–33. 10.1101/sqb.2000.65.127 WOS:000169676800014. - DOI - PubMed
    1. Lodato MA, Woodworth MB, Lee S, Evrony GD, Mehta BK, Karger A, et al. Somatic mutation in single human neurons tracks developmental and transcriptional history. Science. 2015;350(6256):94–8. Epub 2015/10/03. 10.1126/science.aab1785 - DOI - PMC - PubMed
    1. Rouhani FJ, Nik-Zainal S, Wuster A, Li Y, Conte N, Koike-Yusa H, et al. Mutational History of a Human Cell Lineage from Somatic to Induced Pluripotent Stem Cells. PLoS Genet. 2016;12(4):e1005932 10.1371/journal.pgen.1005932 - DOI - PMC - PubMed
    1. Abyzov A, Tomasini L, Zhou B, Vasmatzis N, Coppola G, Amenduni M, et al. One thousand somatic SNVs per skin fibroblast cell set baseline of mosaic mutational load with patterns that suggest proliferative origin. Genome Res. 2017;27(4):512–23. Epub 2017/02/24. 10.1101/gr.215517.116 . - DOI - PMC - PubMed

Publication types

MeSH terms