. 2021 Jan 14;17(1):e1009161.
doi: 10.1371/journal.ppat.1009161. eCollection 2021 Jan.

Emergency response for evaluating SARS-CoV-2 immune status, seroprevalence and convalescent plasma in Argentina

Affiliations

Emergency response for evaluating SARS-CoV-2 immune status, seroprevalence and convalescent plasma in Argentina

Diego S Ojeda et al. PLoS Pathog. .

Abstract

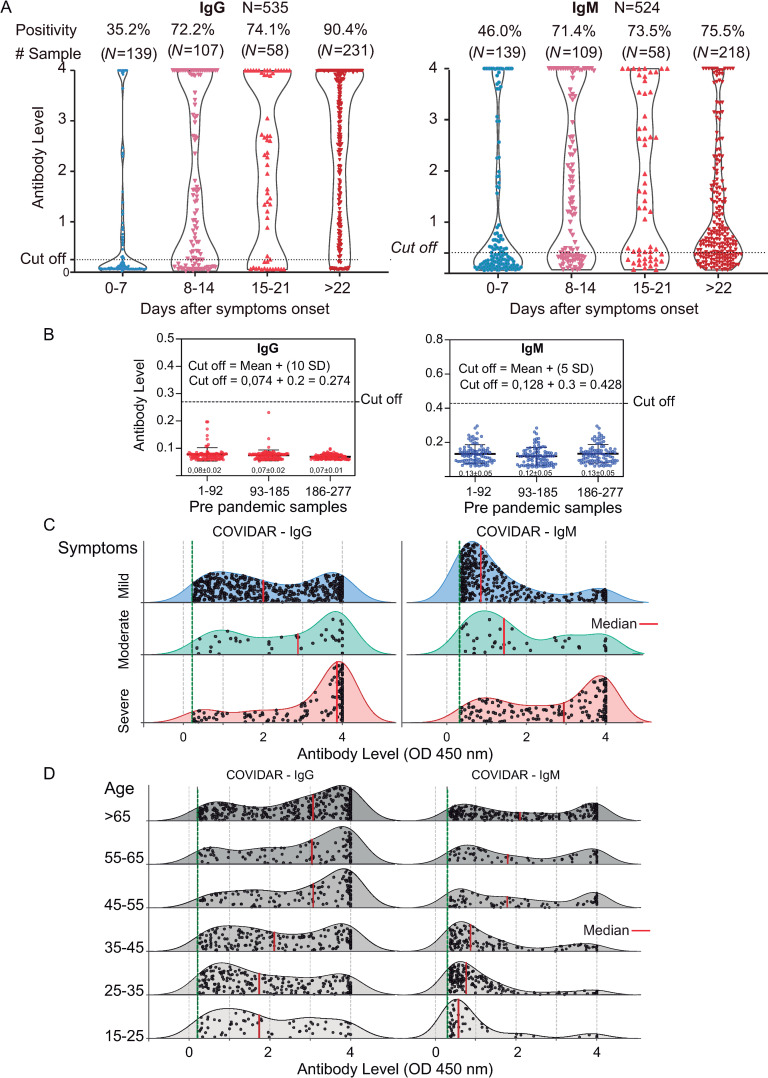
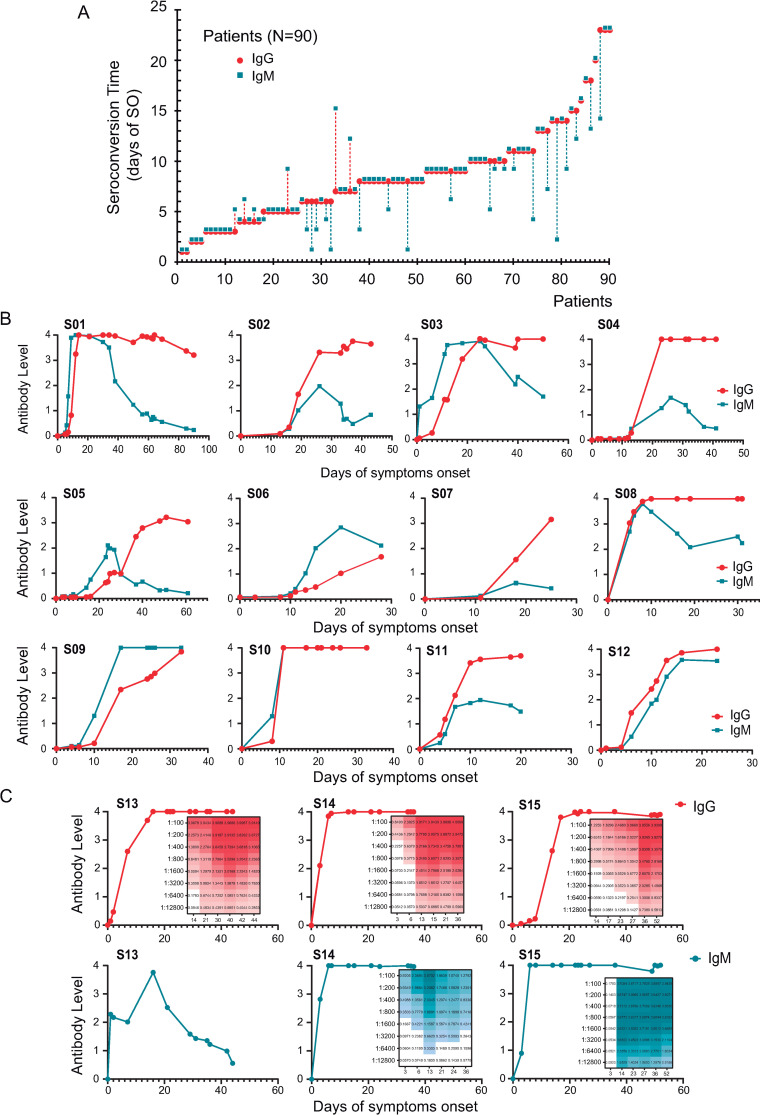
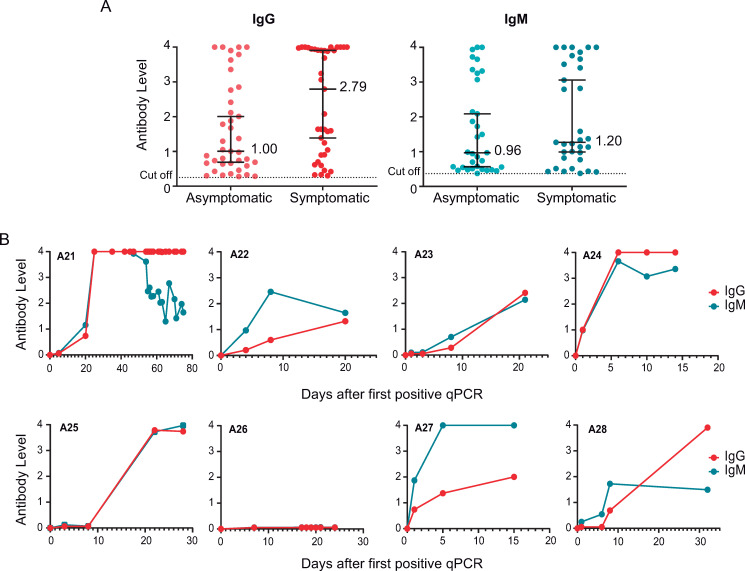
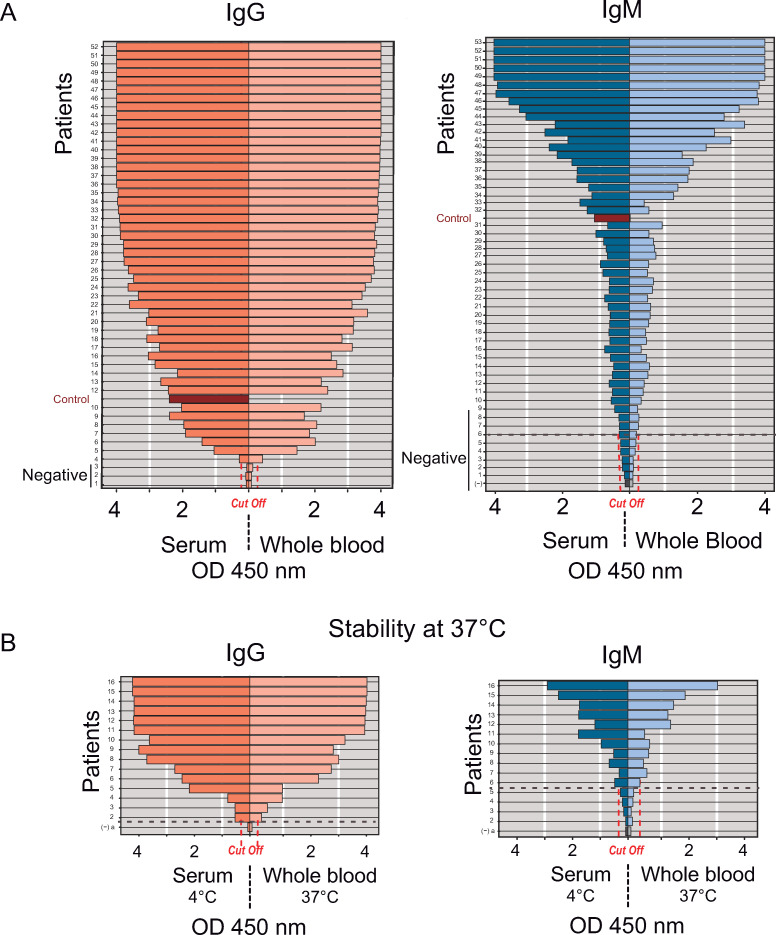
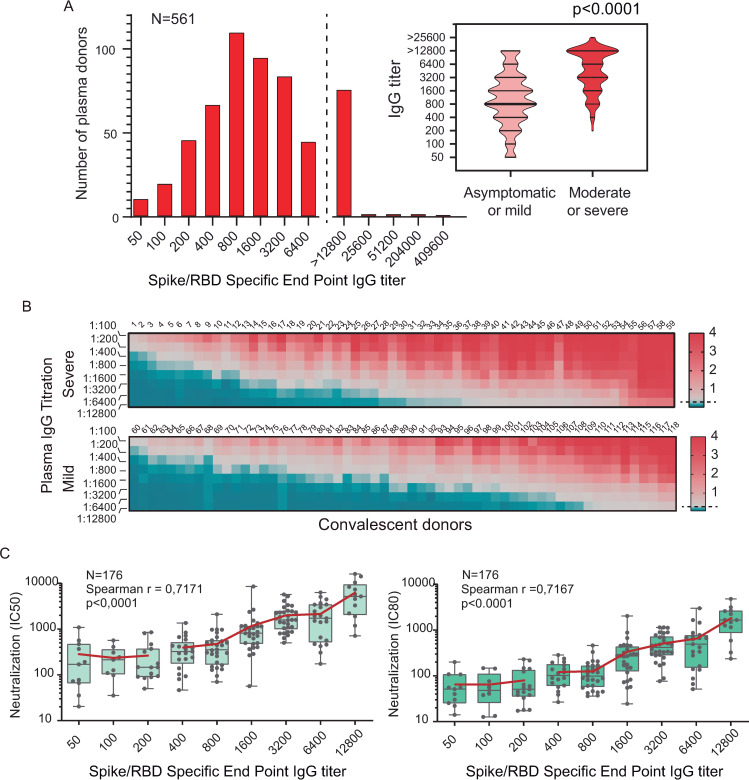
We report the emergency development and application of a robust serologic test to evaluate acute and convalescent antibody responses to SARS-CoV-2 in Argentina. The assays, COVIDAR IgG and IgM, which were produced and provided for free to health authorities, private and public health institutions and nursing homes, use a combination of a trimer stabilized spike protein and the receptor binding domain (RBD) in a single enzyme-linked immunosorbent assay (ELISA) plate. Over half million tests have already been distributed to detect and quantify antibodies for multiple purposes, including assessment of immune responses in hospitalized patients and large seroprevalence studies in neighborhoods, slums and health care workers, which resulted in a powerful tool for asymptomatic detection and policy making in the country. Analysis of antibody levels and longitudinal studies of symptomatic and asymptomatic SARS-CoV-2 infections in over one thousand patient samples provided insightful information about IgM and IgG seroconversion time and kinetics, and IgM waning profiles. At least 35% of patients showed seroconversion within 7 days, and 95% within 45 days of symptoms onset, with simultaneous or close sequential IgM and IgG detection. Longitudinal studies of asymptomatic cases showed a wide range of antibody responses with median levels below those observed in symptomatic patients. Regarding convalescent plasma applications, a protocol was standardized for the assessment of end point IgG antibody titers with COVIDAR with more than 500 plasma donors. The protocol showed a positive correlation with neutralizing antibody titers, and was used for clinical trials and therapies across the country. Using this protocol, about 80% of convalescent donor plasmas were potentially suitable for therapies. Here, we demonstrate the importance of providing a robust and specific serologic assay for generating new information about antibody kinetics in infected individuals and mitigation policies to cope with pandemic needs.


Conflict of interest statement

The authors have declared that no competing interests exist.

Figures

Fig 1
Fig 1. Antibody responses against SARS-CoV-2.
A. Levels of specific IgG and IgM antibodies against SARS-CoV-2 (measured as OD at 450 nm) versus days of symptoms onset in 535 patient serum samples are shown. The positivity rate and sample size for each week are indicated on the top. The cut-off is also shown. B. Levels of IgG and IgM antibodies against SARS-CoV-2 in 277 pre-pandemic serum samples. The cut-off definition is shown. C. Comparison of the levels of IgG and IgM antibodies against SARS-CoV-2 from patients with severe, moderate and mild symptoms. For each plot, the red lines indicate median values. D. Comparison of the level of IgG and IgM antibodies against SARS-CoV-2 from patients of different ages. The number of samples analyzed for C and D was 1379 and 976, respectively.
Fig 2
Fig 2. Longitudinal antibody measurements of SARS-CoV-2 infected patients.
A. Antibody responses of 90 patients, initially seronegative, were followed as a function of time until seroconversion. The plot indicates the time at which antibodies appear for the first time for each patient. IgM and IgG seroconversion time is shown in different colors (blue and red, respectively). Three types of seroconversions were observed: synchronous (IgG and IgM together), or consecutive (either IgM or IgG first). The time separation between the two seroconversions are indicated by a dash line. B. Representative longitudinal IgG and IgM antibody measurements of symptomatic SARS-CoV-2 infected patients show large humoral response heterogeneity. Each plot represents a single patient followed as a function of time of symptoms onset. C. Representative examples of longitudinal antibody measurements with different IgM profiles of patients with severe symptoms. Insets indicate heats maps of antibody titrations (from 1/100 to 1/12800).
Fig 3
Fig 3. Antibody responses of asymptomatic SARS-CoV-2 infected patients.
A. Comparison of virus-specific IgG and IgM antibody levels in asymptomatic (n = 40) and symptomatic patients (n = 40), during acute SARS-CoV-2 infection, are shown. The median is indicated in each case. B. Representative examples of longitudinal antibody measurements of asymptomatic SARS-CoV-2 infected patients. IgM and IgG levels are represented as a function of time of the first qPCR positive test for each patient.
Fig 4
Fig 4. Validation of finger prick sampling for COVIDAR ELISA test.
A. Antibody measurements of paired serum and whole blood samples from the same patient were performed using COVIDAR IgG and IgM. For each case the positive control (red) and cut off are indicated. B. Stability of whole blood sample at 37°C in Serokit for field SARS-CoV-2 serosurvey studies. Antibody measurements of paired whole blood and serum samples from 19 patients that were kept for one week at 37°C in Serokit or 4°C, respectively.
Fig 5
Fig 5. Quantification of IgG levels in COVID-19 convalescent patients and correlation with neutralizing activity.
A. IgG titers were defined by end dilution with COVIDAR ELISA test in convalescent-phase COVID-19 patients who were discharged from the hospital (n = 561). On the right, plot of titer distribution showing significant differences (p <0.0001, Mann-Whitney test) between samples from donors that have experience mild or severe symptoms. B. Full IgG titrations curves of plasma sample from donors that recovered from severe or mild COVID19 were used to generate heat maps. Red represents high and blue low antibody levels as indicated on the right. Samples were sorted by increasing titers. C. Correlation of IgG end point titration and neutralizing antibody titers in COVID-19 patients measured by pseudovirus CoV2pp (n = 176). The reciprocal of inhibition concentration 50% and 80%, IC50 and IC80 respectively, are correlated to the reciprocal end point IgG titers. In the inset the r Spearman and p values from linear regression are shown. Boxes indicate the median, and the red line the mean of IC50 or IC80 for each IgG titer.

References

    1. Long QX, Liu BZ, Deng HJ, Wu GC, Deng K, Chen YK, et al. Antibody responses to SARS-CoV-2 in patients with COVID-19. Nat Med. 2020;26: 845–848. 10.1038/s41591-020-0897-1 - DOI - PubMed
    1. Xu X, Sun J, Nie S, Li H, Kong Y, Liang M, et al. Seroprevalence of immunoglobulin M and G antibodies against SARS-CoV-2 in China. Nat Med. 2020;26: 1193–1195. 10.1038/s41591-020-0949-6 - DOI - PubMed
    1. Pollán M, Pérez-Gómez B, Pastor-Barriuso R, Oteo J, Hernán MA, Pérez-Olmeda M, et al. Prevalence of SARS-CoV-2 in Spain (ENE-COVID): a nationwide, population-based seroepidemiological study. Lancet. 2020;396: 535–544. 10.1016/S0140-6736(20)31483-5 - DOI - PMC - PubMed
    1. Iyer AS, Jones FK, Nodoushani A, Kelly M, Becker M, Slater D, et al. Persistence and decay of human antibody responses to the receptor binding domain of SARS-CoV-2 spike protein in COVID-19 patients. Sci Immunol. 2020;5: eabe0367 10.1126/sciimmunol.abe0367 - DOI - PMC - PubMed
    1. Wajnberg A, Mansour M, Leven E, Bouvier NM, Patel G, Firpo A, et al. Humoral immune response and prolonged PCR positivity in a cohort of 1343 SARS-CoV 2 patients in the New York City region 2. medRxiv. 2020; 2020.04.30.20085613. 10.1101/2020.04.30.20085613 - DOI

Publication types

MeSH terms