. 2021 Feb 22;49(3):1364-1382.
doi: 10.1093/nar/gkaa1283.

The complex architecture of p53 binding sites

Affiliations

The complex architecture of p53 binding sites

Alon Senitzki et al. Nucleic Acids Res. .

Abstract

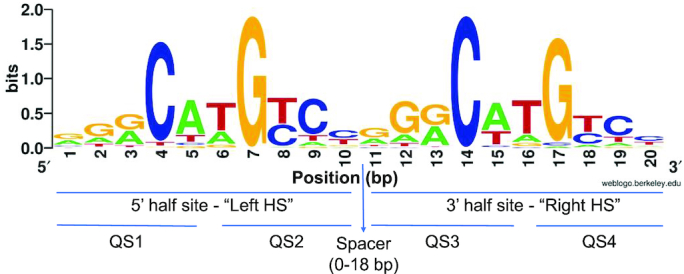
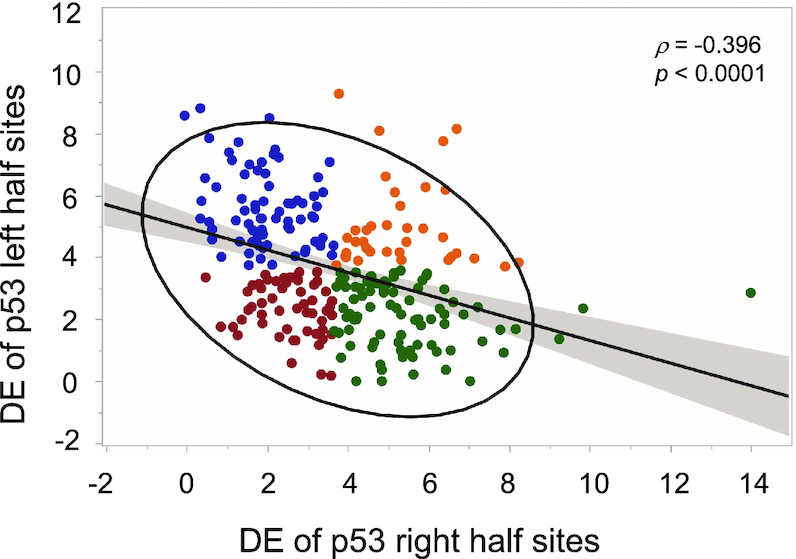
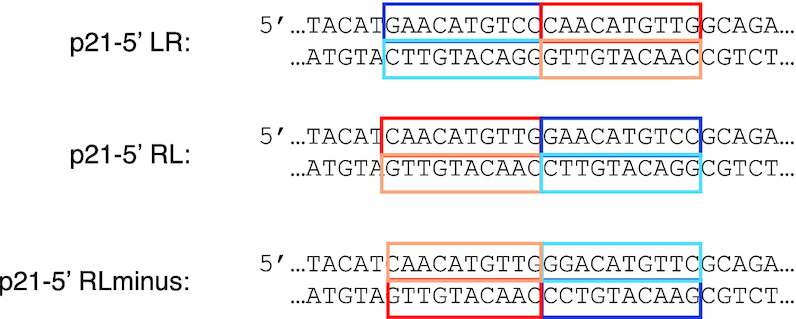
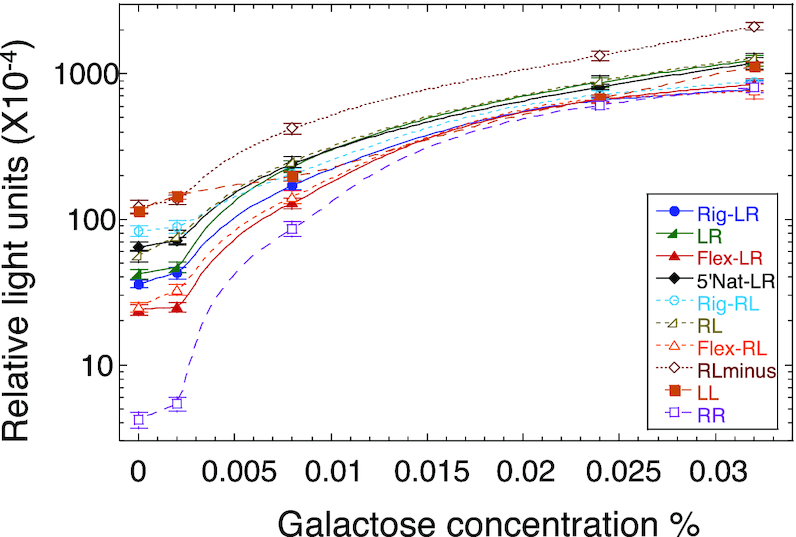
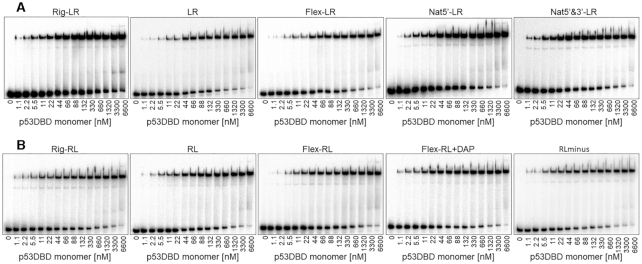
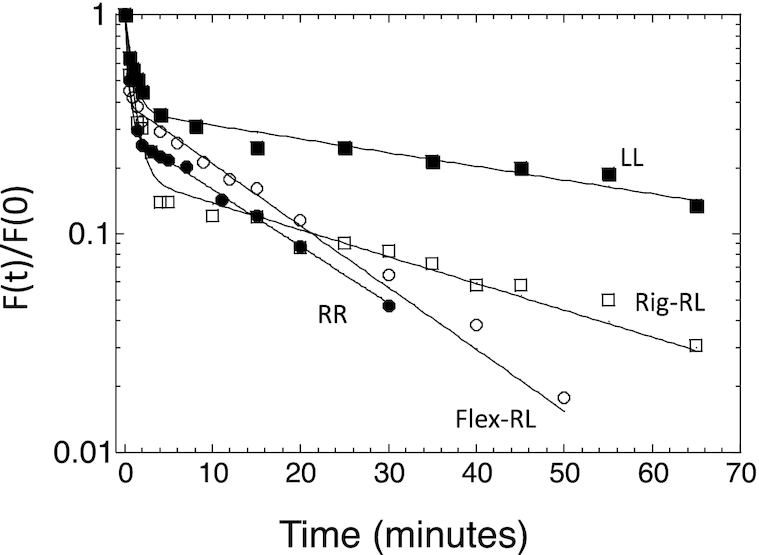
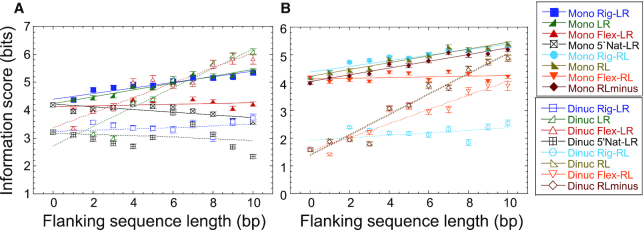
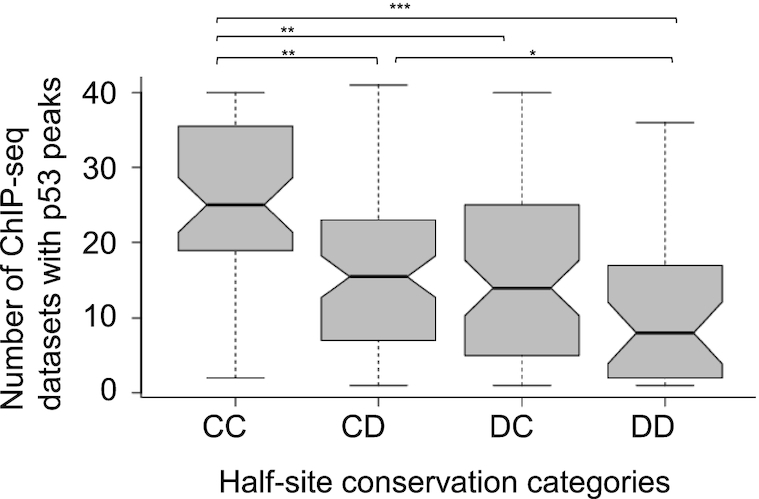
Sequence-specific protein-DNA interactions are at the heart of the response of the tumor-suppressor p53 to numerous physiological and stress-related signals. Large variability has been previously reported in p53 binding to and transactivating from p53 response elements (REs) due, at least in part, to changes in direct (base) and indirect (shape) readouts of p53 REs. Here, we dissect p53 REs to decipher the mechanism by which p53 optimizes this highly regulated variable level of interaction with its DNA binding sites. We show that hemi-specific binding is more prevalent in p53 REs than previously envisioned. We reveal that sequences flanking the REs modulate p53 binding and activity and show that these effects extend to 4-5 bp from the REs. Moreover, we show here that the arrangement of p53 half-sites within its REs, relative to transcription direction, has been fine-tuned by selection pressure to optimize and regulate the response levels from p53 REs. This directionality in the REs arrangement is at least partly encoded in the structural properties of the REs. Furthermore, we show here that in the p21-5' RE the orientation of the half-sites is such that the effect of the flanking sequences is minimized and we discuss its advantages.


Figures

Figure 1.
Figure 1.
Sequence logo of our curated set of 250 activating p53 REs without spacers, aligned by transcription direction. Sequence logo was generated by weblogo (96). HS, half-site. QS1, QS2, QS3 and QS4 are the first, second, third and fourth quarter sites from the 5′ to the 3′ end of the sites.
Figure 2.
Figure 2.
Discrimination energy analysis to p53 half-sites. The discrimination energy (DE) of the left (5′) half sites of p53 REs anticorrelate with the discrimination energy of right (3′) half sites. Analysis was conducted on our curated set of 250 activating p53 REs without spacers. Blue, DC category; green, CD category; red, CC category; orange, DD category. See text for details.
Figure 3.
Figure 3.
Switching p53 half-sites of p21-5′. Horizontal (LR to RL) and vertical (LR to RLminus) switching of p21-5′ half sites. Half sites are boxed and color coded. The flanking sequences are those of the original plasmid construct. See text for details.
Figure 4.
Figure 4.
Transactivation level from variants of the p21-5′ RE as a function of p53 protein levels. Raffinose (marked as 0% galactose) and increasing concentrations of galactose were used to achieve variable cellular concentration of p53. Transactivation is represented as relative light units (RLU). Each value is an average of 4–6 independent experiments. Each independent experiment contained 5–7 replicas of each RE. Error bars are SEM values. Cells were grown overnight in a glucose containing medium, were washed and resuspended in a fresh medium containing raffinose (2%) or increasing concentration of galactose (at time zero). Transactivation was measured after 6 h.
Figure 5.
Figure 5.
Binding affinity measurements by EMSA of p53DBD to variants of the p21-5′ RE. The number bellow each gel is the concentration of p53DBD monomers active for DNA binding. DNA targets were embedded in DNA hairpin constructs (concentration < 0.1 nM). The gels are representative examples of six to eight experiments conducted with each site.
Figure 6.
Figure 6.
Kinetic off-rate analysis of p21-5′ RE variants from p53DBD. Shown is a plot of the fraction of molecules bound to p53DBD at time (t) divided by the fraction of molecules bound at time 0 as a function of time. The lines are from the best fit to a double-exponential curve. Solid squares, LL; solid circles, RR; open squares, Rig-RL; open circles, Flex-RL. The shown experimental points are those from one experiment, out of 3–5 independent experiments conducted with each DNA target. Hence, they may deviate slightly from the averaged values presented in Supplementary Table S5.
Figure 7.
Figure 7.
Information score analysis to p21-5′ RE variants as a function of flanking sequences length. Mononucleotide and dinucleotide information score for (A) LR group, and (B) RL group and RLminus.
Figure 8.
Figure 8.
The number of ChIP-seq datasets (out of 41 datasets used in the meta-analysis of Nguyen et al. (43)) with p53 peaks versus half-site conservation categories. The occupancy of p53 on fully-conserved REs (CC category) is significantly higher than on partially conserved or fully degenerate p53 sites. P values are marked as follows: P = 0.037 *, Pformula image 0.001 **, P < 0.0001 ***.

References

    1. Rohs R., Jin X., West S.M., Joshi R., Honig B., Mann R.S.. Origins of specificity in protein-DNA recognition. Annu. Rev. Biochem. 2010; 79:233–269. - PMC - PubMed
    1. Kitayner M., Rozenberg H., Kessler N., Rabinovich D., Shaulov L., Haran T.E., Shakked Z.. Structural basis of DNA recognition by p53 tetramers. Mol. Cell. 2006; 22:741–753. - PubMed
    1. Beno I., Rosenthal K., Levitine M., Shaulov L., Haran T.E.. Sequence-dependent cooperative binding of p53 to DNA targets and its relationship to the structural properties of the DNA targets. Nucleic Acids Res. 2011; 39:1919–1932. - PMC - PubMed
    1. Jordan J.J., Menendez D., Sharav J., Beno I., Rosenthal K., Resnick M.A., Haran T.E.. Low-level p53 expression changes transactivation rules and reveals superactivating sequences. Proc. Natl. Acad. Sci. USA. 2012; 109:14387–14392. - PMC - PubMed
    1. Kitayner M., Rozenberg H., Rohs R., Suad O., Rabinovich D., Honig B., Shakked Z.. Diversity in DNA recognition by p53 revealed by crystal structures with Hoogsteen base pairs. Nat. Struct. Mol. Biol. 2010; 17:423–429. - PMC - PubMed

Publication types