. 2021 Feb 22;49(3):1688-1707.
doi: 10.1093/nar/gkaa1274.

Ecd promotes U5 snRNP maturation and Prp8 stability

Affiliations

Ecd promotes U5 snRNP maturation and Prp8 stability

Steffen Erkelenz et al. Nucleic Acids Res. .

Abstract

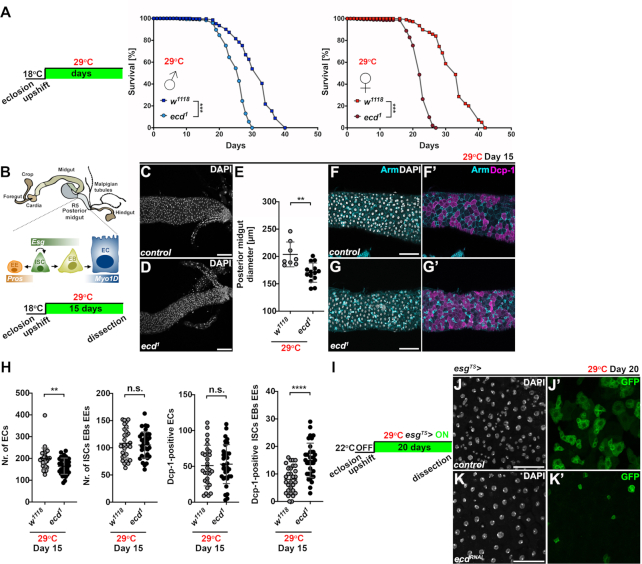
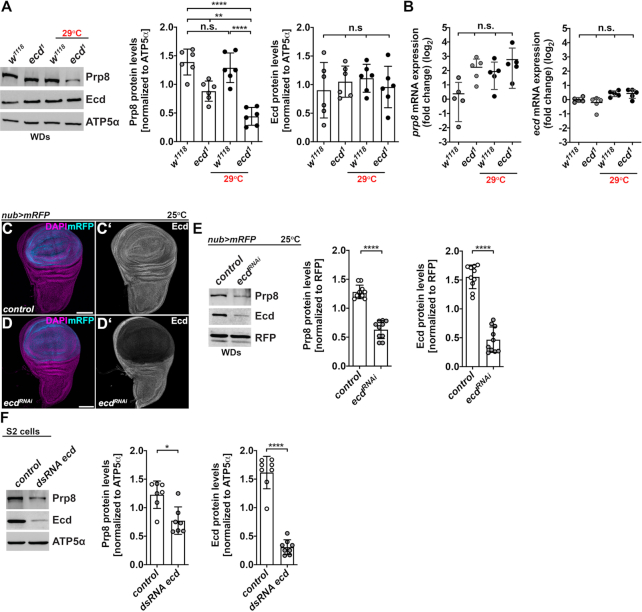
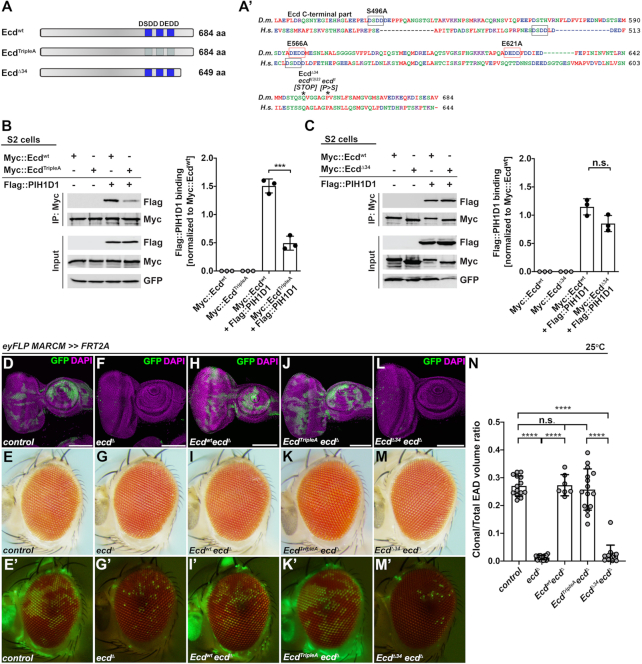
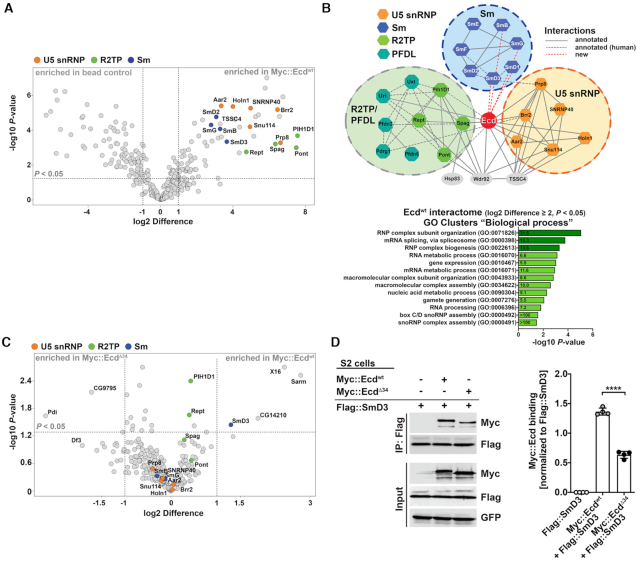
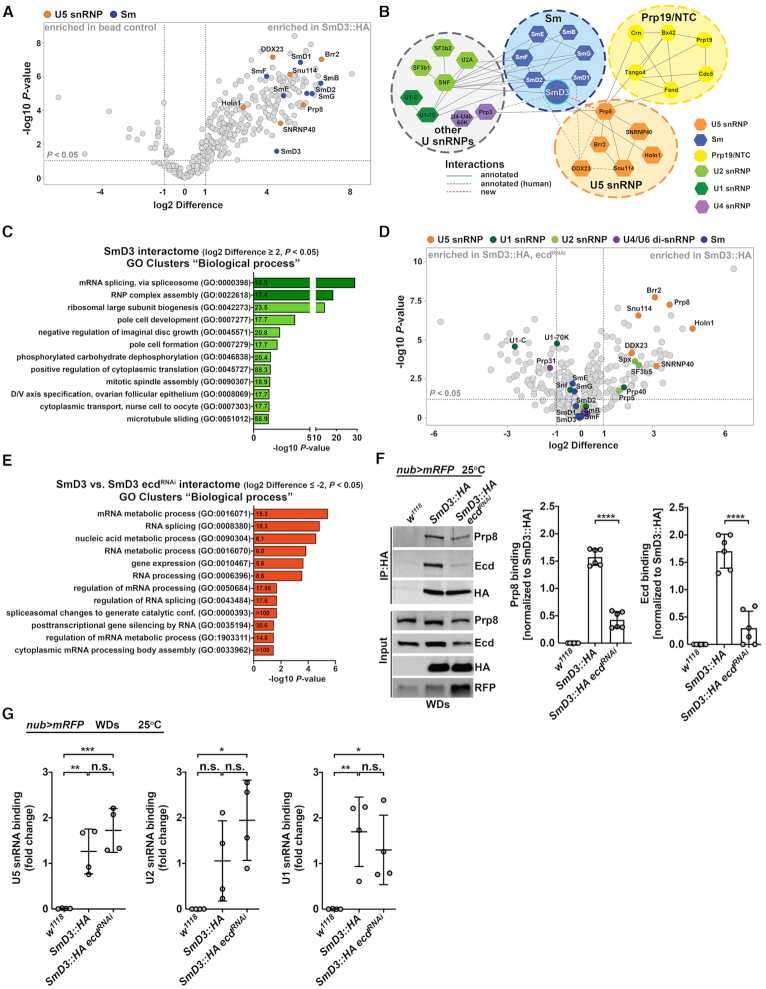
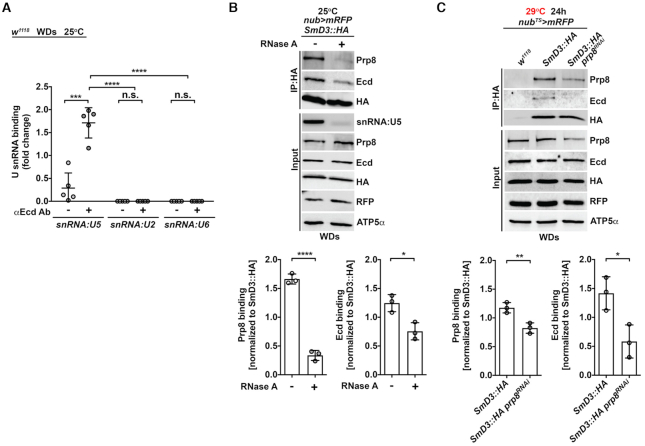
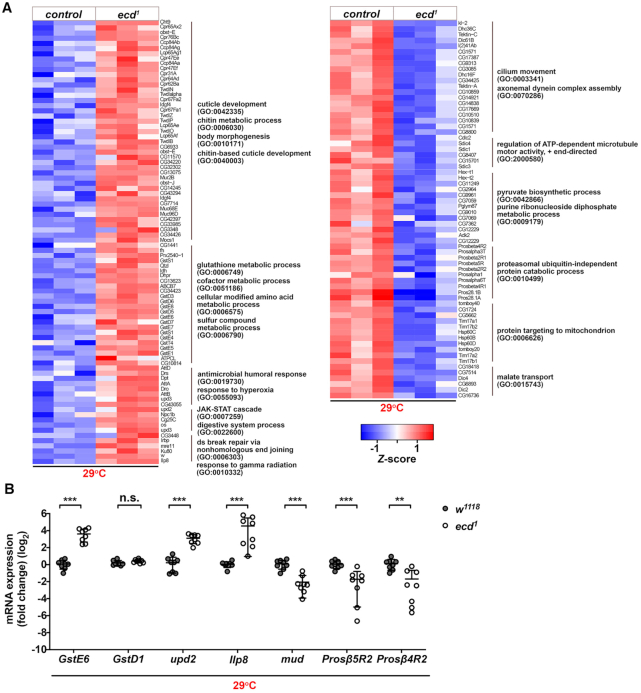
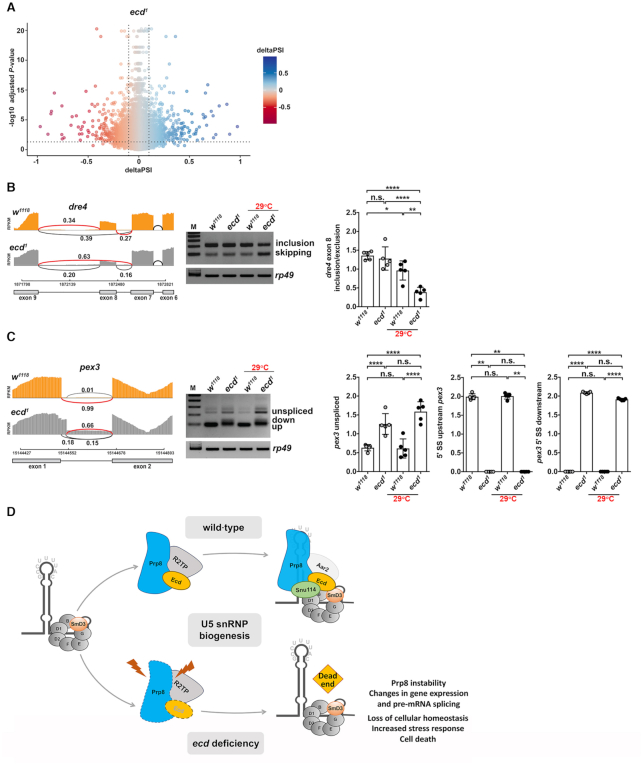
Pre-mRNA splicing catalyzed by the spliceosome represents a critical step in the regulation of gene expression contributing to transcriptome and proteome diversity. The spliceosome consists of five small nuclear ribonucleoprotein particles (snRNPs), the biogenesis of which remains only partially understood. Here we define the evolutionarily conserved protein Ecdysoneless (Ecd) as a critical regulator of U5 snRNP assembly and Prp8 stability. Combining Drosophila genetics with proteomic approaches, we demonstrate the Ecd requirement for the maintenance of adult healthspan and lifespan and identify the Sm ring protein SmD3 as a novel interaction partner of Ecd. We show that the predominant task of Ecd is to deliver Prp8 to the emerging U5 snRNPs in the cytoplasm. Ecd deficiency, on the other hand, leads to reduced Prp8 protein levels and compromised U5 snRNP biogenesis, causing loss of splicing fidelity and transcriptome integrity. Based on our findings, we propose that Ecd chaperones Prp8 to the forming U5 snRNP allowing completion of the cytoplasmic part of the U5 snRNP biogenesis pathway necessary to meet the cellular demand for functional spliceosomes.


Figures

Figure 1.
Figure 1.
Loss of ecd shortens lifespan and compromises maintenance of the adult intestine. (A) Control w1118 and temperature-sensitive ecd1 fly lines were allowed to develop at 18°C. After eclosion and two-day mating, males and females were separated and upshifted to restrictive temperature of 29°C. Lifespan curves show percentage of survival of w1118 and homozygous ecd1 adult males and females over time (n = 300) at 29°C and represent one of the two independent experiments. Adult ecd1 male and female flies were shorter lived (mean difference of 6.1 days for males and 10.2 days for females) compared to control flies. Statistical significance was determined by a log-rank test, ***P < 0.001. (B) Schematic diagram of Drosophila adult intestine. Posterior midgut is maintained by the intestinal stem cells (ISCs), which divide asymmetrically to self-renew and generate either the postmitotic enteroblasts (EBs) or the enteroendocrine (EE) lineage precursors. The midgut ISCs and EBs express the transcription factor Escargot (Esg) while EEs are positive for Prospero (Pros). EBs further differentiate into large absorptive enterocytes (ECs) characterized by polyploid nuclei and expression of Myosin 1A (Myo1A). Schematics of experimental setup and timeline to assess impact of ecd deficiency on adult midgut. (CD) Representative confocal micrographs show that posterior midguts of ecd1 homozygous mutant flies (D) kept at restrictive temperature for 15 days are thinner compared to controls (w1118) (C). Scale bars: 50 μm. (E) Diameter measurements of posterior midguts from control (w1118, n = 8) and ecd1 flies (n = 12) kept at 29°C for 15 days. Nuclei were stained with DAPI. Statistical significance was determined by unpaired two-tailed Student's t-test. Data represent means ± SD, **P < 0.01. (F, G) Representative confocal micrographs of posterior midguts from adult female flies kept at restrictive temperature for fifteen days show increased number of apoptotic Dcp-1-positive cells (magenta) in ecd1 (G, G’) compared to control (w1118) intestines (F, F’). Cell membranes were visualized by Armadillo (Arm) antibody (cyan). Note the stronger Arm signal highlighting smaller progenitors compared to weaker staining of large polyploid ECs (F’, G’). DAPI stains nuclei. Scale bars: 50 μm. (H) Cell counts and quantification of Dcp-1-positive cells revealed reduced number of ECs and elevated apoptosis in progenitor and EE population in posterior midguts of ecd1 adult female flies (n = 34) kept at 29°C for 15 days compared to control (w1118, n = 30). Unpaired nonparametric two-tailed Mann–Whitney test was used to calculate P-values. Data represent means ± SD, **P < 0.01, ****P < 0.0001, n.s. = non-significant. (I) Experimental setup and timeline for RNAi-mediated silencing of ecd in progenitors (ISCs and EBs) of adult midguts using esgTS> expression system. (JK) Representative confocal images of twenty-day-old control posterior midguts (J) and those expressing ecdRNAi (K) in ISCs/EBs (esgTS>) marked by GFP show decrease in Esg-positive progenitor cells following ecd knockdown (compare J’ and K’). DAPI stains nuclei. Scale bars: 50 μm. See also Supplementary Figure S1.
Figure 2.
Figure 2.
Ecd deficiency leads to Prp8 instability. (A) Representative western blot and quantifications show that Prp8 but not Ecd protein levels are reduced in wing imaginal discs (WDs) dissected from homozygous mutant ecd1 larvae upshifted to 29°C for 24 h relative to controls. Note a noticeable decrease in Prp8 protein already observed at permissive temperature (18°C). ATP5α was used as a loading control. Data represent means ± SD, n = 6. Statistical significance was determined by two-way ANOVA with Tukey's multiple comparisons test, **P < 0.01, ****P < 0.0001, n.s. = non-significant. (B) Prp8 and ecd mRNA levels did not differ significantly between WDs dissected from control and ecd1 homozygous mutant larvae grown at permissive or restrictive temperature. Levels of rp49 transcript were used for normalization. RT-qPCR data are means ± SD, n = 5. Statistical significance was determined by two-way ANOVA with Tukey's multiple comparisons test, n.s. = non-significant. (C, D) Immunostaining with an Ecd-specific antibody revealed marked reduction of Ecd protein in the pouch region of WDs following overexpression of an UAS-ecdRNAi transgene (D, D’) using the nubbin-Gal4, UAS-myr-mRFP driver (nub>mRFP) relative to hinge region and control WD (C, C’). Micrographs show projections of multiple confocal sections of WDs dissected from third instar larvae 7 days AEL. Nuclei were counterstained with DAPI. Scale bars: 100 μm. (E) Representative western blot and quantifications show a strong reduction of Prp8 and Ecd protein levels following RNAi-mediated knockdown of Ecd in the wing pouch using nub>mRFP driver. Red fluorescent protein (RFP) was used as a loading control. Data represent means ± SD, n = 10. Statistical significance was determined by paired two-tailed Student's t-test, ****P < 0.0001. (F) Prp8 protein levels decreased in S2 cells treated with ecd dsRNA compared to those transfected with control lacZ dsRNA for 72 h prior to lysis. ATP5α was used as a loading control. Data represent means ± SD, n = 7–8. Statistical significance was determined by paired two-tailed Student's t-test, *P < 0.05, ****P < 0.0001. See also Supplementary Figure S2.
Figure 3.
Figure 3.
EcdΔ34 mutant protein binds R2TP complex via PIH1D1 but is non-functional in vivo. (A) Schematic representation of wild-type and mutant Ecd proteins and ecd alleles used in this study. The blue boxes indicate the position of wild-type (dark blue) or mutated (light blue) DSDD/DEDD motifs. Alignment of the C-terminal part of the Drosophila melanogaster (D.m., Q9W032) Ecd and human (H.s., O95905) ECD proteins was generated using Clustal W (A’). Asterisks indicate the positions of the premature stop codon in ecdl(3)23 allele and the conserved proline 656, which substitution to serine generates conditional ecd1 allele. Black and red rectangles outline the DSDD and DEDD motifs, respectively (A’). (BC) Representative western blots and quantifications show that Myc::EcdTripleA (B) but not Myc::EcdΔ34 (C) co-precipitates significantly less Flag::PIH1D1 protein from Drosophila S2 cell lysates relative to Myc::Ecdwt (B, C). Myc-tagged proteins served as baits. GFP was used as a transfection and loading control. Data represent means ± SD, n = 3. Unpaired two-tailed Student's t-test was used to determine the significance, ***P < 0.001, n.s. = non-significant. (D–M) Representative confocal micrographs of mosaic third instar EADs and brightfield and fluorescent images of adult eyes, where homozygous GFP-labelled clones of the indicated genotypes were generated using the eyFLP MARCM technique. In contrast to abundant, sizable control clones (D, E), ecdΔ homozygous mutant clones are very rare, presented as individual GFP-positive cells within the differentiated part of the eye primordium (F) and adult retina (G). Overexpression of Ecdwt (H, I) and EcdTripleA (J, K) but not EcdΔ34 mutant protein (L, M) is sufficient to restore clonal number and size to control levels (D, E). Confocal micrographs are projections of multiple sections, showing EADs 7 days AEL. Nuclei were counterstained with DAPI. Scale bars: 100 μm (D, F, H, J, L). (N) Quantification of clonal to total EAD volume ratios from confocal micrographs of mosaic EADs of the indicated genotypes. Data represent means ± SD, n = 7–16. Ordinary one-way ANOVA with Tukey's multiple comparisons test was used to determine significance, ****P < 0.0001, n.s. = non-significant. See also Supplementary Figure S3.
Figure 4.
Figure 4.
The heptameric Sm ring protein SmD3 interacts with Ecd. (A) The volcano plot depicts Ecd-specific interactome identified by LC-MS/MS analysis based on pull-down of Myc::Ecdwt protein from Drosophila S2 cell lysate with an anti-Myc-specific antibody. 61 proteins enriched in Myc::Ecdwt IP samples relative to control (S2 cells not expressing Myc::Ecdwt) (|log2 difference| ≥ 1 and FDR < 0.05) are located within the outlined area. Specific interaction partners including Sm proteins (blue), U5 snRNP proteins (orange), and R2TP components (green) are highlighted. (B) Visualization of a simplified Ecd interaction network comprising Sm (blue), U5 snRNP (orange) and R2TP complex (green) proteins using Cytoscape. Annotated interactions are shown with full or dashed gray lines, new interactions with red dashed lines. The bar graph depicts functional GO clusters enriched (fold enrichment ≥ 5, FDR < 0.05, noted within the bars) among the Myc::Ecdwt interacting proteins (|log2 Difference| ≥ 2 and FDR < 0.05). GO terms linked to RNP assembly and RNA splicing are highlighted in dark green. (C) The volcano plot depicts results of comparative LC–MS/MS analysis showing differences in proteins pulled down with Myc::Ecdwt and Myc::EcdΔ34 from Drosophila S2 cell lysates. Sm proteins (blue), U5 snRNP proteins (orange), and R2TP components (green) are highlighted. Note that the binding of SmD3 to EcdΔ34 protein is markedly reduced. (D) Representative western blot and quantifications of independent IP assays in Drosophila S2 cells confirm decreased binding of Flag::SmD3 to Myc::EcdΔ34 compared to Myc::Ecdwt protein. Proteins were pulled down by anti-Flag magnetic beads. Data represent means ± SD, n = 4. Unpaired two-tailed Student's t-test was used to determine significance, ****P < 0.0001. See also Supplementary Figure S4 and Supplementary Dataset S1.
Figure 5.
Figure 5.
Ecd deficiency hinders U5 snRNP biogenesis. (A) The volcano plot depicts SmD3-specific interactome identified by LC–MS/MS analysis based on a pull-down of SmD3::HA protein from nub>mRFP, SmD3::HA wing imaginal disc cell lysate. 252 proteins enriched in SmD3::HA IP samples relative to control (nub>mRFP) (|log2 Difference| ≥ 1 and FDR < 0.05) are located within the outlined area. Specific interaction partners including Sm proteins (blue), U5 snRNP proteins (orange) are highlighted. (B) Visualization of a simplified SmD3 protein interactome using Cytoscape highlights its central position within the Sm ring and the spliceosome. Annotated interactions are shown with full or dashed gray lines, new interactions with green dashed lines. (C) The bar graph shows functional GO clusters enriched (fold enrichment ≥ 15, FDR < 0.05, depicted within the bars) among the SmD3::HA interacting proteins (|log2 difference| ≥ 2 and FDR < 0.05). GO terms linked to RNP assembly and RNA splicing are highlighted in dark green. (D) The volcano plot visualizes results of a comparative LC–MS/MS analysis showing differences in protein binding to SmD3::HA precipitated from control (nub>mRFP, SmD3::HA) wing discs lysates and those where ecd was knocked down (nub>mRFP, SmD3::HA, ecdRNAi). RNAi-mediated silencing of ecd transcript reduces interaction of SmD3 with numerous core components of the U5 snRNP (orange) but not with other Sm proteins comprising the Sm ring (blue). The interactions of SmD3 with U1 (dark green), U2 (light green) and U4/U6 snRNP-specific proteins were less affected compared to the components of U5 snRNP. (E) The bar graph shows functional GO clusters enriched (fold enrichment ≥ 5, FDR adjusted < 0.05, depicted within the bars) among the SmD3::HA interacting proteins that are significantly affected (|log2 difference| ≥ 2 and FDR < 0.05) by ecd RNAi knockdown. (F) Representative western blot and quantifications of independent IP experiments corroborate reduced binding of endogenous Prp8 to SmD3::HA in lysates prepared from ecd depleted (nub>mRFP, SmD3::HA, ecdRNAi) wing imaginal discs compared to control nub>mRFP, SmD3::HA samples. Proteins were pulled down with help of the anti-HA antibody-coupled to magnetic beads. Imaginal discs expressing RFP only (nub>mRFP) served to control for unspecific binding. Data represent means ± SD, n = 6. Unpaired two-tailed Student's t-test was used to determine significance, ****P < 0.0001. (G) RIP assays from wing imaginal disc samples using the anti-HA antibody-coated magnetic beads reveal that transgenic SmD3::HA protein precipitates endogenous U5, U2 and U1 snRNAs in the presence (nub>mRFP, SmD3::HA) as well as absence of ecd (nub>mRFP, SmD3::HA, ecdRNAi). Imaginal discs expressing RFP only (nub>mRFP) served to control for unspecific binding. U snRNA levels were determined by RT-qPCR. Data were normalized to the respective input U snRNA levels. Data represent means ± SD, n = 4. Ordinary one-way ANOVA with Tukey's multiple comparisons test was used to determine significance, *P < 0.05, **P < 0.01, ***P < 0.001, n.s. = non-significant. See also Supplementary Figure S5 and Supplementary Dataset S2.
Figure 6.
Figure 6.
Ecd binding to SmD3 in the U5 snRNP requires Prp8 and the U5 snRNA. (A) RIP assays from control (w1118) wing imaginal discs (WDs) with a Ecd-specific antibody show selective binding of endogenous Ecd to U5 but not U2 and U6 snRNAs. The amount of precipitated U snRNAs was quantified by RT-qPCR and normalized to the respective input U snRNA levels. Data represent means ± SD, n = 5. Statistical significance was determined using two-way ANOVA with Tukey's multiple comparisons test, ***P < 0.001, ****P < 0.0001, n.s. = non-significant. (B) Representative western blot and quantification of independent IP experiments show reduced binding of endogenous Prp8 and Ecd to transgenic SmD3::HA in RNAse A treated (+) lysates prepared from nub>mRFP, SmD3::HA wing imaginal discs compared to untreated (–) samples. Proteins were precipitated with the anti-HA antibody-coated magnetic beads. Semi-quantitative PCR of snRNA:U5 shows RNase A treatment efficacy. Data represent means ± SD, n = 3. Unpaired two-tailed Student's t-test was used to determine significance, *P < 0.05, ****P < 0.0001. (C) Representative western blot and quantification of independent IP experiments using the HA antibody-coated magnetic beads show reduced binding of endogenous Ecd to a transgenic SmD3::HA protein in prp8 depleted (nubTS>mRFP, SmD3::HA prp8RNAi) wing imaginal disc lysates compared to nubTS>mRFP, SmD3::HA samples. Imaginal discs expressing RFP only (nubTS>mRFP) served to control for unspecific binding. The transgene expression was induced for 24 h by temperature inactivation of Gal4 repressor Gal80. Data represent means ± SD, n = 3. Statistical significance was determined using unpaired two-tailed Student's t-test, *P < 0.05, **P < 0.01. See also Supplementary Figure S6
Figure 7.
Figure 7.
Ecd deficiency leads to transcriptome-wide changes in gene expression. (A) Heatmaps visualize relative expression levels of genes up and downregulated in homozygous mutant ecd1 larvae relative to control (w1118) upshifted to 29°C, which are clustered according to enriched GO terms (fold enrichment ≥ 3, P < 0.05) between individual samples. Data are log2(x + 1) transformed normalized counts. The color scale represents the Z-scores for each gene and each column represents one biological replicate of the indicated genotype. (B) Independent RT-qPCR confirms upregulation of stress-related genes (GstE6,upd2, Ilp8) in homozygous mutant ecd1 larvae relative to control (w1118) upshifted to 29°C while expression of proteasome subunits (Prosß5R2, Prosß4R2) and a regulator of microtubule organization (mud) was downregulated. Levels of rp49 transcripts were used for normalization. Data represent means ± SD, n = 8. Unpaired two-tailed Student's t-test with Welch's correction was used to determine significance, **P < 0.01, ***P < 0.001, n.s. = non-significant. See also Supplementary Figure S7 and Supplementary Dataset S3.
Figure 8.
Figure 8.
Ecd deficiency causes global alterations in splicing pattern. (A) The volcano plot shows changes in splicing pattern in ecd1 homozygous mutant third instar larvae upshifted to 29°C versus control (w1118) identified by LeafCutter. Every dot represents a splicing event. Dotted lines demarcate significantly changed events with delta percent spliced in deltaPSI ≥ 0.1 and adjusted P-value ≤ 0.05. (B, C) Sashimi-plots of selected candidate genes dre4 (B) and pex3 (C) from mRNA-seq data show alterations of splicing patterns in ecd1 homozygous mutant larvae compared to control (w1118). The representative images of semiQ-PCR gels and quantifications confirm missplicing events in dre4 (B) and pex3 (C) in ecd1 homozygous mutant wing discs relative to control dissected from third instar larvae that were kept at 18°C or upshifted to non-permissive temperature (29°C). Note that alteration to pex3 pre-mRNA splicing is already apparent in ecd1 samples at 18°C. Levels of rp49 transcripts were used for normalization. Data represent means ± SD, n = 5. Two-way ANOVA with Tukey's multiple comparison test was used to determine significance, *P < 0.05, **P < 0.01, ****P < 0.0001, n.s. = non-significant. (D) Proposed model for the role of Ecd in the cytoplasmic part of U5 snRNP biogenesis. U5 snRNP maturation is a step-wise process that starts in cytoplasm with SMN-guided assembly of the heptameric Sm protein ring around the conserved Sm binding site on the U5 snRNA. The generated core U5 snRNP particle then serves as a platform for association of further U5 snRNP-specific proteins. Ecd functions as a chaperon that, through interaction with SmD3, brings Prp8. The effective U5 snRNP biogenesis relies on binding cooperativity of Ecd and Prp8 and interactions with U5 snRNA. In the absence of Ecd, the core U5 snRNP particle forms properly, but Prp8 protein remains unshielded and destabilized, which interferes with U5 snRNP maturation, ultimately leading to spliceosome scarcity, transcriptome-wide splicing errors and cell death. See also Supplementary Figure S7 and Supplementary Dataset S4.

References

    1. Dvinge H., Kim E., Abdel-Wahab O., Bradley R.K.. RNA splicing factors as oncoproteins and tumour suppressors. Nat. Rev. Cancer. 2016; 16:413–430. - PMC - PubMed
    1. Scotti M.M., Swanson M.S.. RNA mis-splicing in disease. Nat. Rev. Genet. 2016; 17:19–32. - PMC - PubMed
    1. Matera A.G., Wang Z.. A day in the life of the spliceosome. Nat. Rev. Mol. Cell Biol. 2014; 15:108–121. - PMC - PubMed
    1. Fischer U., Englbrecht C., Chari A.. Biogenesis of spliceosomal small nuclear ribonucleoproteins. Wiley Interdiscip. Rev. RNA. 2011; 2:718–731. - PubMed
    1. Didychuk A.L., Butcher S.E., Brow D.A.. The life of U6 small nuclear RNA, from cradle to grave. RNA. 2018; 24:437–460. - PMC - PubMed

Publication types