. 2021 Mar 1:185:108456.
doi: 10.1016/j.neuropharm.2021.108456. Epub 2021 Jan 12.

Kappa opioid receptor activation in the amygdala disinhibits CRF neurons to generate pain-like behaviors

Affiliations

Kappa opioid receptor activation in the amygdala disinhibits CRF neurons to generate pain-like behaviors

Matthew Hein et al. Neuropharmacology. .

Abstract

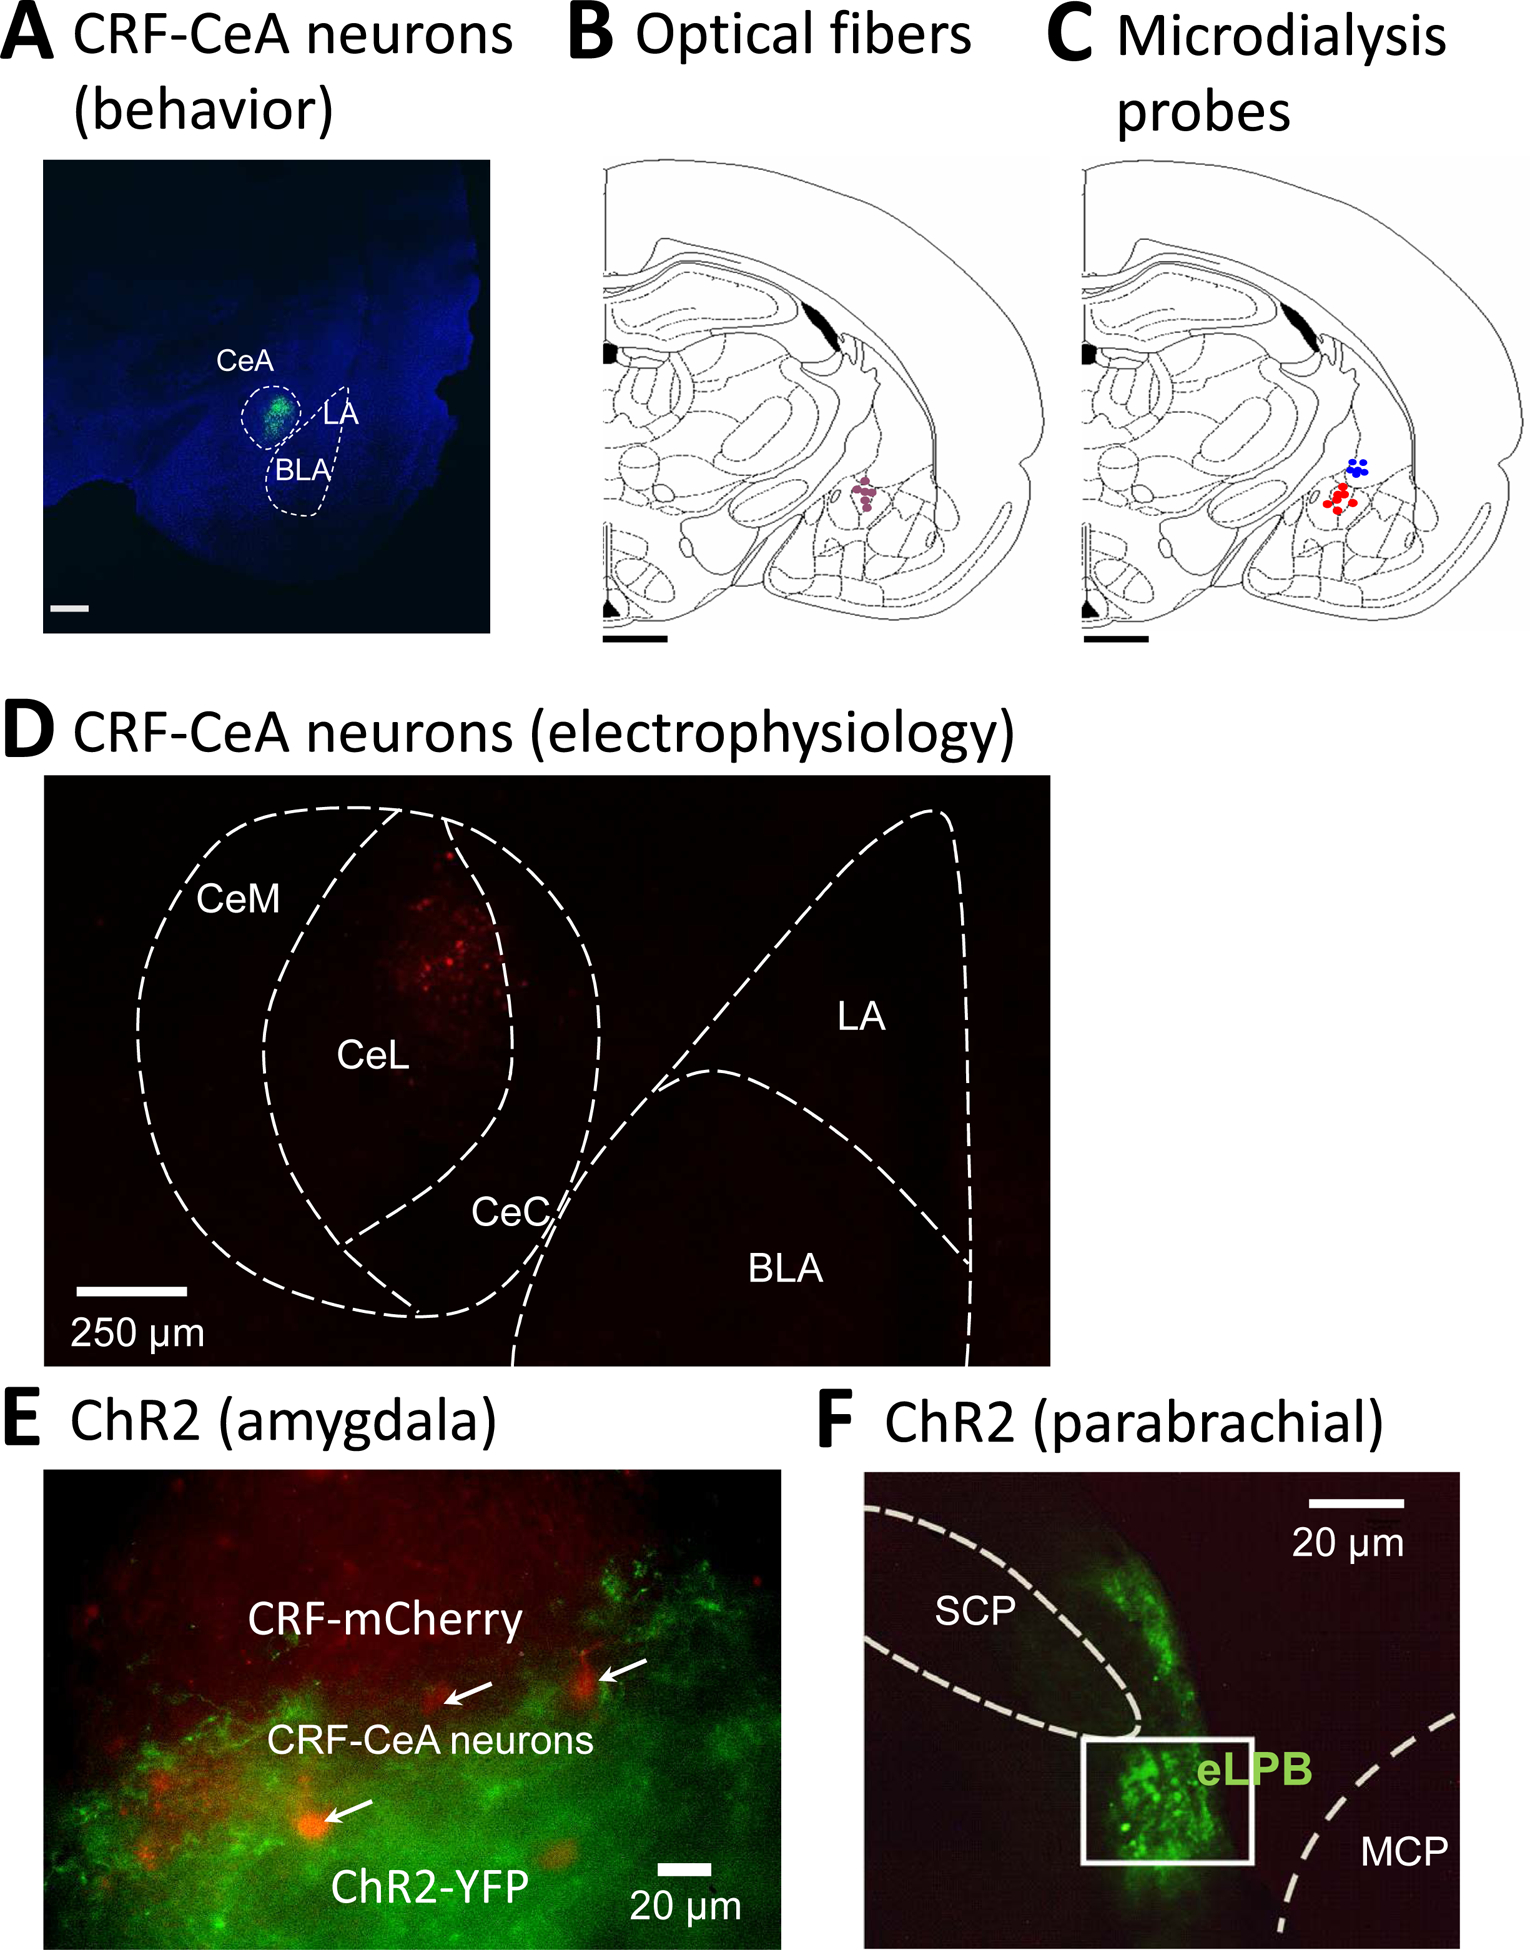
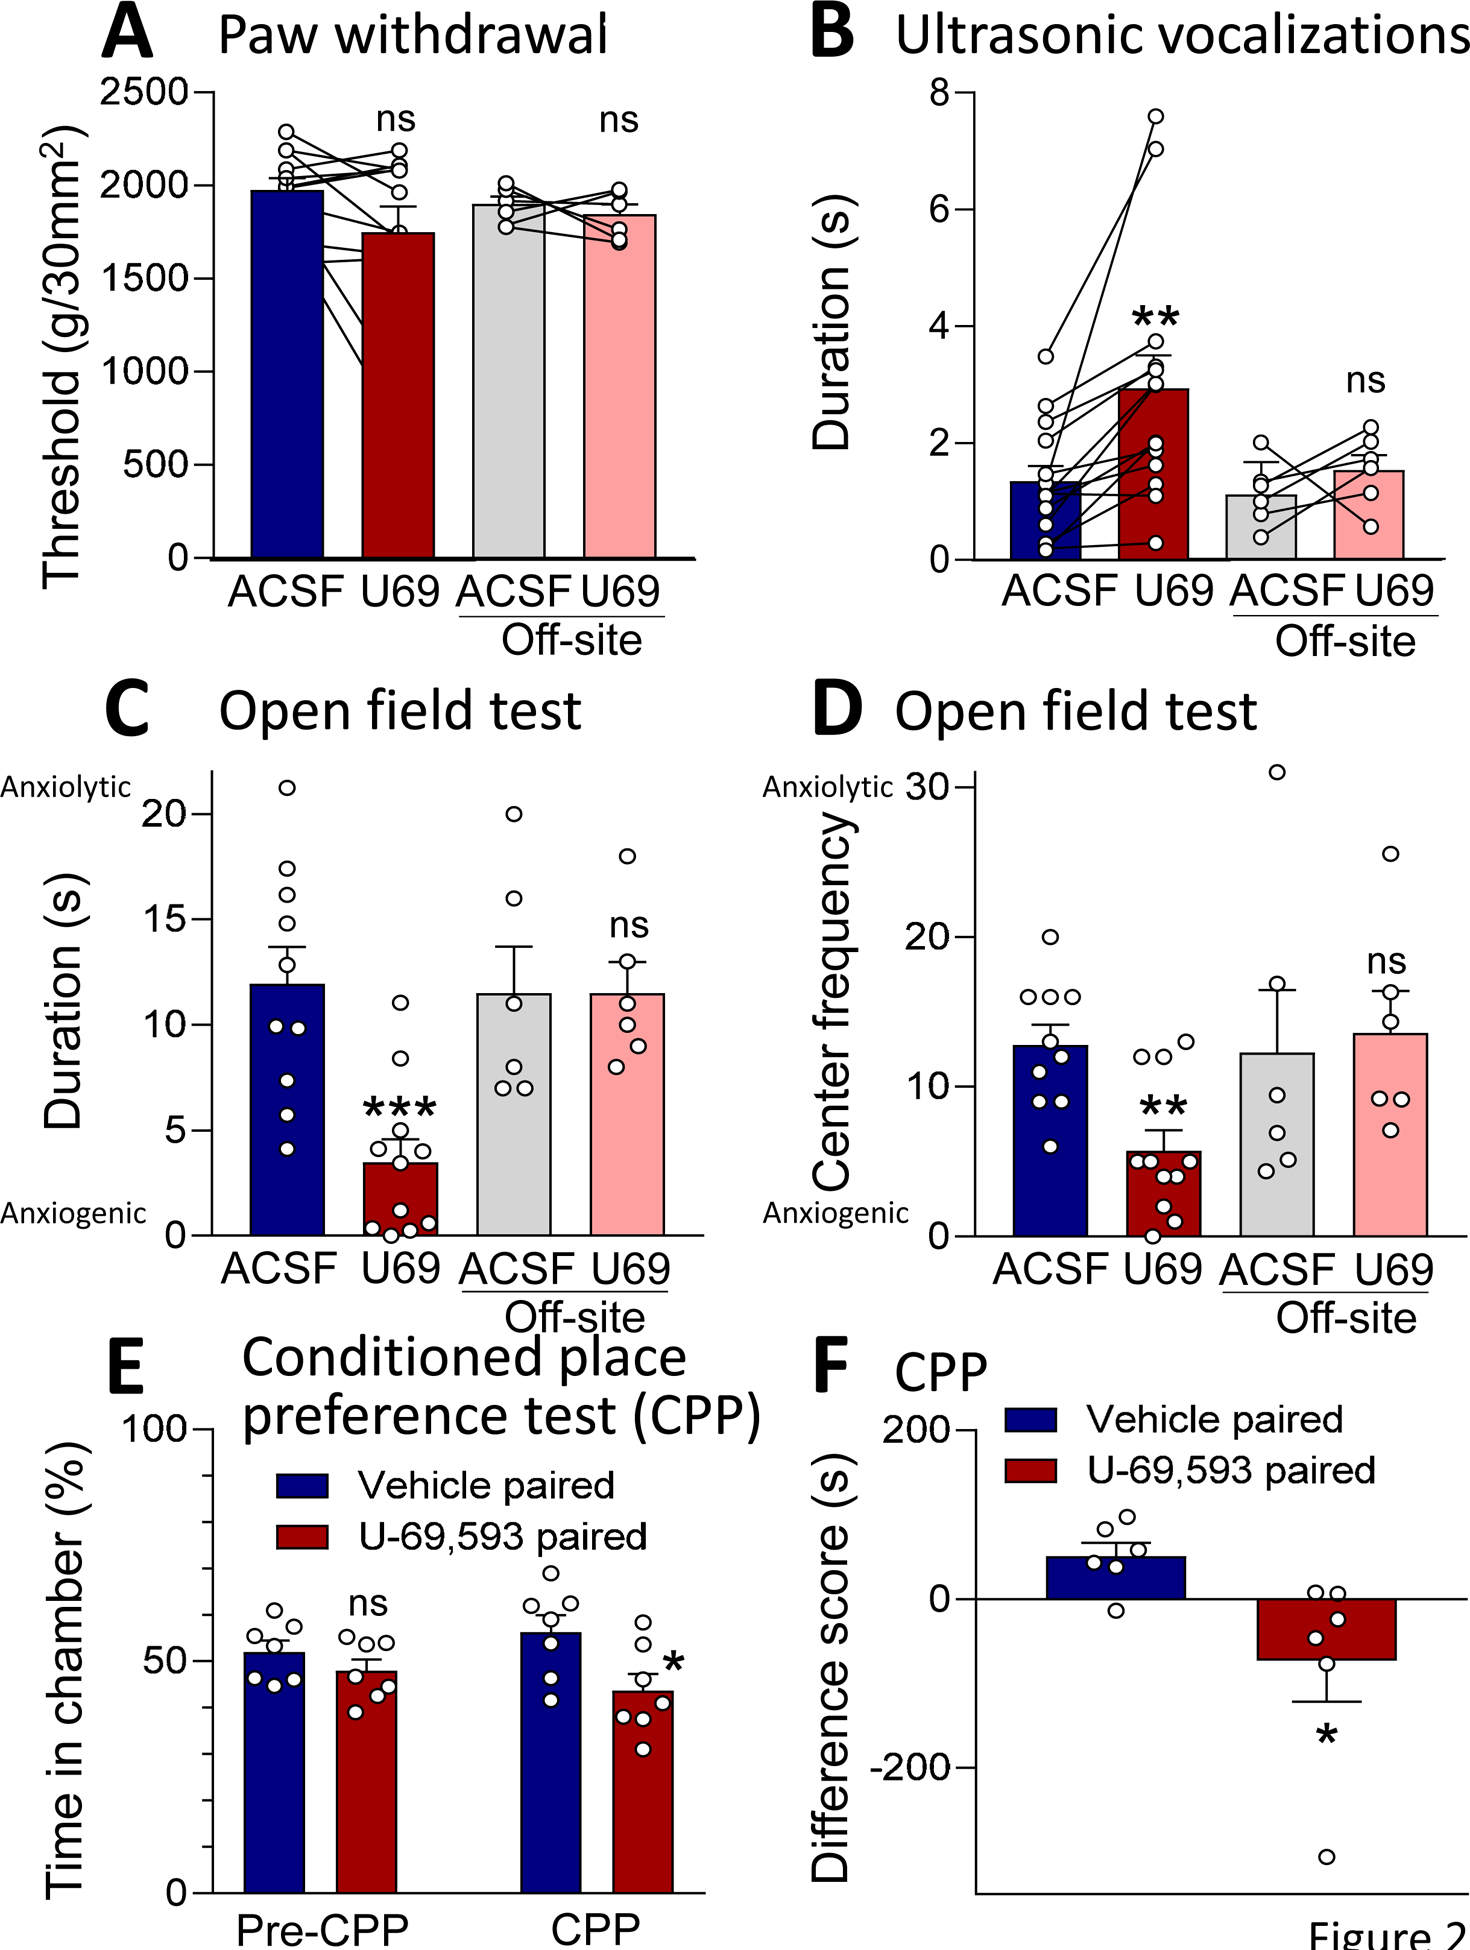
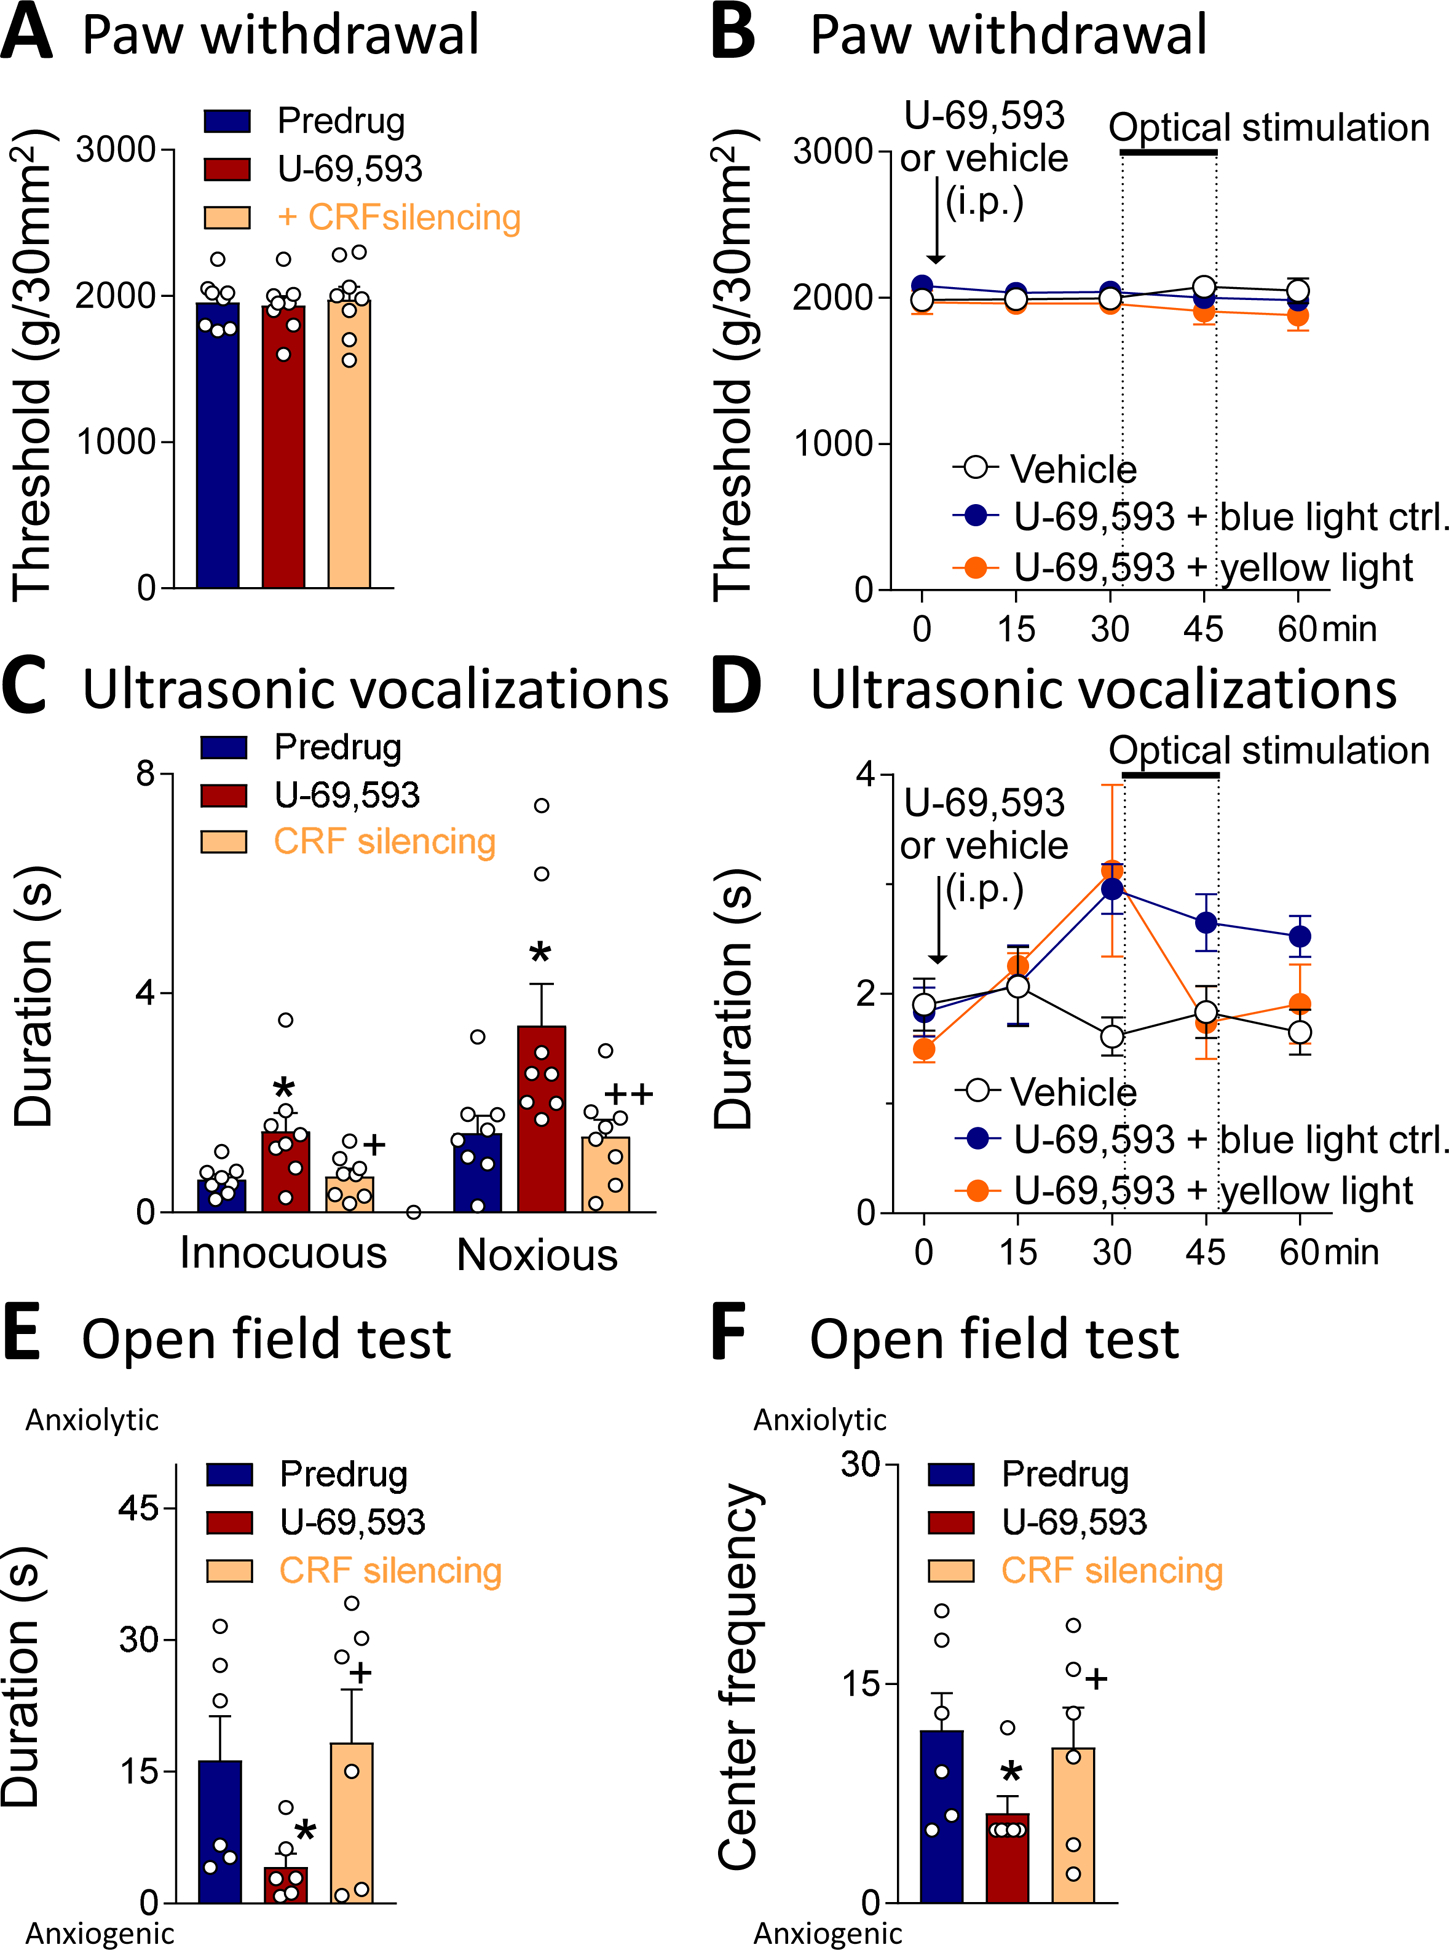
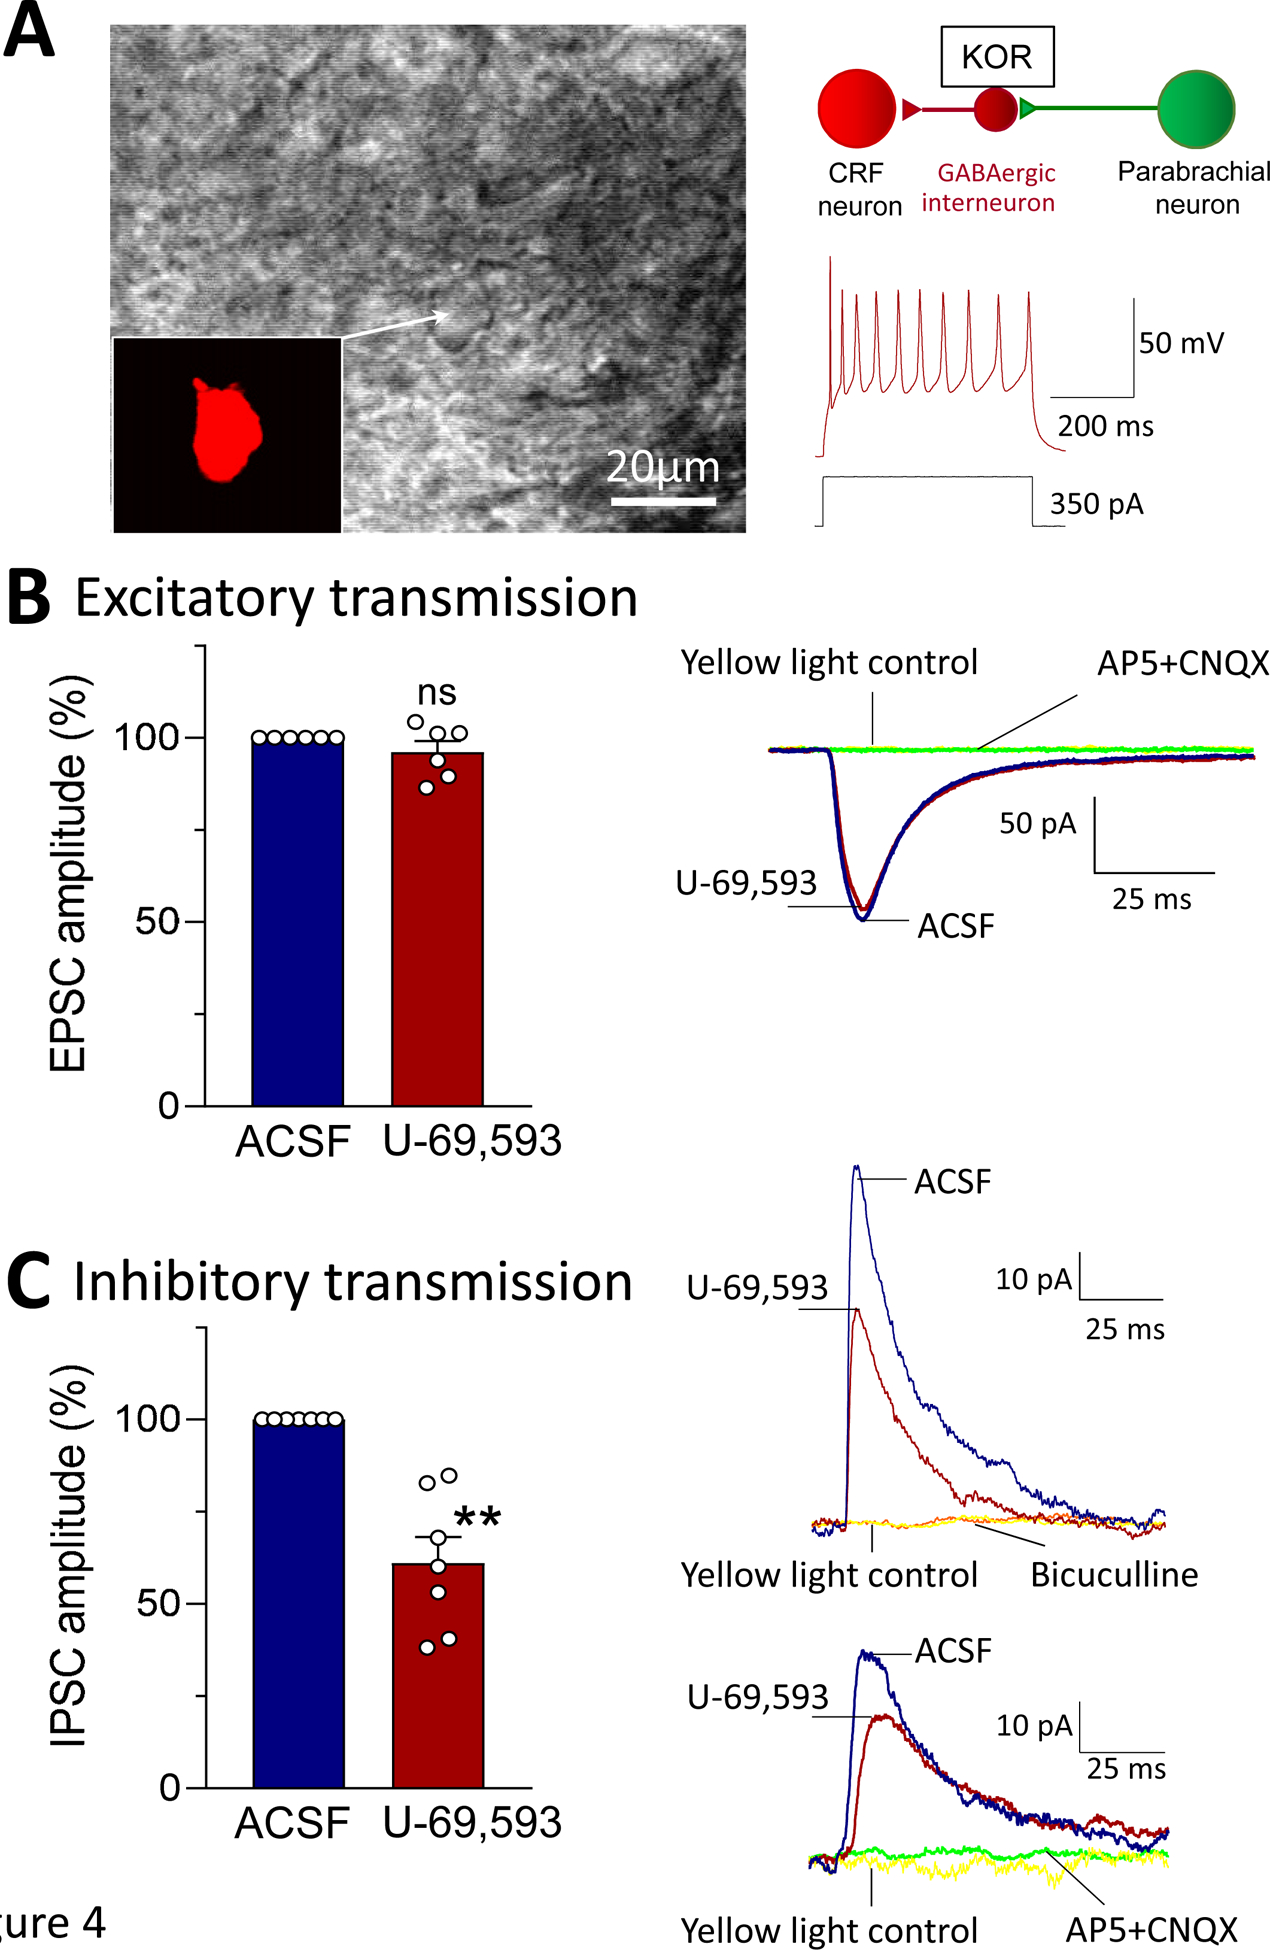
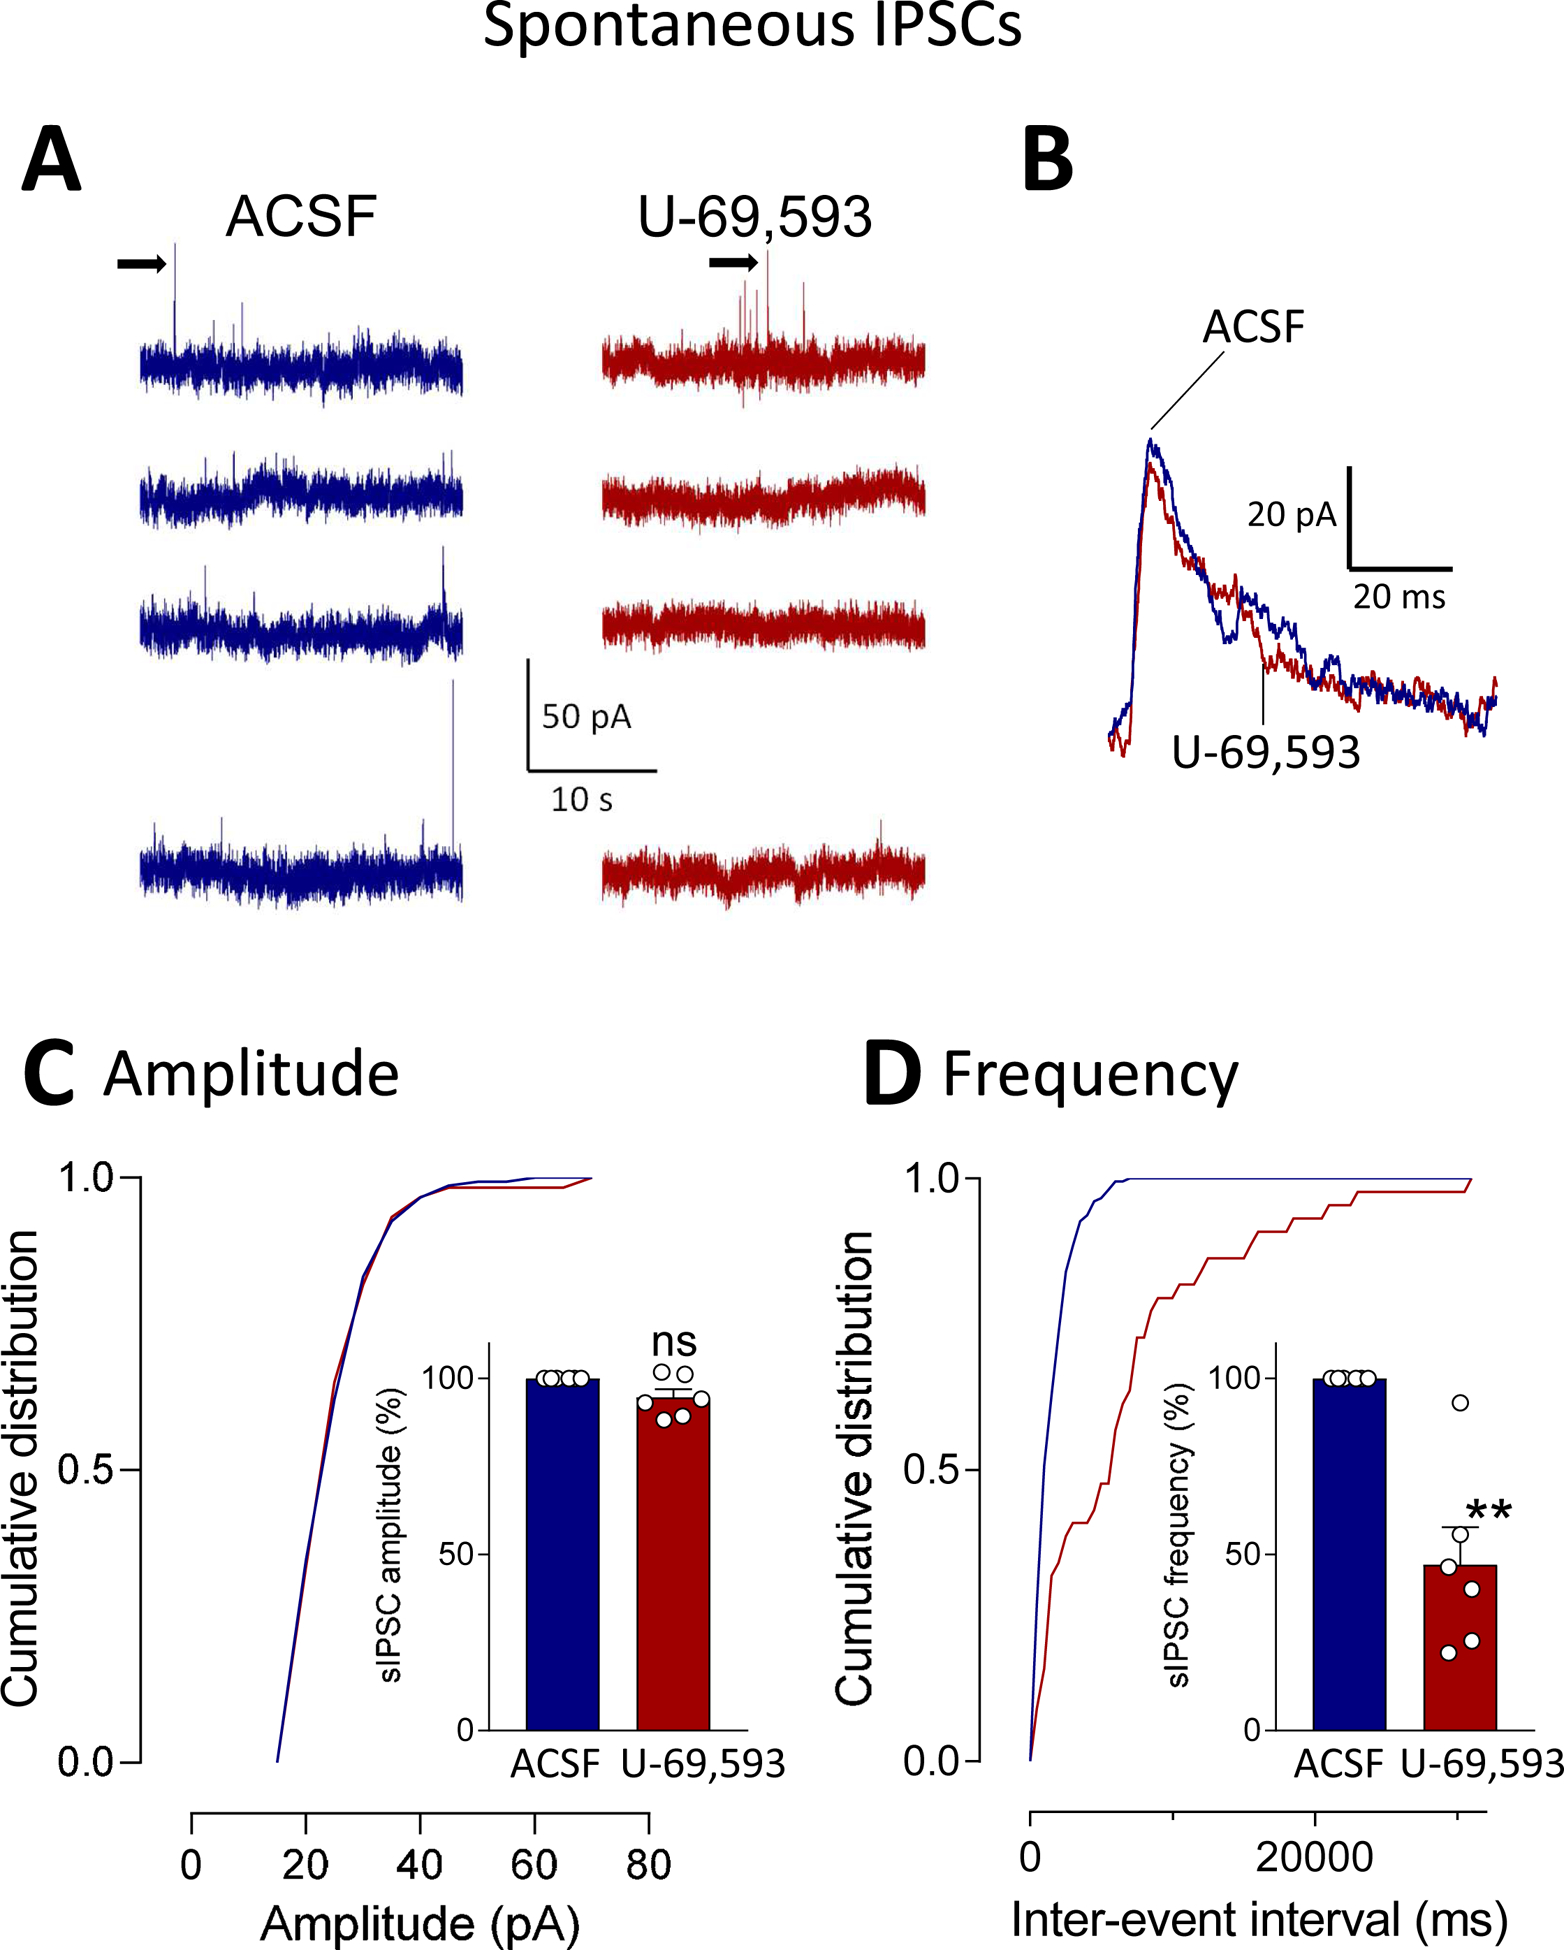
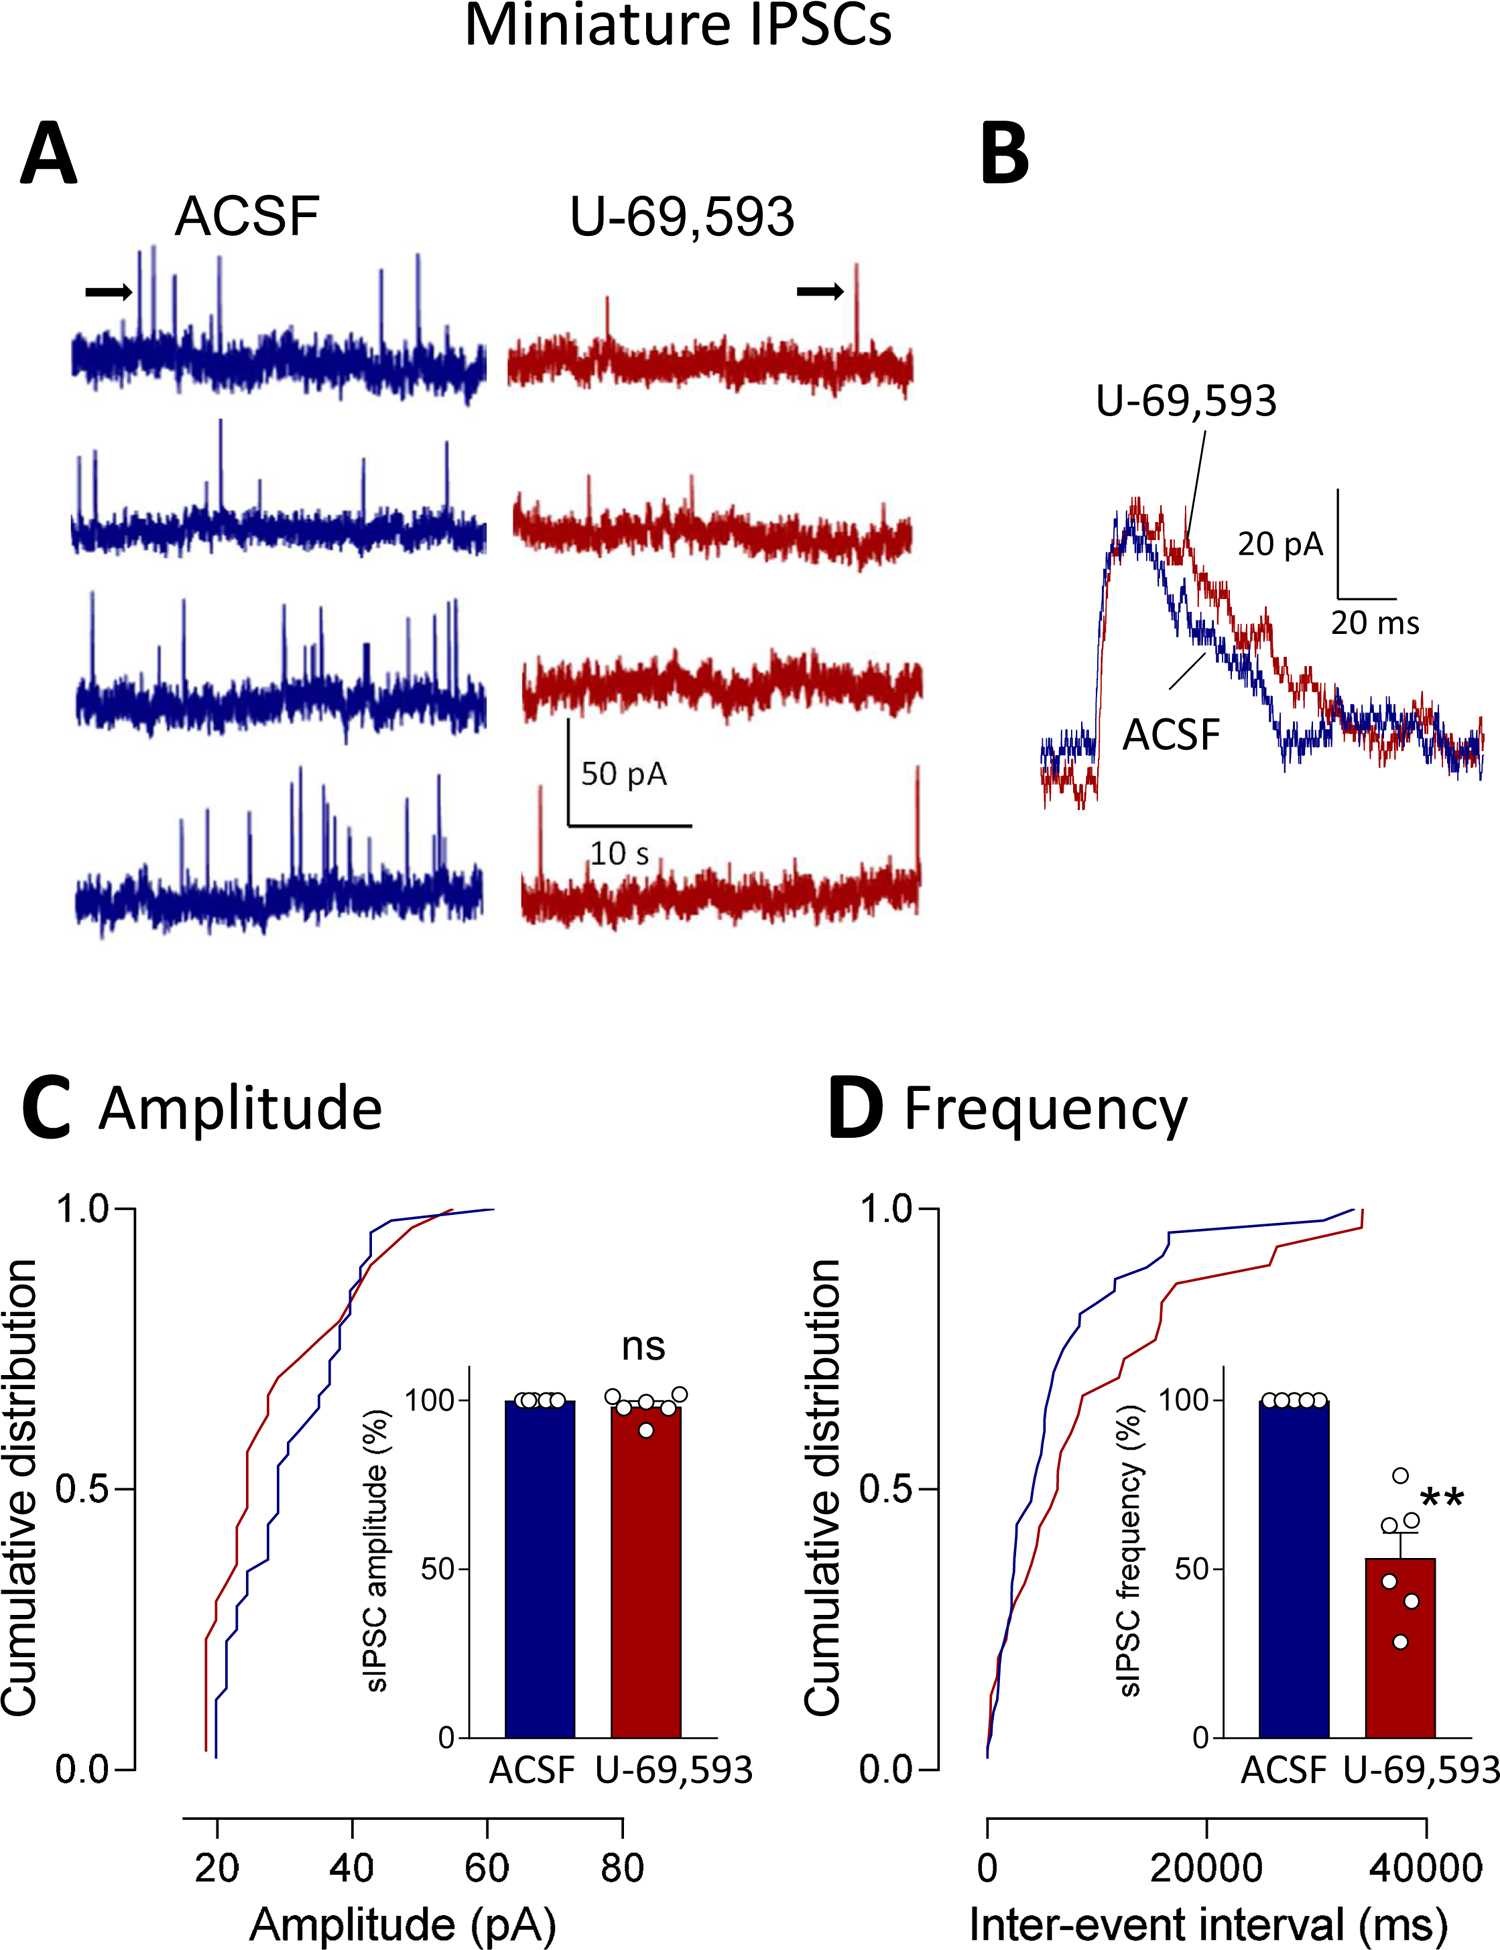
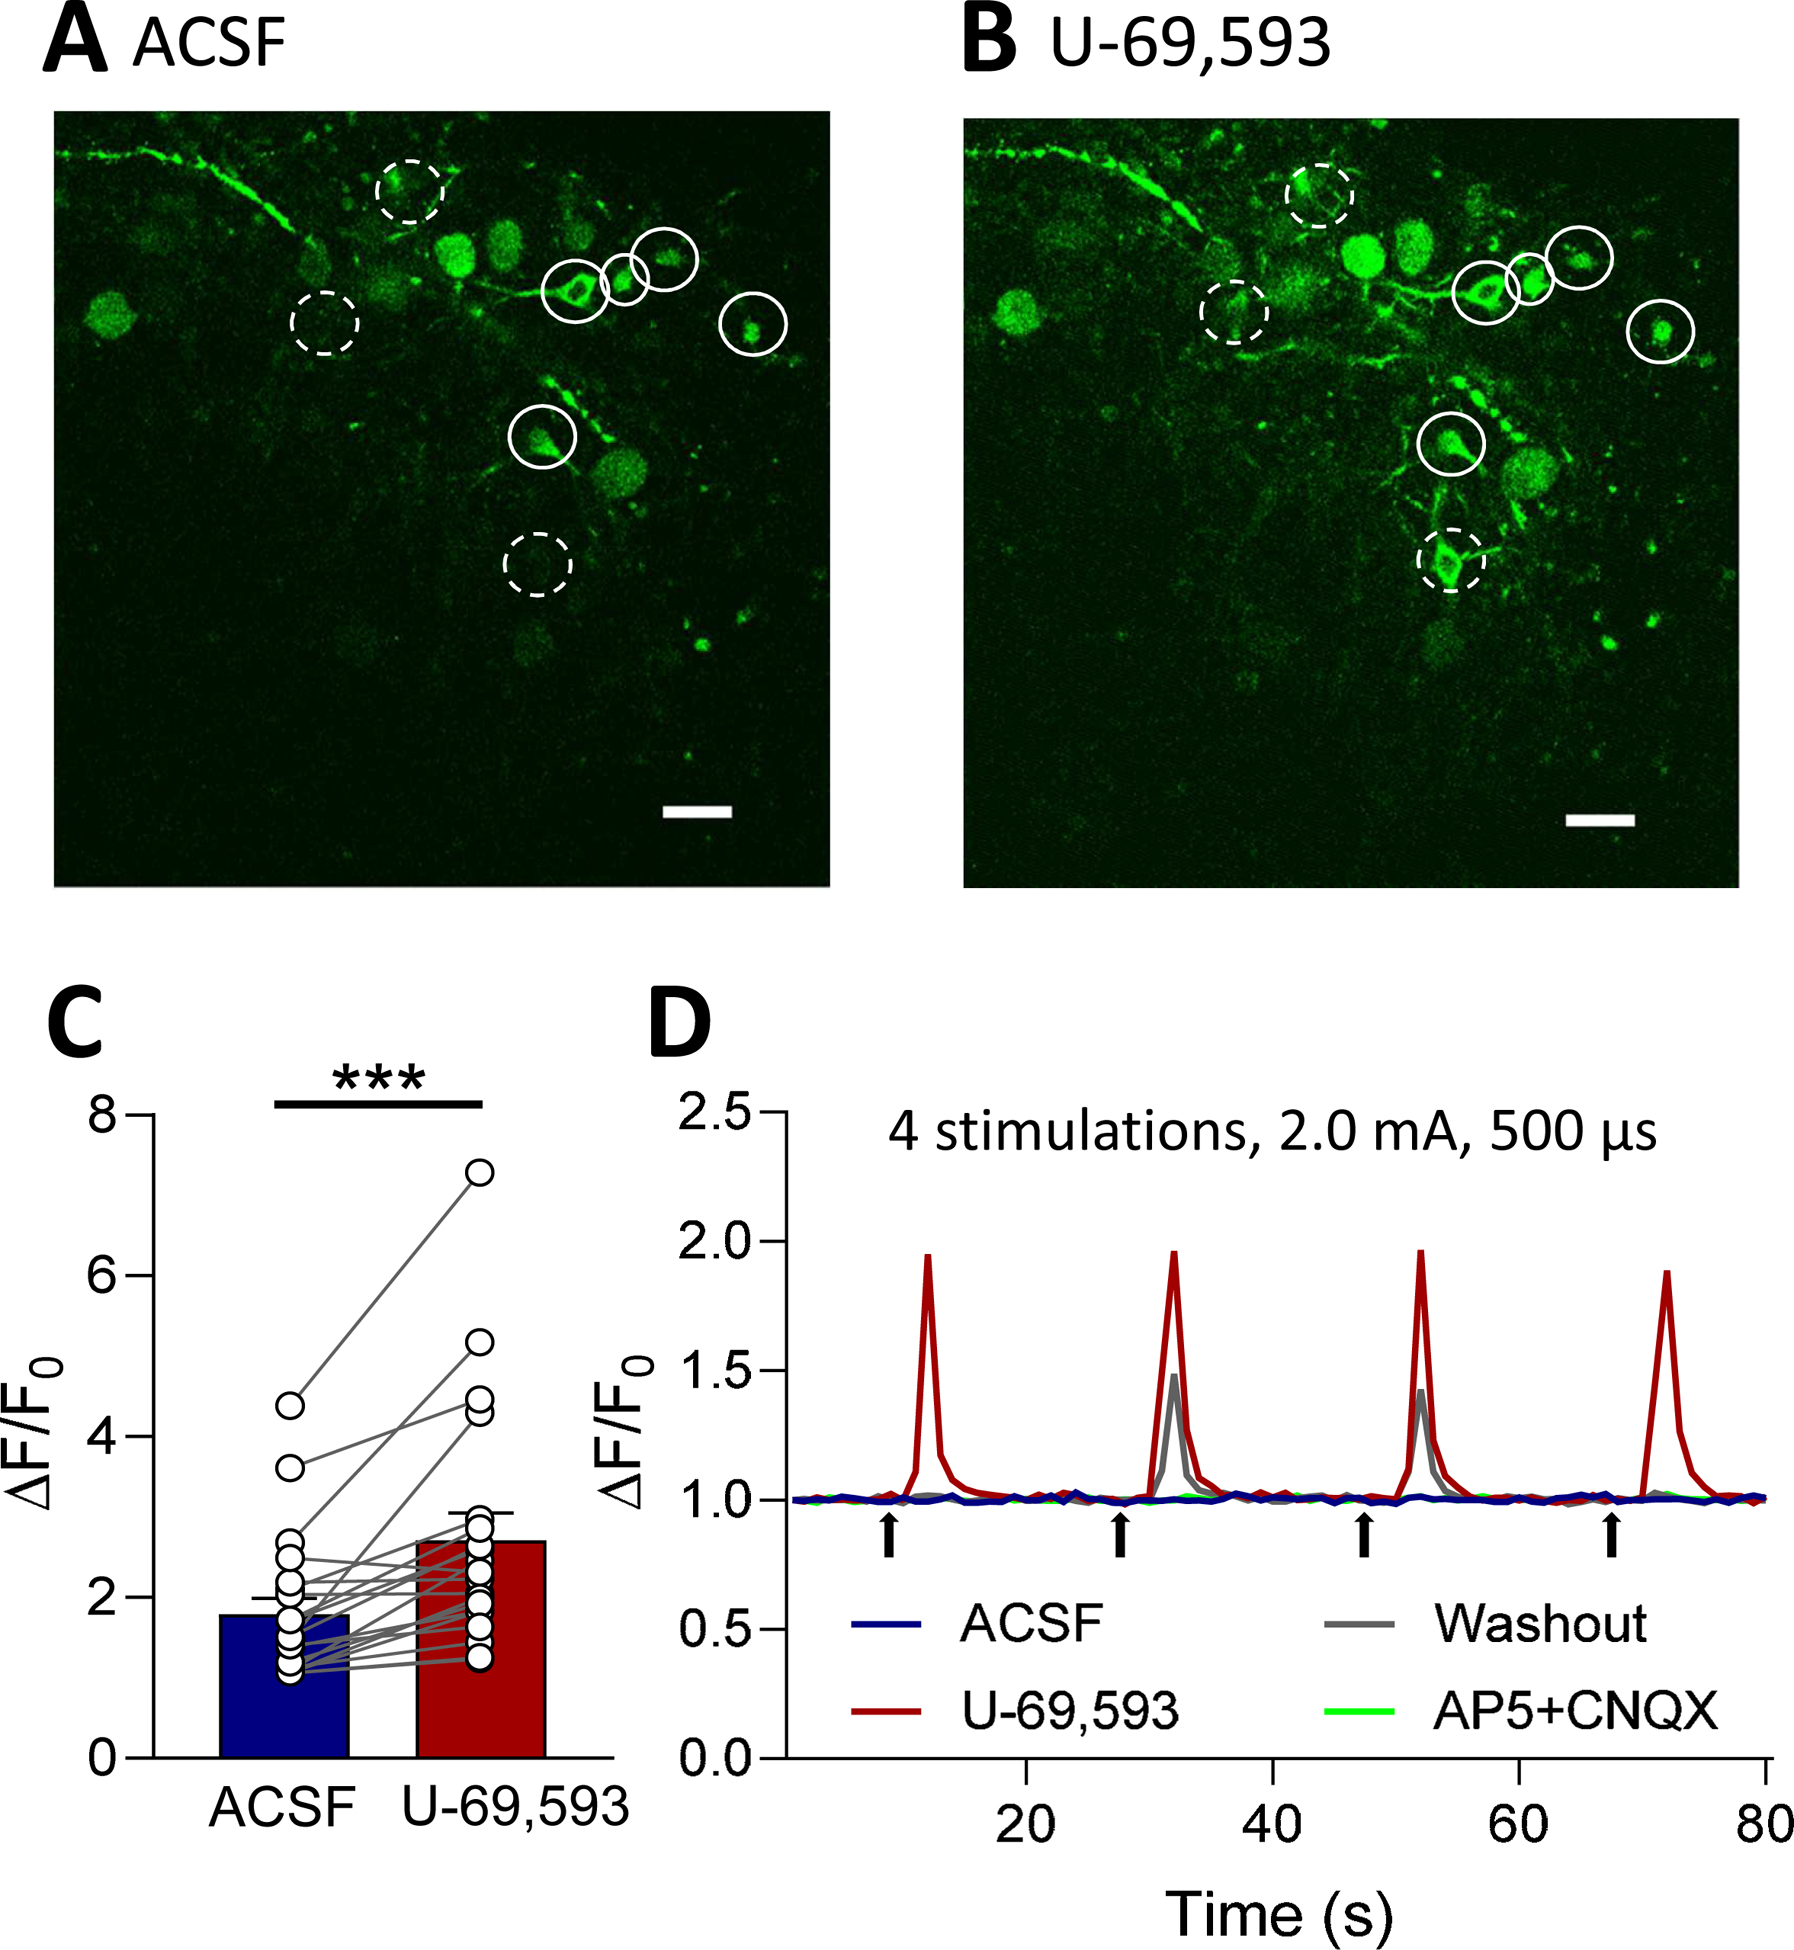
Recent evidence suggests that kappa opioid receptors (KOR) in limbic brain regions such as the amygdala contribute to pain conditions, but underlying mechanisms remain to be determined. The amygdala is an important player in averse-affective aspects of pain and pain modulation. The central nucleus (CeA) serves output functions through projection neurons that include corticotropin releasing factor (CRF) expressing neurons. The CeA is also rich in KOR. Here we tested the novel hypothesis that KOR activation in the CeA generates pain-like behaviors through a mechanism that involves inhibition of synaptic inhibition (disinhibition) of CRF neurons. Intra-CeA administration of a KOR agonist (U-69,593) increased vocalizations of naïve rats to noxious stimuli, and induced anxiety-like behaviors in the open field test (OFT) and avoidance in the conditioned place preference test, without affecting mechanosensory thresholds. Optogenetic silencing of CeA-CRF neurons blocked the facilitatory effects of systemically applied U-69,593 in naïve rats. Patch-clamp recordings of CRF neurons in rat brain slices found that U-69,593 decreased feedforward inhibitory transmission evoked by optogenetic stimulation of parabrachial afferents, but had no effect on monosynaptic excitatory transmission. U-69,593 decreased frequency, but not amplitude, of inhibitory synaptic currents, suggesting a presynaptic action. Multiphoton imaging of CeA-CRF neurons in rat brain slices showed that U-69,593 increased calcium signals evoked by electrical stimulation of presumed parabrachial input. This study shows for the first time that KOR activation increases activity of amygdala CRF neurons through synaptic disinhibition, resulting in averse-affective pain-like behaviors. Blocking KOR receptors may therefore represent a novel therapeutic strategy.

Keywords: Amygdala; Behavior; Corticotropin-releasing factor; Kappa opioid receptor; Pain; Patch clamp.


Figures

Figure 1.
Figure 1.. Location of CRF neurons, optical fibers and microdialysis probes in the central nucleus of the amygdala (CeA).
(A) Confocal image of eGFP fluorescence in a brain slice from a Crh-Cre rat shows neurons expressing CRF in the CeA 4–5 weeks after rAAV5/EF1a-DIO-eNpHR3.0-eYFP injection into the CeA. Scale bar, 500 μm. LA, BLA, lateral and basolateral amygdala (B, C) Diagrams show coronal brain slices, −2.56 caudal to bregma. Symbols indicate the positions of the tips of optical fibers for yellow light stimulation to silence neurons (B) and of microdialysis fibers for drug application into CeA (red symbols) or striatum (blue symbols; C) in the right CeA. Scale bar, 500mm. (D) Confocal image of CRF neurons in the CeA in a brain slice from a Crh-Cre rat 4 weeks after injection of AAV5-EF1α-DIO-mCherry into the CeA. CeC, CeL, CeM, capsular, lateral and medial division of CeA. (E) Channelrhodopsin 2 (ChR2) in afferent terminals of glutamatergic neurons of the parabrachial nucleus were visualized in the CeA 4 weeks after injection of rAAV5-CaMKIIa-hChR2(H134R)-eYFP into the parabrachial nucleus (see 1F). CeA-CRF neurons (examples indicated by arrows) are visualized by their expression of mCherry (see D). (F) Injection site for rAAV5-CaMKIIa-hChR2(H134R)-eYFP in the external lateral parabrachial area (eLPB) to express ChR2 in glutamatergic neurons. SPC and MCP, superior and middle cerebellar peduncles.
Figure 2.
Figure 2.. Behavioral effects of a KOR agonist (U-69,593) administered into CeA.
(A) U-69,593 (100 μM in microdialysis probe) administered into the CeA had no significant effect on mechanical withdrawal thresholds. P > 0.05, paired t-test, compared to predrug ACSF control; n = 12. Offsite control administration of U-69,593 into striatum also had no significant effect. P > 0.05, paired t-test compared to ACSF; n = 6. (B) U-69,593 increased ultrasonic vocalizations evoked by noxious compression of the knee. ** P < 0.01, paired t-test, compared to predrug ACSF control, n = 14. Offsite control administration of U-69,593 had no effect. P > 0.05, paired t-test compared to ACSF; n = 6. (C, D) U-69,593 increased anxiety-like behaviors measured as decreased duration in the center (C) and frequency of entries into the center (D) in the open field test. **,*** P< 0.01, 0.001, t-tests, compared to ACSF control, n = 10 (ACSF), n = 11 (U-69,593). (A-D) Offsite control administration of U-69,593 had no significant effect P > 0.05, paired t-test compared to ACSF; n = 6. (E, F) U-69,593 administration caused avoidance of the drug paired chamber in the conditioned place preference test (CPP). (E) Significantly decreased ratio of time spent in drug paired chamber compared to vehicle paired chamber after conditioning (CPP) but not before pairing (pre-CPP). P < 0.05, ANOVA with Bonferroni posthoc tests, n = 7. (F) Difference score (time spent in drug or vehicle paired chamber on test day minus time on preconditioning day) was significantly lower for U-69,593 compared to vehicle. P < 0.05, t-test, n = 7. Bar histograms show mean ± SEM. Symbols show data from individual animals.
Figure 3.
Figure 3.. Behavioral effects of systemic application of a KOR agonist (U-69,593) with optical silencing of CeA-CRF neurons.
(A) Compared to predrug, U-69,593 (1.0 mg/kg, intraperitoneally, i.p.) had no effect on mechanical withdrawal thresholds and optical silencing of CeA-CRF neurons (yellow light activation of halorhodopsin; see Materials and Methods) also had no effect (n = 8). (B) Time course analysis shows the lack of effect of U-69,593 (1.0 mg/kg, i.p.) in controls (blue light or no light; n = 6) and with optical silencing of CeA-CRF neurons with yellow light (n = 5) compared to vehicle (saline, i.p.) control (n = 6). (C) Optogenetic silencing of CeA-CRF neurons reversed the facilitatory effects of systemically applied U-69,593 on ultrasonic vocalizations evoked by noxious compression of the knee (n = 8). (D) Time course analysis shows that optical silencing of CeA-CRF neurons with yellow light (n = 5) but not control interventions (blue light or no light; n = 6) inhibited the effect of U-69,593 (1.0 mg/kg, i.p.) on ultrasonic vocalizations. Vehicle had no effect (n = 6). (E, F) Optogenetic silencing of CeA-CRF neurons reversed the anxiogenic-like effects of systemically applied U-69,593 in the open-field test (C, duration in center; D, entries into center; n = 6). Behavioral testing was done 30 min after injection of U-69,953; optical silencing started 15 min later and was done for 15 min followed by behavioral testing at the 60 min time point. * P < 0.05, compared to pre-drug (ACSF); + P < 0.05, compared to U-69,593 alone; repeated measures ANOVA with Bonferroni posthoc tests. Bar histograms show mean ± SEM. Symbols show data from individual animals.
Figure 4.
Figure 4.. Effects of a KOR agonist (U-69,593) on excitatory and inhibitory synaptic transmission in CeA-CRF neurons.
Whole-cell patch-clamp recordings were obtained from visually identified CeA-CRF neurons (see Materials and Methods). (A) Hypothesized synaptic circuitry. Individual CeA-CRF neuron is shown in brightfield and with fluorescence (for mCherry) illumination as seen under the microscope. Action potentials were evoked in this regular spiking neuron by intracellular injection of a depolarizing current. (B) Excitatory postsynaptic currents (EPSCs) evoked by optical stimulation (472 nm, 10 ms, 12 mW) of ChR2 expressing glutamatergic parabrachial afferents (see Materials and Methods) were not affected by administration of U-69,593 (1 μM) (n = 6; P > 0.05, paired t-test, compared to predrug ACSF). Traces show an individual example. EPSCs were blocked by AP5 and CNQX (see 2.7.3.). Yellow light (590 nm) stimulation served as a control. (C) Inhibitory postsynaptic currents (IPSCs) evoked by optical stimulation of glutamatergic parabrachial afferents were significantly decreased (dis-inhibition) by administration of U-69,593 (n = 7; ** P < 0.001, paired t-test, compared to predrug ACSF). Traces show individual examples. IPSCs were blocked by bicuculline (upper example) and by AP5 and CNQX (lower example; see Materials and Methods). Yellow light stimulation served as a control. EPSCs and IPSCs were recorded at −70 mV and 0 mV, respectively. Bar histograms show means ± SEM. Symbols show values of individual neurons.
Figure 5.
Figure 5.. Effects of a KOR agonist (U-69,593) on spontaneous IPSCs (sIPSCs) in CeA-CRF neurons.
Whole-cell patch-clamp recordings were obtained from visually identified CeA-CRF neurons (see Materials and Methods). (A) Traces show individual examples of voltage-clamp recordings of sIPSCs during application of vehicle (ACSF) and U-69,593 (1 μM, 15 min). (B) Traces of individual sIPSCs (taken from traces in A as indicated by arrows) show that GABAA channel kinetics were not altered by U-69,593. (C) Analysis of cumulative distribution (individual neuron) and mean sIPSC amplitude showed that U-69,593 had no significant effect on amplitude (n = 6; P > 0.05, paired t-test, compared to ACSF predrug control). (D) U-69,593 decreased sIPSC frequency significantly (n = 6; P < 0.01, paired t-test compared to predrug ACSF). Bar histograms show means ± SEM. Symbols show values of individual neurons.
Figure 6.
Figure 6.. Effects of a KOR agonist (U-69,593) on miniature IPSCs (mIPSCs) in CeA-CRF neurons.
Whole-cell patch-clamp recordings were obtained from visually identified CeA-CRF neurons (see Materials and Methods). (A) Traces show individual examples of voltage-clamp recordings of mIPSCs during application of ACSF and U-69,593 (1 μM, 15 min). (B) Traces of individual mIPSCs (taken from traces in A as indicated by arrows) show that GABAA channel kinetics were not altered by U-69,593. (C) Analysis of cumulative distribution (individual neuron) and mean mIPSC amplitude showed that U-69,593 had no significant effect on amplitude (n = 6; P > 0.05, paired t-test, compared to ACSF predrug control). (D) U-69,593 decreased mIPSC frequency significantly (n = 6; P < 0.01, paired t-test compared to predrug ACSF). Bar histograms show means ± SEM. Symbols show values of individual neurons.
Figure 7.
Figure 7.. Effects of a KOR agonist (U-69,593) on calcium transients in CeA-CRF neurons.
Calcium imaging of CeA-CRF neurons in brain slices was done using a multiphoton system (see Materials and Methods). (A, B) Images show CeA-CRF neurons expressing a fluorescent calcium indicator (GCaMP6f) in response to electrical stimulation (2.0 mA, 0.5ms) of presumed parabrachial afferents (see Materials and Methods). Solid and dashed circles indicate neurons that fluoresced after application of U-69,593 (1 μM, 15 min; B) compared to the same neurons in the presence of vehicle (ACSF, A). (C) U-69,593 increased calcium transients in CeA-CRF neurons expressing GCaMP6f (n = 20 neurons, 4 rats; P < 0.001, paired t-test, compared to predrug control). (D) Traces show the responses of an individual CeA-CRF neuron during application of ACSF, U-69,593, washout in ACSF, and AP5 (50uM) and CNQX (20uM). Bar histograms show means ± SEM. Symbols show values of individual neurons.

References

    1. Allen HN, Bobnar HJ, Kolber BJ, 2020. Left and right hemispheric lateralization of the amygdala in pain. Prog Neurobiol, 101891. - PMC - PubMed
    1. Apkarian AV, Neugebauer V, Koob G, Edwards S, Levine JD, Ferrari L, Egli M, Regunathan S, 2013. Neural mechanisms of pain and alcohol dependence. Pharmacol. Biochem. Behav 112C, 34–41. - PMC - PubMed
    1. Beckerman MA, Van Kempen TA, Justice NJ, Milner TA, Glass MJ, 2013. Corticotropin-releasing factor in the mouse central nucleus of the amygdala: ultrastructural distribution in NMDA-NR1 receptor subunit expressing neurons as well as projection neurons to the bed nucleus of the stria terminalis. Exp. Neurol 239, 120–132. - PMC - PubMed
    1. Bruchas MR, Land BB, Chavkin C, 2010. The dynorphin/kappa opioid system as a modulator of stress-induced and pro-addictive behaviors. Brain Res 1314, 44–55. - PMC - PubMed
    1. Bruchas MR, Land BB, Lemos JC, Chavkin C, 2009. CRF1-R activation of the dynorphin/kappa opioid system in the mouse basolateral amygdala mediates anxiety-like behavior. PLoS. One 4, e8528. - PMC - PubMed

Publication types

MeSH terms