. 2021;11(5):1548-1592.e1.
doi: 10.1016/j.jcmgh.2020.12.014. Epub 2021 Jan 11.

scRNA-Seq Reveals New Enteric Nervous System Roles for GDNF, NRTN, and TBX3

Affiliations

scRNA-Seq Reveals New Enteric Nervous System Roles for GDNF, NRTN, and TBX3

Christina M Wright et al. Cell Mol Gastroenterol Hepatol. 2021.

Abstract

Background and aims: Bowel function requires coordinated activity of diverse enteric neuron subtypes. Our aim was to define gene expression in these neuron subtypes to facilitate development of novel therapeutic approaches to treat devastating enteric neuropathies, and to learn more about enteric nervous system function.

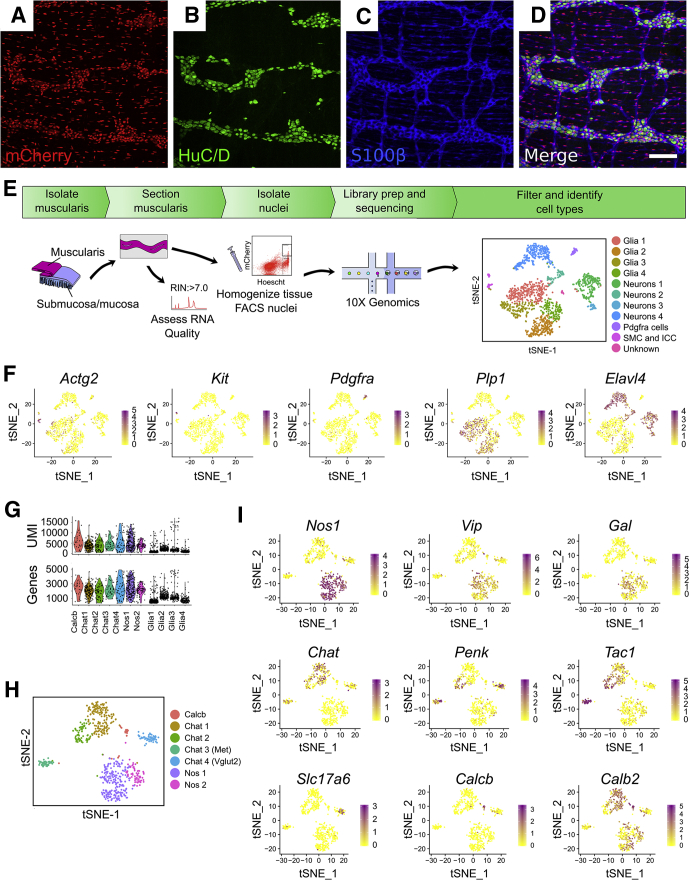
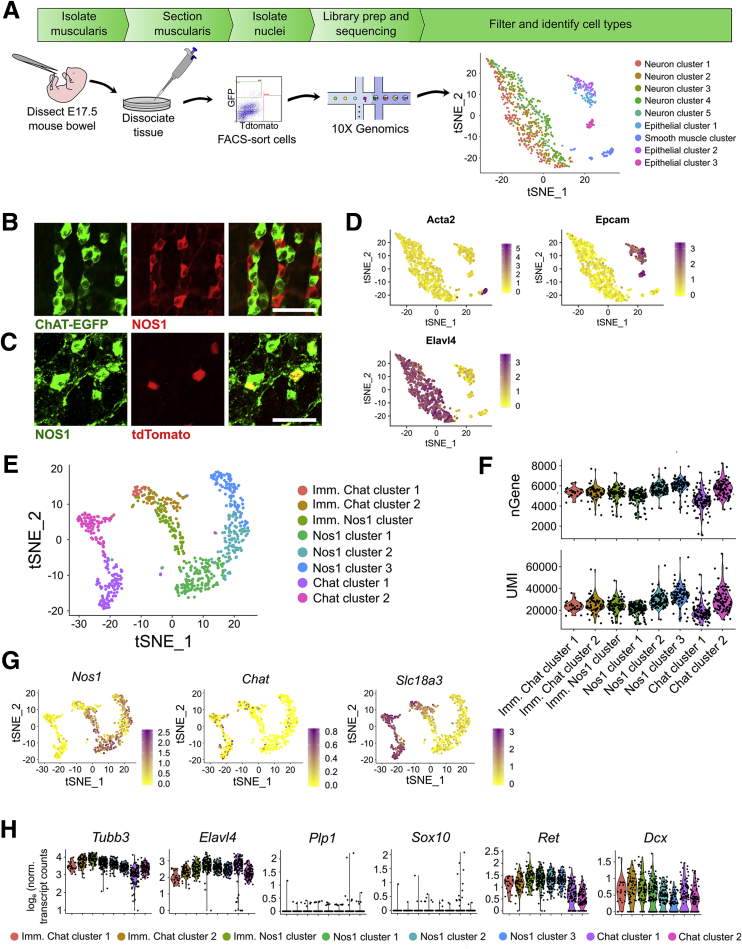
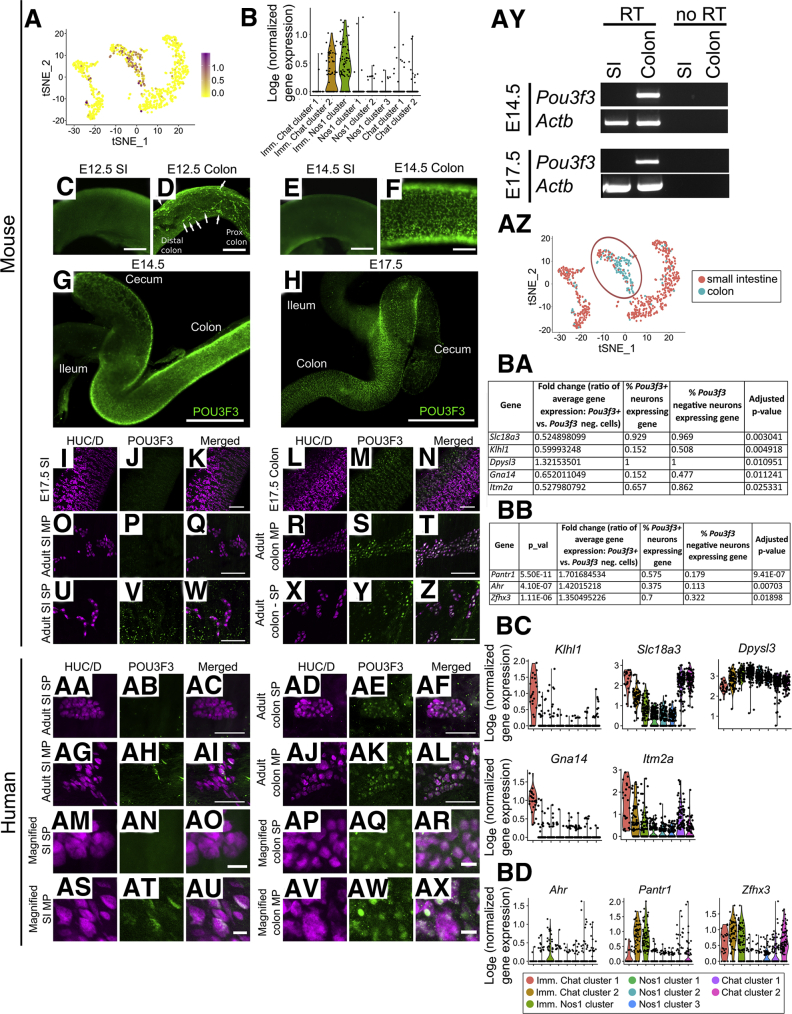
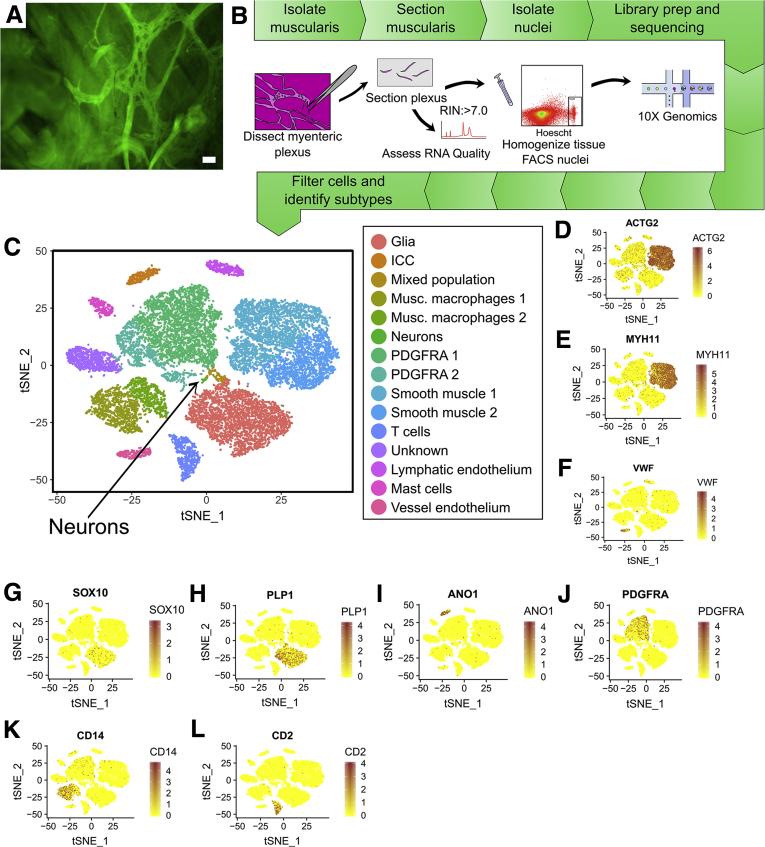
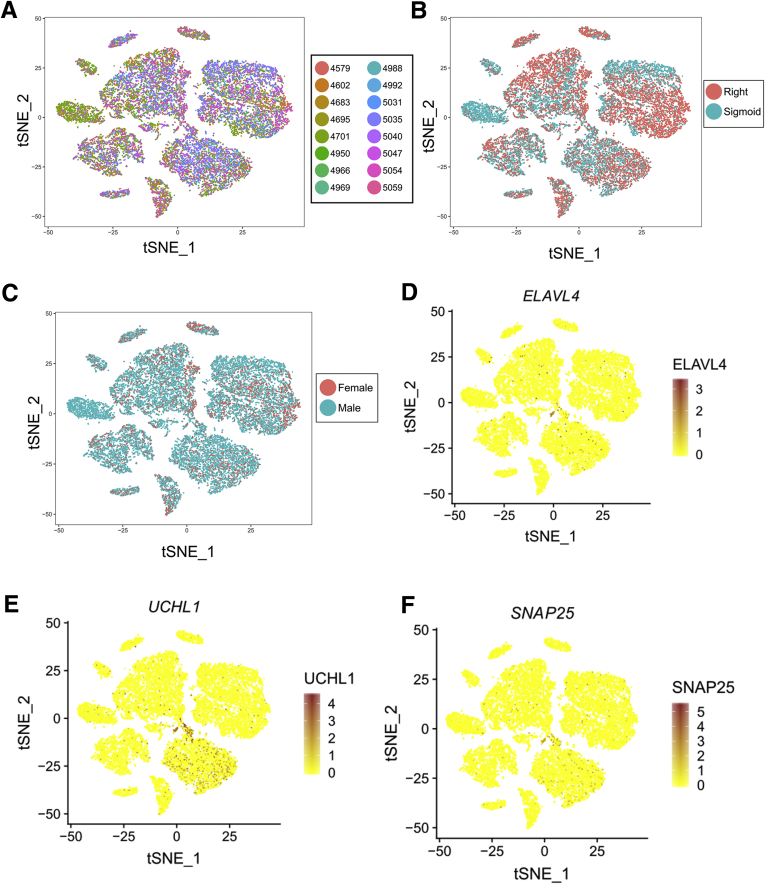
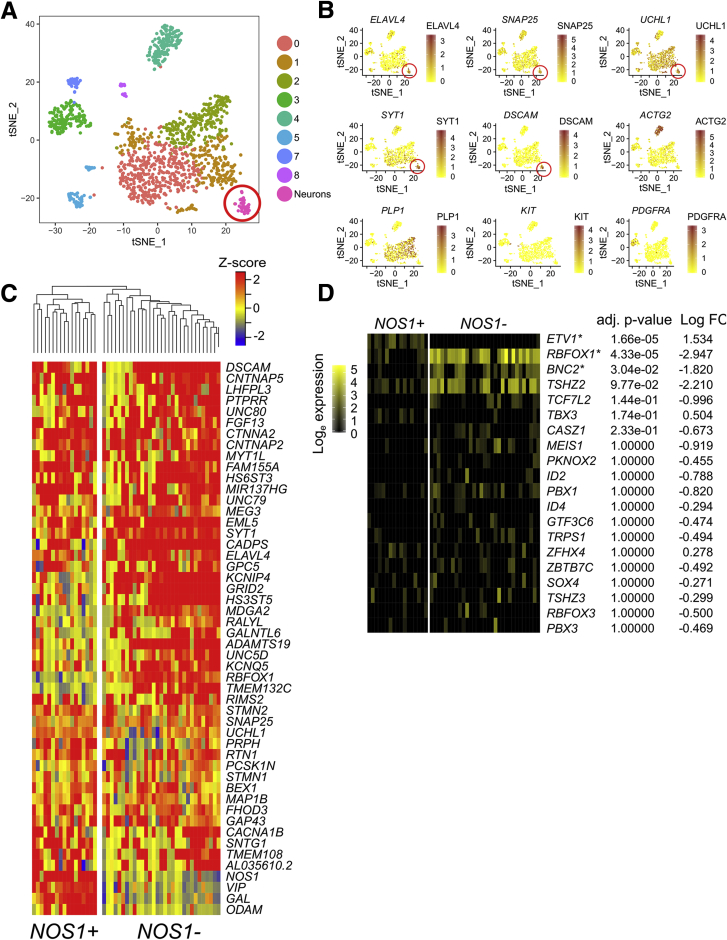
Methods: To identify subtype-specific genes, we performed single-nucleus RNA-seq on adult mouse and human colon myenteric plexus, and single-cell RNA-seq on E17.5 mouse ENS cells from whole bowel. We used immunohistochemistry, select mutant mice, and calcium imaging to validate and extend results.

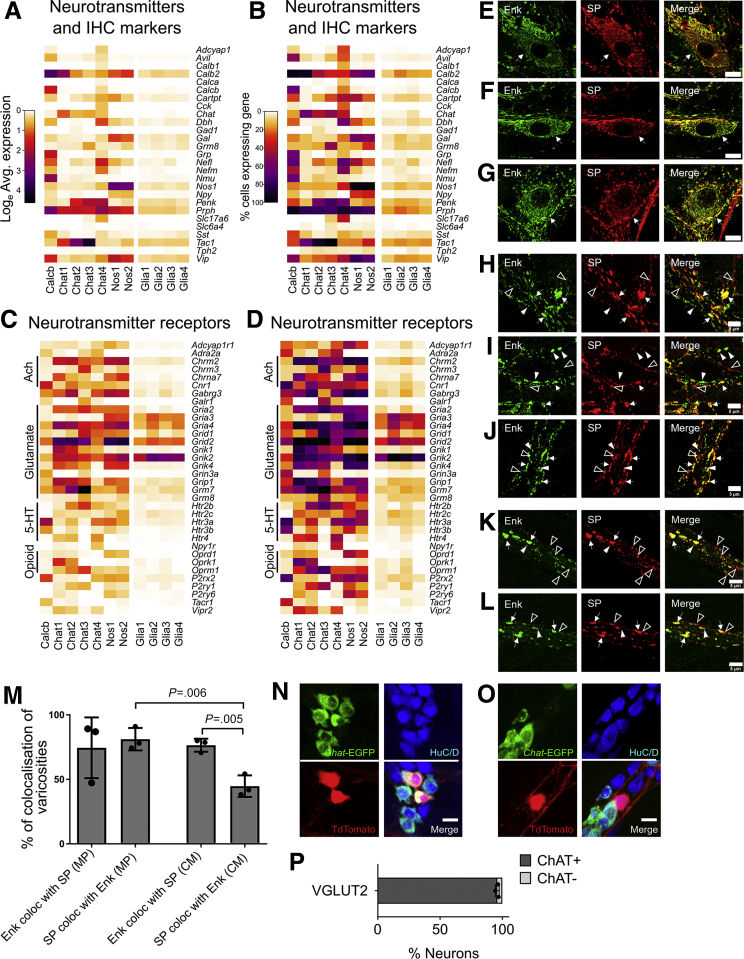
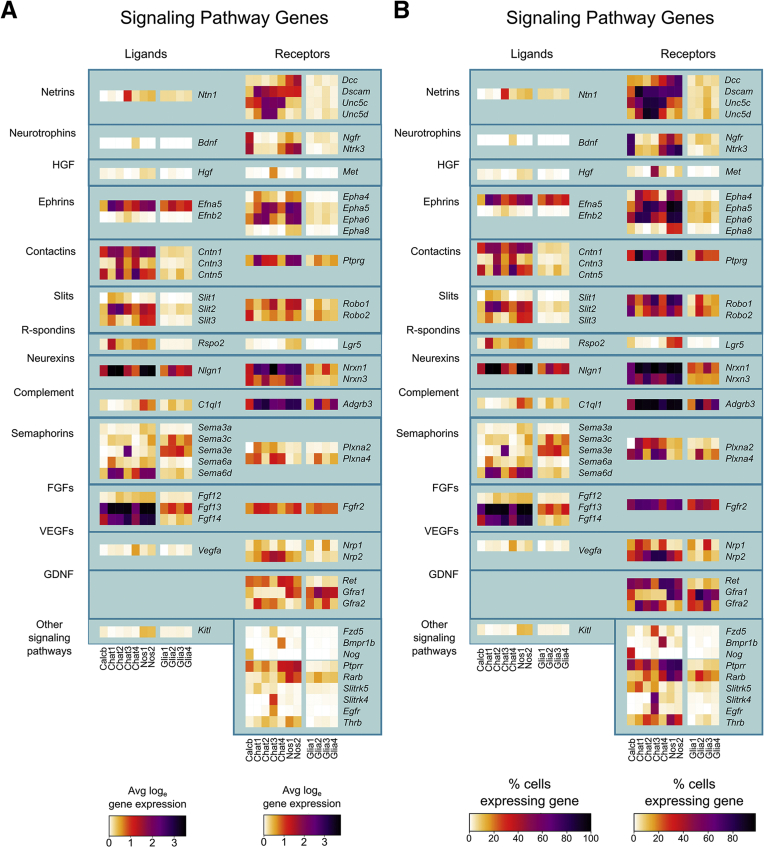
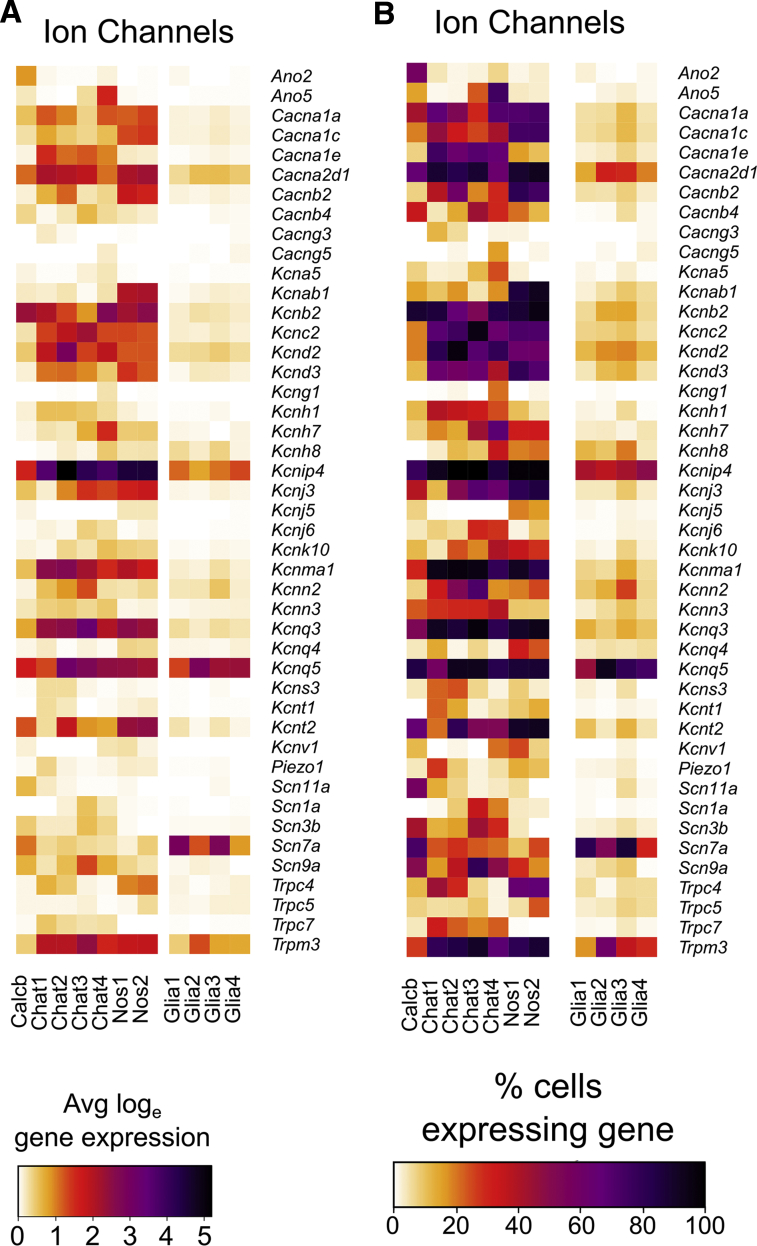
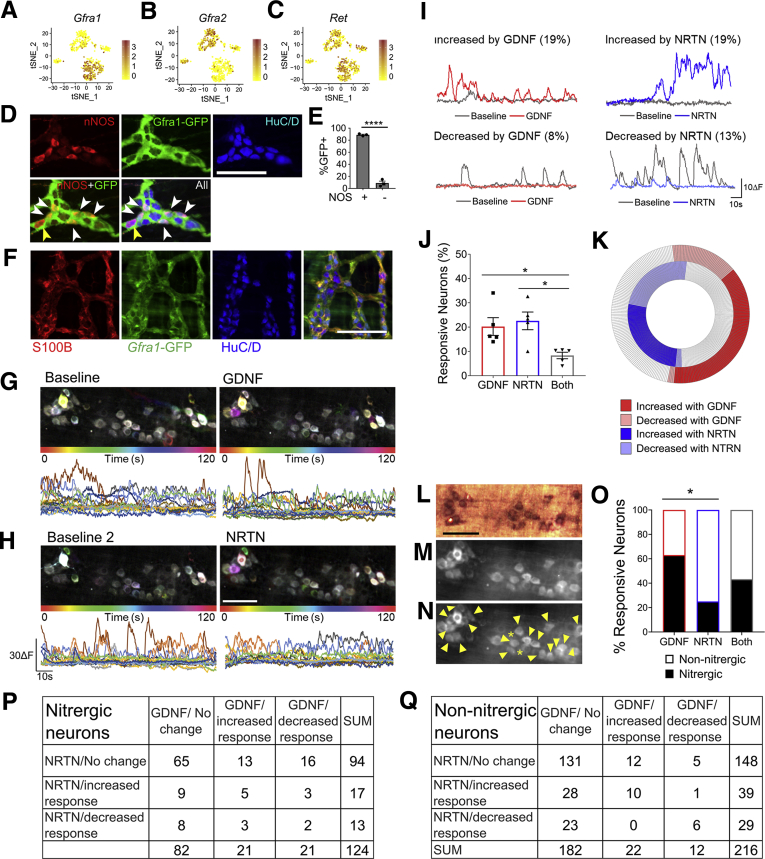
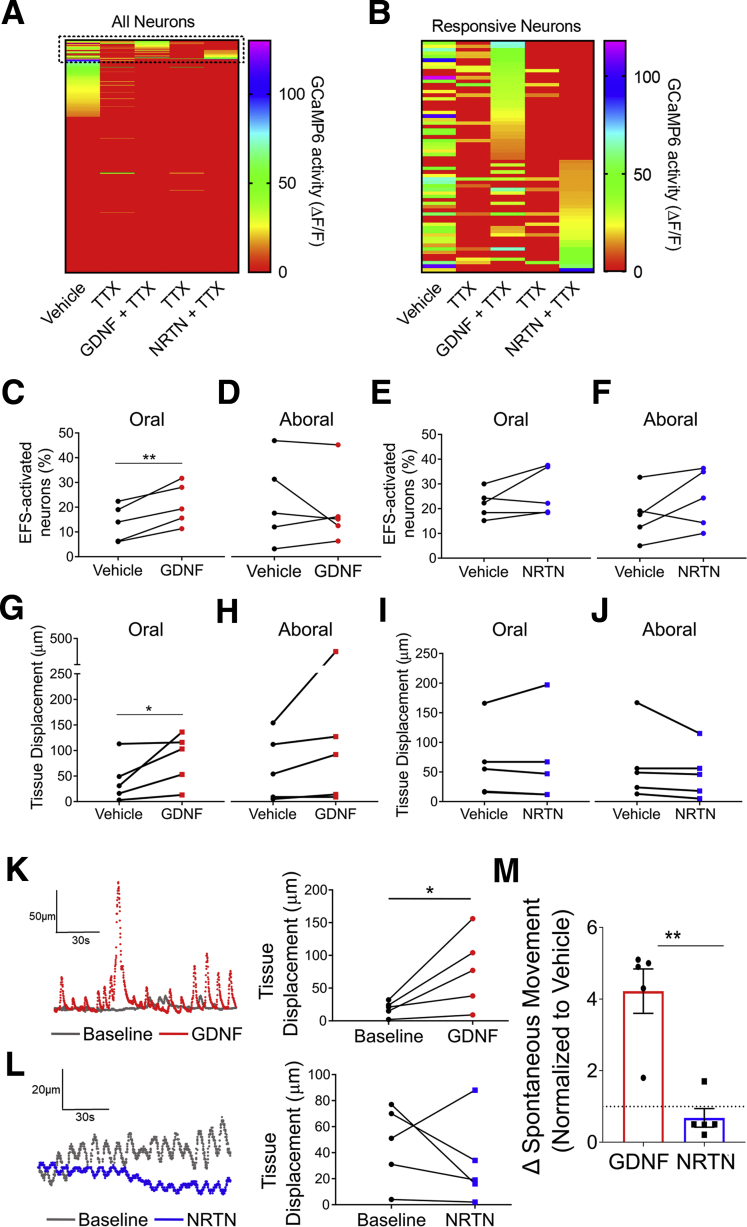
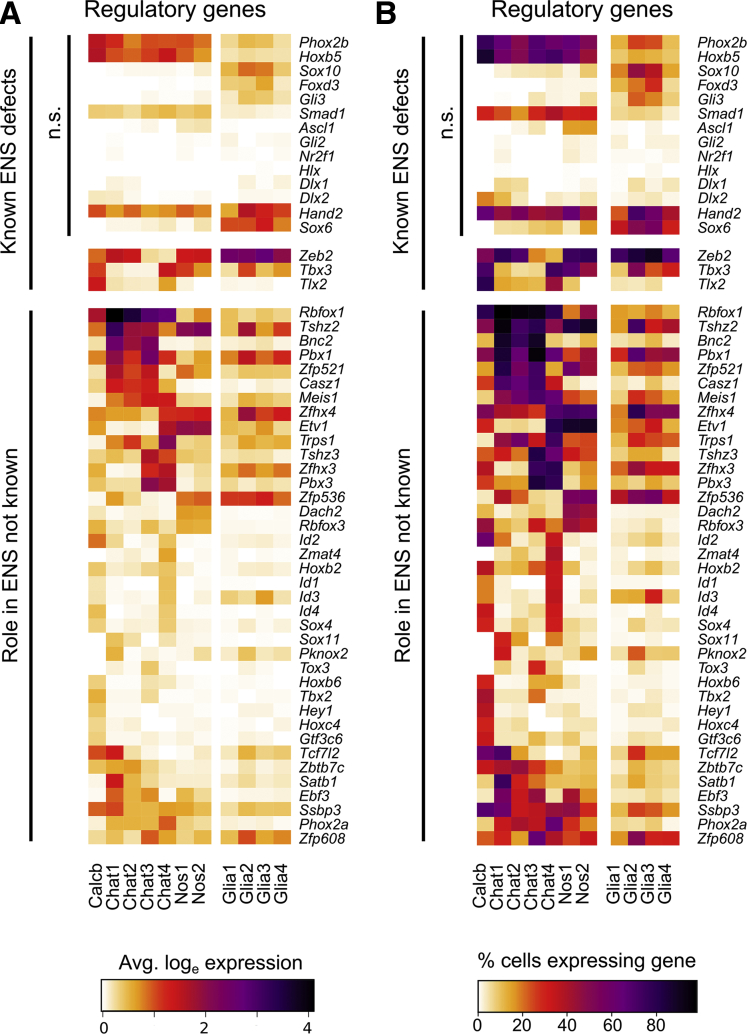
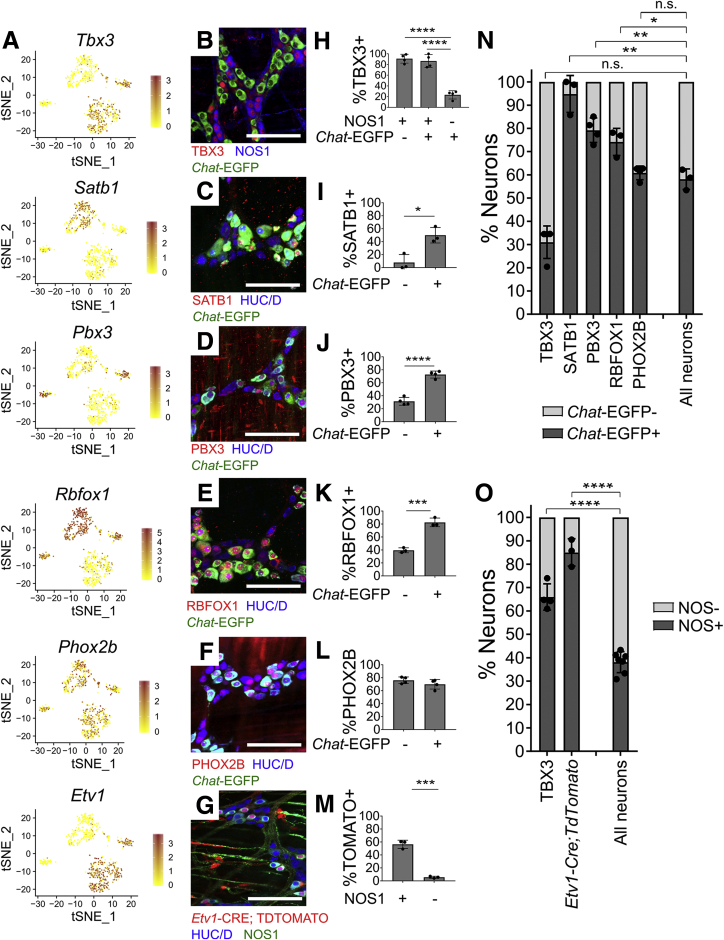
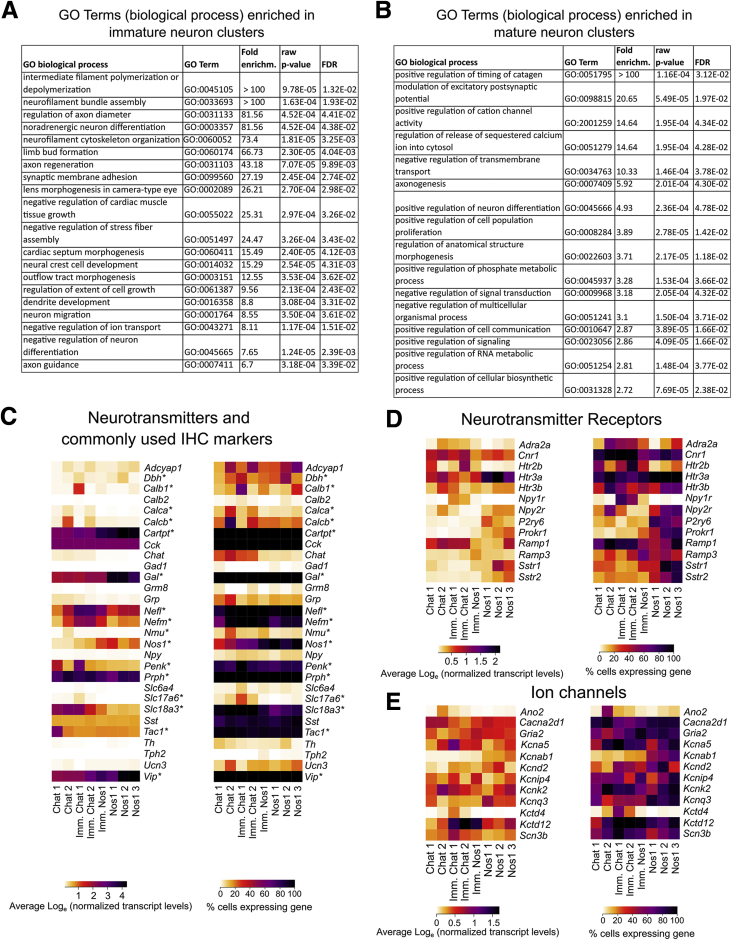
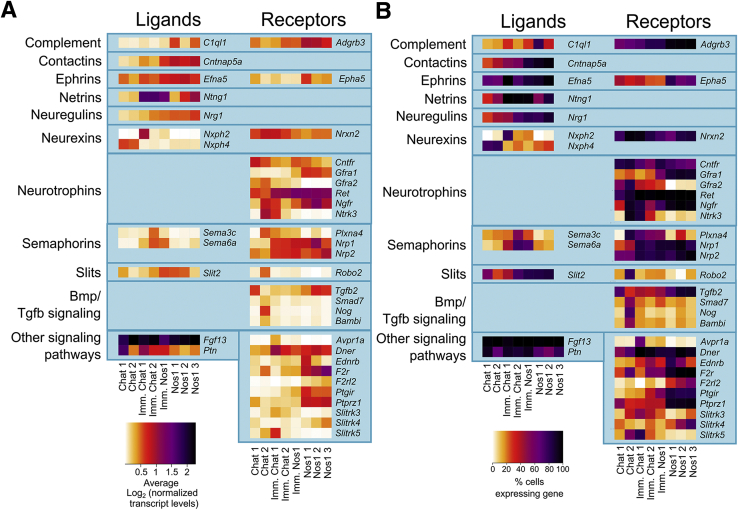
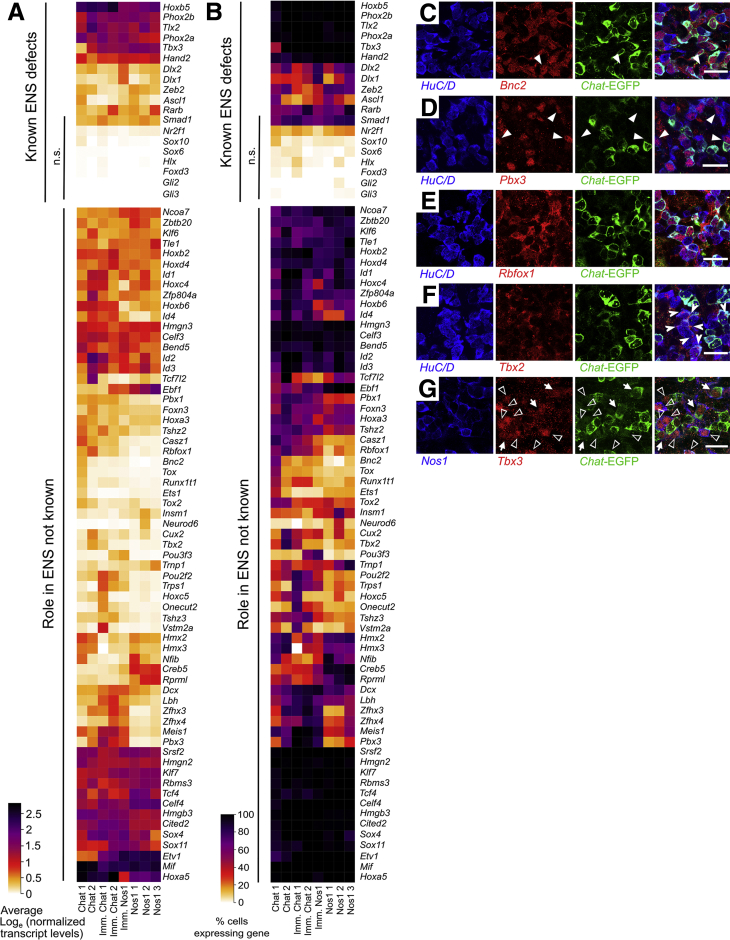
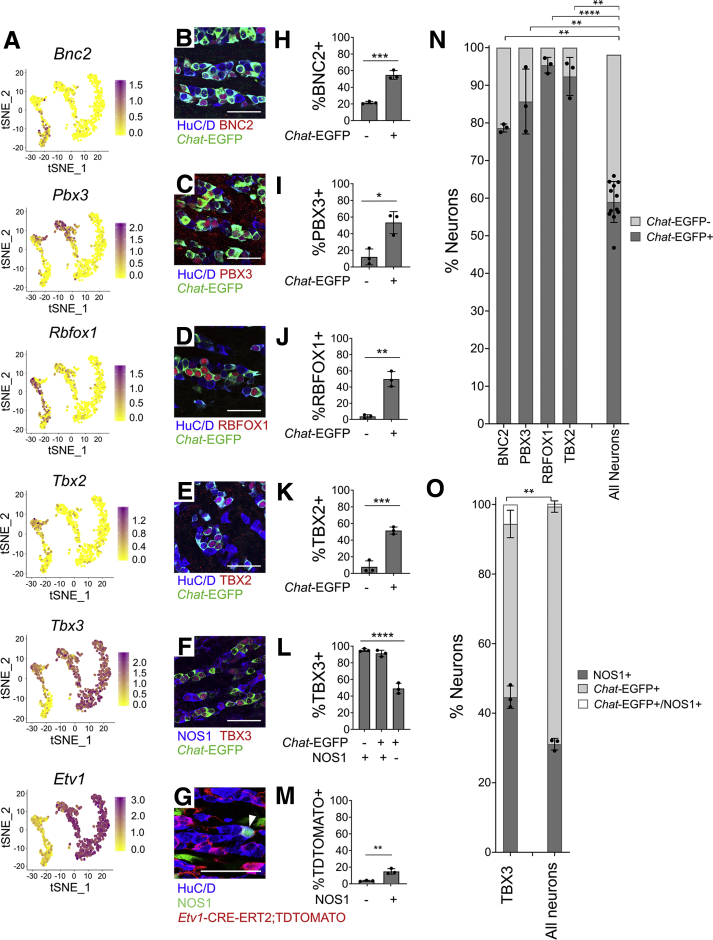
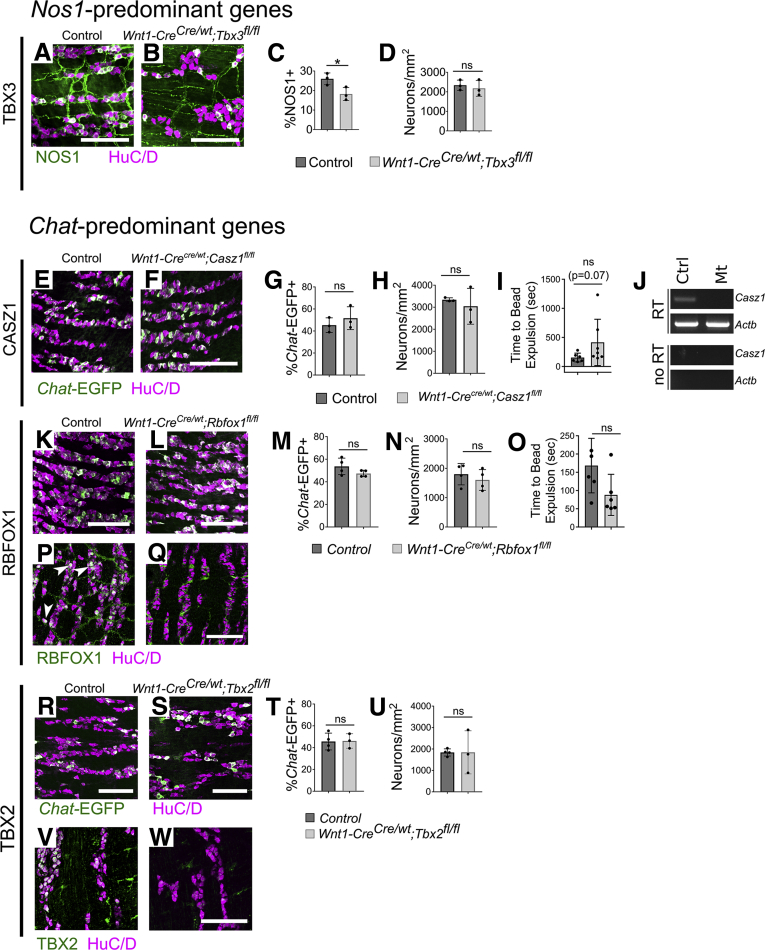
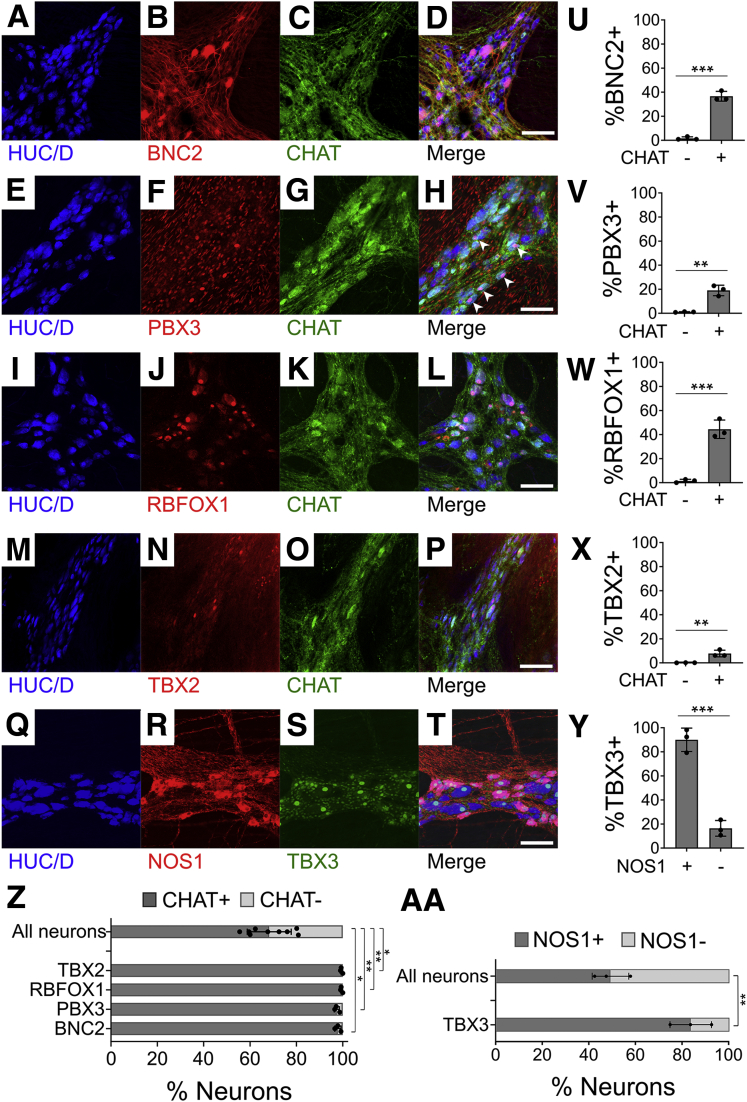
Results: RNA-seq on 635 adult mouse colon myenteric neurons and 707 E17.5 neurons from whole bowel defined seven adult neuron subtypes, eight E17.5 neuron subtypes and hundreds of differentially expressed genes. Manually dissected human colon myenteric plexus yielded RNA-seq data from 48 neurons, 3798 glia, 5568 smooth muscle, 377 interstitial cells of Cajal, and 2153 macrophages. Immunohistochemistry demonstrated differential expression for BNC2, PBX3, SATB1, RBFOX1, TBX2, and TBX3 in enteric neuron subtypes. Conditional Tbx3 loss reduced NOS1-expressing myenteric neurons. Differential Gfra1 and Gfra2 expression coupled with calcium imaging revealed that GDNF and neurturin acutely and differentially regulate activity of ∼50% of myenteric neurons with distinct effects on smooth muscle contractions.

Conclusion: Single cell analyses defined genes differentially expressed in myenteric neuron subtypes and new roles for TBX3, GDNF and NRTN. These data facilitate molecular diagnostic studies and novel therapeutics for bowel motility disorders.

Keywords: Calcium Imaging; Human and Mouse Colon; Pou3f3 (Brn1); Transcription Factors.


Figures

Figure 1
Figure 1
Adult mouse distal colon myenteric plexus RNA-seq defines neuron and glia subtypes. (A–D) H2B-mCherry fluorescence (red) in 50-day-old Wnt1-crecre/wt; R26R-H2B-mCherrych/wt mice colocalizes with HuC/D+ neurons (green) and S100β+ glia (blue) in the ENS. ∼73% of HuC/D+ neurons were H2B-mCherry+. Scale bar = 100 μm. (E) RNA-seq workflow with t-SNE containing all cells. (F) Feature plots for Actg2, Kit, Pdgfrα, Plp1, and Elavl4 indicate the locations of SMC, PDGFRα+ cells, ICC, neurons, and glia, respectively. Color key represents loge(normalized gene expression). (G) Violin plots of neuronal and glial clusters. (H) t-SNE of neuron clusters (I) Feature plots for selected markers highlight neuron subtypes. Color shows loge(normalized gene expression).
Figure 2
Figure 2
Expression patterns of neurotransmitters, neurotransmitter receptors, and common immunohistochemistry (IHC) markers, and validation of ENK and SP coexpression in adult mouse colon. (A) Average expression for neurotransmitters and IHC markers that were differentially expressed between distinct neuron and glial subclasses. (B) Proportion of cells per cluster with expression values >0 for differentially expressed neurotransmitters and IHC markers. (C) Average expression for neurotransmitter receptors and subunits that were differentially expressed between distinct neuron and glial subclasses. (D) Proportion of cells per cluster with expression values >0 for differentially expressed neurotransmitter receptors and subunits. (A, C) Color key represents loge(normalized average gene expression within each cluster). (E–G) ENK (green) colocalizes with SP (red) in myenteric neuron cell bodies in (E) proximal, (F) mid, and (H) distal colon. (H–J) Most myenteric intraganglionic neuron varicosities in (H) proximal, (I) mid, and (J) distal colon express both ENK (green) and SP (red). (K, L) Most enkephalin+ (green) neuron varicosities in circular smooth muscle in (K) mid colon and (L) distal colon also express SP (red), but only a subset of substance P-expressing neuron varicosities in circular smooth muscle express ENK. (E–L) Images representative of n = 3 preparations per colon region and n = 3 images per preparation. (M) Quantification of colocalization of ENK and SP in varicosities within mid colon myenteric ganglia and within circular smooth muscle. (N) EGFP (green) fluorescence signal colocalizes with TDTOMATO+ (red) neurons (blue) in Vglut2-IRES-Cre; R26R-TdTomato; ChAT-EGFP-L10A mice. (O) In a small subset of HuC/D+ neurons (blue), TDTOMATO+ (red) does not colocalize with EGFP fluorescence signal in Vglut2-IRES-Cre; R26R-TdTomato; ChAT-EGFP-L10A mice. (P) Quantification of the colocalization of EGFP fluorescence with TDTOMATO fluorescence in Vglut2-IRES-Cre; R26R-TdTomato mice. (E–G) Scale bar = 10 μm. (H–L) Scale bar = 5 μm. (E–L) White arrows point toward cells and varicosities that express both ENK and SP. (H–L) White arrowheads point toward varicosities that express enkephalin only. Empty arrowheads point toward varicosities that express SP only. (MP) Mean ± SD.
Figure 3
Figure 3
Average expression and percent cells per cluster with detectable levels of differentially expressed signaling pathway molecules in adult distal mouse colon. (A) Average expression for selected ligands (left) and receptors (right) that were differentially expressed between distinct neuron and glial subclasses. Color key represents loge(normalized average gene expression within each cluster). (B) Proportion of cells per cluster with expression values >0 for differential expressed ligands (left) and receptors (right).
Figure 4
Figure 4
Average expression and percent cells per cluster with detectable levels of differentially expressed ion channels in adult distal mouse colon. (A) Average expression of differentially expressed ion channel (subunit) genes for different neuron and glial groups. Color key represents loge(normalized average gene expression within each cluster). (B) Proportion of cells per cluster with expression values >0 for differentially expressed ion channels.
Figure 5
Figure 5
GDNF and NRTN acutely influence GCaMP activity of largely nonoverlapping adult distal colon myenteric neuron populations. (A–C) Feature plots show Gfra1 primarily in Nos1/Vip/Gal neurons (A), Gfra2 in Chat neurons (B), and Ret in almost all neurons except Chat3 (C). (D) Whole mount immunohistochemistry shows GFP (green) in most NOS1+ (red) neurons of Gfra1Gfp/wt distal colon. White arrowheads show GFP+NOS1+ neurons. Yellow arrowhead shows GFP-NOS1+ neuron. (E) Most NOS1+ neurons are GFP+. Most NOS1– neurons are GFP-, consistent with RNA-seq (P < .0001, Student’s t test, n = 3 mice (Gfra1Gfp/wt)). (F) Whole mount immunohistochemistry using Gfra1Gfp/wt distal colon shows colocalization of GFP (green) with S100B+ (red) glia and HuC/D (blue) neurons. Scale bar = 100 μm. (G, H) Time-lapse images (top) (pixels were assigned color based on transients timing; color = activity) and traces (bottom) of GCaMP6s activity from regions of interest on myenteric neurons during baseline (left) and after adding 10 nM GDNF (G) or 10 nM NRTN (H) (right). (I) Sample traces from neurons with activity increased (top) or decreased (bottom) by GDNF (red) or NRTN (blue). Baseline (gray) and percent neurons (in parentheses) with increased or decreased activity (>2 SD change). (J) Percent neurons responding to only GDNF (red), only NRTN (blue), or both (gray) (P < .05, 1-way analysis of variance, Tukey’s multiple comparisons test). (K) Iris plot of GDNF and NRTN responsive myenteric neurons (n = 260 of 523 [49.7%] of total). GDNF is shown in the outer circle (red), NRTN is shown in the inner circle (blue) (n = 5 mice), and gray indicates no ligand-induced activity change. Light shades of red and blue indicate decreased activity after ligand addition. Most responsive neurons are affected by either GDNF or NRTN, not both. (L) NADPH diaphorase stained colon identifies nitric oxide–producing neurons. (M) Corresponding GCaMP6s imaging field. (N) GCaMP6s imaging field shown in M, where yellow arrowheads identify putative nitrergic myenteric neurons and asterisks indicate putative NADPH diaphorase positive neurons with low GCaMP6s signal. (O) Quantification of GDNF- and NRTN-responsive nitrergic neurons (n = 3 fields from separate experiments, P = .0298, Fisher exact test, 2 × 2 contingency table [NOS+/NOS– and GDNF response/NRTN response]). (P, Q) Quantitative data for GCaMP6s imaging fields stained post hoc for NADPH diaphorase, indicating response to GDNF and NRTN. (P) Responsive nitrergic neurons. (Q) Responsive non-nitrergic neurons. (E, J) Mean ± SD. (D, F, G, H) Scale bar = 100 μm. (L–Q) n = 3 fields of view from separate mice. ∗P < .05, ∗∗P < .01, ∗∗∗∗P < .0001.
Figure 6
Figure 6
GDNF modulates activity in some myenteric neurons and enhances colon muscularis movement. (A, B) Heatmaps of GCaMP6s activity before and after adding TTX and during sequential GDNF and NRTN addition. Colors indicate GCaMP6s amplitude (red, no activity). (A) Heatmap of all neurons (n = 803 from 7 fields of view in 3 mice). Dotted box shows GDNF- and NRTN-responsive neurons. (B) Expanded heatmap of 34 neurons that were only GDNF-responsive, 20 neurons only NRTN-responsive, and 12 neurons that responded to both. (C–J) Percent of total observed neurons per GCaMP6s imaging field with increased activity after EFS applied 5 mm (C, E) oral or (D, F) aboral relative to the imaging field at baseline (vehicle) and in the presence of (C, D) GDNF and (E, F) NRTN. (C,) GDNF increases the percent of activated neurons after orally applied EFS (P = .0068, ratio paired t test). (G–J) Tissue displacement (micrometers) after EFS applied 5 mm (G, I) oral or (H, J) aboral relative to the imaging field at baseline (vehicle) and in the presence of (G, H) GDNF and (IJ) NRTN. (G) Tissue displacement is increased in the presence of GDNF after orally applied EFS (P = .0230, ratio paired t test). Sample traces (left) and graph (right) of tissue displacement at baseline and after (K) GDNF (P = .0022, ratio paired t test) or (L) NRTN (P = .1583, ratio paired t test). (M) GDNF, but not NRTN, enhanced tissue movement (P < .01, unpaired t test). (M) Mean ± SD. ∗P < .05, ∗∗P < .01, ∗∗∗∗P < .0001.
Figure 7
Figure 7
Average expression and percent cells per cluster with detectable levels of differentially expressed transcription and splicing factors in adult distal mouse colon. (A) Transcription and splicing factors with known roles in ENS development (top), and newly identified differentially expressed factors (bottom). (B) Proportion of cells per cluster with expression values >0 for transcription and splicing factors with known roles in ENS development (top), and regulatory genes (transcription factors and splicing factors) newly identified in the ENS in this study (bottom). n.s., not significantly differentially expressed between neuron clusters.
Figure 8
Figure 8
Regulatory genes are expressed in distinct adult ENS subsets. (A) Feature plots of select regulatory genes. Color key shows loge(normalized gene expression). (B–F) Myenteric plexus wholemount immunohistochemistry in young adult ChAT-EGFP-L10A distal colon. (G) Whole mount myenteric plexus immunohistochemistry in distal colon from tamoxifen-treated Etv1-CreErt2;R26R-TdTomato mice. TDTOMATO is in many NOS1+ neurons and some non-neuronal cells with ICC morphology. (H–L) Immunohistochemistry quantification. TBX3 is found mostly in (H) nitrergic (NOS1+) neurons (P < .0001, n = 3). (I) SATB1 (P = .013, n = 3), (J) PBX3 (P < .0001, n = 3), and (K) RBFOX1 (P = .0006, n = 3) are mostly in cholinergic (EGFP+) neurons, consistent with single-cell RNA data. (L) PHOX2B is equally abundant in Chat-EGFP+ and Chat-EGFP–cells (P = .2193, n = 4). (M) Quantification of G shows that 56.4 ± 3.6% of NOS1+ neurons are TDTOMATO+. Only 5.6 ± 0.9% of NOS1– neurons are TDTOMATO+ (P = .0002, n = 3). (N) Cholinergic (Chat-EGFP+) and (O) nitrergic (NOS1+) identity for cells expressing select factors. SATB1 (P = .0022), PBX3 (P = .0026), and RBFOX1 (P = .019) are largely restricted to cholinergic (Chat-GFP+) neurons. PHOX2B is present in both cholinergic and noncholinergic neurons (P = .370) (P values compare Transcription factor+EGFP+/Transcription factor+ vs EGFP+/Total neuron ratios). TBX3 (P < .0001) and ETV1 (P < .0001) are primarily in nitrergic (NOS1+) neurons (P values compare Transcription factor+NOS1+/Transcription factor+ vs NOS1+/Total neuron ratios). (I–O) Student’s t test. (H) Analysis of variance with Tukey’s post hoc test. Scale bar = 100 μm. ChAT-EGFP-L10A = Chat-EGFP. ∗P < .05, ∗∗P < .01, ∗∗∗P < .001, ∗∗∗∗P < .0001.
Figure 9
Figure 9
Single-cell RNA-seq of E17.5 ChAT-EGFP-L10A+ and Nos1-CreERT2Cre/wt;R26R-TdTomato+ neurons show distinct nitrergic and cholinergic clusters. (A) RNA-seq workflow with t-SNE plot of all cell groups isolated from E17.5 bowel. (B) ChAT-EGP (green) and NOS1 (red) do not overlap at E17.5. Scale bar = 50 μm. (C) NOS1 (green) and nNOS-Cre-ERT2;R26R-tdTomato (red) overlap. (D) Feature plots of Acta2 as smooth muscle marker, Epcam as an intestinal epithelial marker, and Elavl4 as a pan-neuronal marker. Color key represents loge(normalized gene expression). (E) After removing the epithelial and smooth muscle cells from the dataset and reclustering, t-SNE plot reveals multiple neuron subpopulations. (F) Violin plots show subgroups had 25,319.7 ± 5562.2 unique RNA transcripts (UMIs) and 5291.6 ± 558.8 detected genes (nGenes) per cell. (G) Expression of Nos1 and the cholinergic marker Slc18a3/VachT verifies the presence of the expected cholinergic and nitergic neuronal subpopulations. Chat expression was low throughout, but overlapped with Slc18a3 expression. Color key represents loge(normalized gene expression). (H) All neurons have high expression of pan-neuronal markers Tubb3 and Elavl4. There is minimal contamination with glial cells based on the expression of enteric glial marker Plp1. Sox10, which marks enteric glia and enteric neural crest precursors was also low. Ret, which is expressed in ENS precursors and many neurons, was present in all clusters, and all neurons still express the immature pan-neuronal marker Dcx. This suggests that these cells are lineage-restricted immature neurons.
Figure 10
Figure 10
GO term analysis of differentially expressed genes in E17.5 bowel shows more immature and mature neuron clusters, with unique combinations of neurotransmitters, receptors, and ion channels. (A) GO term analysis of differentially expressed genes in the 3 more immature neuron clusters (immature Chat cluster 1, immature Chat cluster 2, immature Nos1 cluster) compared with all other clusters indicates that these neurons are actively involved in cytoskeletal reorganization and neurite extension. (B) GO term analysis of differentially expressed genes in the 5 more mature neuron clusters (Chat cluster 1, Chat cluster 2, Nos1 cluster 1, Nos1 cluster 2, and Nos1 cluster 3) compared with the immature clusters (immature Chat cluster 1, immature Chat cluster 2, and immature Nos1 cluster) indicates that these neurons are actively involved in synapse formation. (C–E) Average expression (left) and proportion of cells per cluster (right) with expression values >0 (right) for neurotransmitters and commonly used (C) immunohistochemistry markers, (D) neurotransmitter receptors, and (E) ion channels for different 17.5 groups. Color key for left panels represents loge(normalized average gene expression within each cluster). (C) Asterisk indicates differential expression across neuron subtypes. (D, E) Genes listed are differentially expressed across subtypes. imm, immature.
Figure 11
Figure 11
Average expression and percent cells per cluster with detectable levels of differentially expressed signaling pathway molecules in E17.5 mouse bowel. (A) Average expression of differentially expressed signaling pathway genes for distinct neuron clusters. Color key represents loge(normalized average gene expression within each cluster). (B) Proportion of cells per cluster with expression values >0 for differentially expressed signaling pathway molecules.
Figure 12
Figure 12
Differentially expressed transcription and splicing factors in E17.5 mouse bowel. (A) Transcription and splicing factors with known roles in ENS development (top), and newly identified differentially expressed factors (bottom). (B) Proportion of cells per cluster with expression values >0 for transcription and splicing factors with known roles in ENS development (top), and regulatory genes (transcription factors and splicing factors) newly identified in the ENS in this study (bottom). (C–G) Whole mount immunohistochemistry of select regulatory genes in E17.5 ChAT-EGFP-L10A reporter mouse mid colon shows gene localization in neuron subsets. (C) BNC2, (D) PBX3, and (E) RBFOX1 are predominantly expressed in cholinergic (EGFP+) neurons. (C, D) White arrowheads indicate neurons that express the regulatory gene in question but are not cholinergic. (F) TBX2 does not have nuclear or diffuse cytoplasmic staining in the E17.5 colon. Instead, TBX2 immunoreactive cytoplasmic aggregates were detected in a subset of cholinergic (EGFP+) neurons (notched white arrowheads). (G) TBX3 is expressed in some cholinergic (EGFP+, white arrows) and most nitrergic (NOS1+, empty arrowheads) neurons. (C–G) ChAT-EGFP-L10A reporter = Chat-EGFP. Scale bar = 20 μm (C–G). n.s., not significantly differentially expressed between neuron clusters.
Figure 13
Figure 13
E17.5 data show many regulatory genes are differentially expressed in patterns resembling adult colon myenteric plexus. (A) Feature plots. Colors show loge (normalized gene expression). (B–F) Whole mount immunohistochemistry of E17.5 ChAT-EGFP-L10A mid small intestine. (G) Whole mount myenteric plexus immunohistochemistry of E17.5 mid small intestine from tamoxifen-treated Etv1-CreErt2;R26R-TdTomato mice. TDTOMATO is expressed in many NOS1– neurons and some NOS1+ neurons. White arrowhead points to a NOS1+TDTOMATO+ neuron. Scale bar = 50 μm. (H–L) Immunohistochemistry quantification. (H) BNC2 (P = .0005, n = 3), (I) PBX3 (P = .0119, n = 3), (J) RBFOX1 (P = .0012, n = 3), and (K) TBX2 (P < .001, n = 3) are primarily in cholinergic (Chat-GFP+) neurons. (L) TBX3 (P < .0001, n = 3, analysis of variance with Tukey’s post hoc test) is primarily in NOS1+ neurons. (M) Quantification of G shows preferential TDTOMATO expression in NOS1+ neurons (P = .0042, n = 3). Quantification of (N) cholinergic (Chat-EGFP+) and (O) nitrergic (NOS1+) identity. Neurons expressing BNC2 (P = .0018), PBX3 (P = .0165), RBFOX1 (P < .0001), and TBX2 (P = .0016) are primarily cholinergic (Chat-GFP+) (P values compare Transcription factor+EGFP+/Transcription factor+ vs EGFP+/Total neuron ratios). TBX3+ neurons (P = .003) are primarily nitrergic (P values compare Transcription factor+NOS1+/Transcription factor+ vs NOS1+/Total neuron ratios). (H–L) Mean ± SD. (B–O) ChAT-EGFP-L10A reporter=Chat-EGFP. (H–K, MO) Student’s t test. (L) Analysis of variance with Tukey’s post hoc test. ∗P < .05, ∗∗P < .01, ∗∗∗P < .001, ∗∗∗∗P < .0001.
Figure 14
Figure 14
Tbx3 loss reduces NOS1+ myenteric neurons. Casz1, Rbfox1, and Tbx2 mutants had normal abundance of Chat-EGFP+ neurons and Casz1 and Rbfox1 had normal colon bead expulsion. (A, B) Confocal maximum intensity projections of P0 Tbx3 mutant and control small bowel myenteric plexus revealed a (C, D) 30% reduction in NOS1+/Total neuron ratio in (C) Wnt1-CreCre/wt;Tbx3fl/fl P0 small bowel (P = .041, n = 3 per group) despite (D) normal total neuron density (P = .601, n = 3 per group). (E) P0 small bowel myenteric plexus of control and (F) Wnt1-CreCre/wt;Casz1fl/fl mice also carrying the Chat-EGFP-L10A reporter. (G) Quantification shows normal Chat-EGFP+/Total neuron ratios (P = .424, n = 3 in each group) and normal neuron density (H; P = .700, n = 3 in each group) in Casz1 mutant P0 small bowel. (I) Colonic bead expulsion latency is normal in Wnt1-CreCre/wt;Casz1fl/fl mice (P = .073, n = 6 [control, male = 2/female = 4, P44–70 at start of assay], n = 7 [Wnt1-CreCre/wt;Casz1fl/fl, male = 2/female = 5, P42–50 at start of assay]). (J) RT-PCR of TDTOMATO+ cells from Wnt1-CreCre/wt;Casz1fl/fl;TdTomato+ mice lacks the Casz1 band, consistent with loss of Casz1 expression. Single confocal planes from P0 small bowel of (K) control and (L) Wnt1-CreCre/wt;Rbfox1fl/fl bred to Chat-EGFP-L10A. (M, N) Quantification shows that proportion of EGFP+ neurons (P = .162, n = 4 per group) and total neuron density (P = .470, n = 4 per group) are normal in Rbfox1 mutants. (O) Colon bead expulsion latency is normal in Wnt1-CreCre/wt;Rbfox1fl/fl mice (P = .2677, n = 5 [control, male = 2/female = 3, P44–46 at start of assay], n = 6 [Wnt1-CreCre/wt;Rbfox1fl/fl, male = 2/female = 4, P46–58 at start of assay]). (P, Q) Control mice at P0 showed robust RBFOX1 immunofluorescence in neuronal nuclei (white/green, examples shown with white arrowheads), whereas Wnt1-CreCre/wt;Rbfox1fl/fl had no neuronal nuclear RBFOX1 immunofluorescence. (R, S) Single confocal planes from P0 small bowel myenteric plexus from control and Wnt1-CreCre/wt;Tbx2fl/fl bred to Chat-EGFP-L10A. (T, U) Quantification shows that proportion of EGFP+ neurons (P = .926, n = 4 [control] and n = 3 [Wnt1-CreCre/wt;Tbx2fl/fl]) and total neuron density (P = .857, n = 4 [control] and n = 3 [Wnt1-CreCre/wt;Tbx2fl/fl]) are normal in Tbx2 mutants. (V, W) Control mice at P0 showed robust TBX2 immunofluorescence in neuronal nuclei (white/green), whereas Wnt1-CreCre/wt;Tbx2fl/fl had no neuronal nuclear TBX2 immunofluorescence. (C, D, G–I, M, O, T, U) Mean ± SD. (C, D, G, H, M, N, T) Student’s t test. (I, O, U) Mann-Whitney. (A, B, E, F, K, L, PS, V, W) Scale bar = 100 μm. ChAT-EGFP-L10A=Chat-EGFP. ∗P < .05. Ctrl, control; Mt, Wnt1-CreCre/wt;Casz1fl/fl;TdTomato+.
Figure 15
Figure 15
Pou3f3 is expressed in mouse colon ENS but not small intestine ENS. In adult humans, nuclear POU3F3 immunoreactivity was also restricted to colon enteric neurons. (A) Feature plot shows scattered E17.5 enteric neurons expressing Pou3f3 throughout the neuron clusters. Color key represents loge(normalized gene expression). (B) Violin plot of Pou3f3 expression in E17.5 enteric neurons indicates that Pou3f3 is predominantly expressed in Immature Chat cluster 2 and Immature Nos1 cluster. (C–Z) Whole mount immunohistochemistry confirms that POU3F3 immunoreactivity (green) is not detected in small bowel enteric neurons at (C) E12.5, (E) at E14.5, (H–N) at E17.5, or (O–Z) in adulthood. POU3F3 immunoreactivity is easily detected in (D) proximal colon at E12.5 (arrows) and throughout the colon (F) at E14.5, (H, M) at E17.5, and (S, Y) in adulthood. (N, T, Z) At E17.5 and in adulthood, colonic POU3F3 co-localizes with the enteric neuron marker HuC/D. Confocal z-stack maximum intensity projections at (AA–AL) lower magnification and (AM–AX) high magnification of whole mount immunohistochemistry for POU3F3 in (AA–AC, AG–AI, AM–AO, AS–AU) adult human small intestine and (AD–AF, AJ–AL, AP–AR, AV–AX) adult human colon shows nuclear POU3F3 localization only in colonic neurons. (AA–AC, AM–AO) No POU3F3 staining was detectable in human small intestine submucosal plexus, whereas (AD–AF, AP–AR) clear nuclear POU3F3 staining could be seen in human colon submucosal neurons. (AG–AI, AS–AU) Cytoplasmic POU3F3 antibody staining was present in a subpopulation of human small intestine myenteric neurons. (AJ–AL, AV–AX) In the human colon myenteric plexus, all neurons showed clear nuclear POU3F3 localization. (AY) Representative RT-PCR for flow sorted TDTOMATO+ ENS cells from Wnt1-Cre;R26R-TdTomato mice confirms Pou3f3 in fetal colon but not small intestine (SI). (AZ) Feature plot showing scattered E17.5 enteric colonic neurons. Cells expressing Pou3f3 were assigned colonic identity. Red circle marks immature clusters: immature Chat cluster 1, immature Chat cluster 2, and immature Nos1 cluster. (BA) Genes differentially expressed by cells assigned colon identity compared with cells assigned small intestine identity within the 3 immature clusters (immature Chat cluster 1, immature Chat cluster 2, immature Nos1 cluster). (BB) Genes differentially expressed by cells assigned colon identity compared with cells assigned small intestine identity within the 3 mature clusters (Chat cluster 1 and 2 and Nos1 cluster 1, 2, and 3). (BC) Violin plots showing expression of the differentially expressed genes across all E17.5 neuron clusters indicate that the genes identified in BA are specific to immature Chat cluster 1 and not colon or small intestine (Pearson correlation between the expression of the identified gene and Pou3f3 supports this conclusion: P > .1 for all, except Dpysl3; correlation coefficient = 0.0819, P = .0294). (BD) Violin plots showing expression of the differentially expressed genes across all E17.5 neuron clusters suggest that the expression of genes Ahr and Pantr1 and possibly Zfhx3 are specific to colon myenteric neurons (Pearson correlation between the expression of the identified gene and Pou3f3 supports this conclusion: Ahr, correlation coefficient = 0.3581, P < 2.2 × 10-6; Pantr1, correlation coefficient = 0.5640, P < 2.2 × 10-6; Zfhx3, correlation coefficient = 0.4034, P < 2.2 × 10-6). Images are representative of 3 independent biological replicates. Scale bar = 100 μm (C, E–AL), 200 μm (D), 20 μm (AM–AX) 500 μm (G), 1 mm (H). ChAT-EGFP-L10A=Chat-EGFP. MP, myenteric plexus; SP, submucosal plexus,
Figure 16
Figure 16
Human single-nucleus RNA-seq analysis from 20,167 cells yielded data from many cells that impact bowel motility including SMC, ICC, PDGFRA+ cells, muscularis macrophage, and glia. (A) Human myenteric plexus after incubation with 4-Di-2-Asp (4-(4-(dimethylamino)styryl)-N-methylpyridinium iodide), with muscle layers partially peeled away. Scale bar = 50 μm. (B) RNA-seq workflow for adult human colon myenteric plexus. (C) t-SNE plot of 20,167 nuclei shows glia, ICC, muscularis macrophages, PDGFRA+ cells, smooth muscle, T cells, endothelium, and unknown groups. Neurons comprise 1 small cluster (∼48 cells). (D–L) Feature plots showing genes expressed highly in (D, E) adult human smooth muscle (ACTG2, MYH11), (F) vessel endothelial cells (VWF), (G, H) glial cells (PLP1, SOX10), (I) ICC (ANO1), (J) PDGFRA+ cells (PDGFRA), (K) muscularis macrophages (CD14), and (L) T cells (CD2). Color key represents loge(normalized gene expression).
Figure 17
Figure 17
Human single-nucleus RNA-seq analysis showed minimal batch effects and yielded data from 48 definitive neurons. (A–C) t-SNE plots of human nuclei colored by (A) sample number, (B) colon location (right vs sigmoid), and (C) sex. Cells from different colon regions and different sexes largely form the same t-SNE clusters. (D–F) Feature plots show location of (D) ELAVL4, (E) UCHL1, and (F) SNAP25 expression suggest that a small population of neurons expressing all 3 is present in this dataset, but most of the 20,000 nuclei are not ELAVL4, SNAP25, or UCHL1-positive. Color key represents loge(normalized gene expression).
Figure 18
Figure 18
Human myenteric plexus NOS1/VIP/GAL+ and NOS1/VIP/GAL– neurons differentially express many regulatory genes also differentially expressed in mouse ENS. (A) t-SNE plot of all human nuclei expressing ELAVL4, UCHL1, or SNAP25 reveals many populations that may be doublets because they cluster with nuclei expressing non-neuronal cell markers. For this paper, we only describe in detail expression data for the tight cluster of cells we believe are single neurons based on high expression of ELAVL4, SNAP25, UCHL1, SYT1, and DSCAM (highlighted with red circle). (B) Feature plots of neuronal markers (ELAVL4, SNAP25, UCHL1, SYT1, and DSCAM), SMC markers (ACTG2), glial cell markers (PLP1), ICC markers (KIT), and PDGFRA+ cell markers (PDGFRA) suggest that other populations are not neurons. Color key represents loge(normalized gene expression). (C) Heatmap shows 50 genes with the highest fold difference between neurons and other cells. Hierarchical clustering suggests 2 subgroups: NOS1+/VIP+/GAL+ (17 neurons) and NOS1–/VIP-/GAL– (31 neurons). (D) Heatmap shows transcription and splicing factors differentially expressed in mouse colon that were in >10% of human myenteric neurons. RBFOX1, ETV1, and BNC2 were differentially expressed between NOS1/VIP/GAL+ and NOS1/VIP/GAL– human neurons (Wilcoxon rank sum test, Bonferroni correction).
Figure 19
Figure 19
Immunohistochemistry of human colon myenteric plexus shows preferential expression of select transcription factors in CHAT+ and NOS+ neuron subtypes. (A–T) Maximum intensity projections of adult human colonic ENS confocal Z-stacks: (A–D) BNC2, (E–H) PBX3 (white arrowheads indicate nuclear PBX3 in neurons), (I–L) RBFOX1, (M–P) TBX2, and (Q–T) TBX3 are present in subsets of human myenteric neurons. (UY) Immunohistochemistry quantification: (U) BNC2 (P = .0001, n = 3), (V) PBX3 (P = .0021, n = 3), (W) RBFOX1 (P = .0007, n = 3), and (X) TBX2 (P = .0089, n = 3) are primarily in CHAT+ neurons. (Y) TBX3 (P = .0004, n = 3) is primarily in NOS1+ neurons. Quantification of (Z) CHAT+ and (AA) NOS1+ reveals that BNC2 (P = .0102), PBX3 (P = .0021), RBFOX1 (P = .0016), and TBX2 (P = .0162) are largely restricted to CHAT+ neurons in adult human ENS (P values compare Transcription factor+EGFP+/Transcription factor+ vs EGFP+/Total neuron ratios). TBX3 (P = .0073) is primarily in NOS1+ neurons (P values compare Transcription factor+NOS1+/Transcription factor+ vs NOS1+/Total neuron ratios). (U–AA) Mean ± SD and Student’s t test. ∗P < .05, ∗∗P < .01, ∗∗∗P < .001. Scale bar = 100 μm.

Similar articles

Cited by

References

    1. Schneider S., Wright C.M., Heuckeroth R.O. Unexpected roles for the second brain: enteric nervous system as master regulator of bowel function. Annual Review of Physiology. 2019;81:235–259. - PubMed
    1. McCann C.J., Thapar N. Enteric neural stem cell therapies for enteric neuropathies. Neurogastroenterol Motil. 2018;30:e13369. - PubMed
    1. Soret R., Schneider S., Bernas G., Christophers B., Souchkova O., Charrier B., Righini-Grunder F., Aspirot A., Landry M., Kembel S.W., Faure C., Heuckeroth R.O., Pilon N. Glial cell derived neurotrophic factor induces enteric neurogenesis and improves colon structure and function in mouse models of Hirschsprung disease. Gastroenterology. 2020;159:1824–1838.e7. - PubMed
    1. Memic F., Knoflach V., Morarach K., Sadler R., Laranjeira C., Hjerling-Leffler J., Sundström E., Pachnis V., Marklund U. Transcription and signaling regulators in developing neuronal subtypes of mouse and human enteric nervous system. Gastroenterology. 2018;154:624–636. - PMC - PubMed
    1. Morarach K., Mikhailova A., Knoflach V., Memic F., Kumar R., Li W., Ernfors P., Marklund U. Diversification of molecularly defined myenteric neuron classes revealed by single-cell RNA sequencing. Nat Neurosci. 2021;24:34–46. - PMC - PubMed

Publication types

MeSH terms