. 2021 Mar:34:100428.
doi: 10.1016/j.epidem.2020.100428. Epub 2020 Dec 15.

To quarantine, or not to quarantine: A theoretical framework for disease control via contact tracing

Affiliations

To quarantine, or not to quarantine: A theoretical framework for disease control via contact tracing

Davin Lunz et al. Epidemics. 2021 Mar.

Abstract

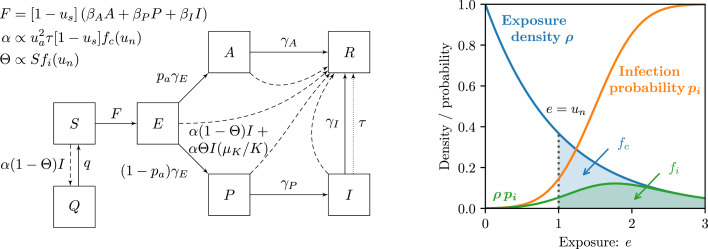
Contact tracing via smartphone applications is expected to be of major importance for maintaining control of the COVID-19 pandemic. However, viable deployment demands a minimal quarantine burden on the general public. That is, consideration must be given to unnecessary quarantining imposed by a contact tracing policy. Previous studies have modeled the role of contact tracing, but have not addressed how to balance these two competing needs. We propose a modeling framework that captures contact heterogeneity. This allows contact prioritization: contacts are only notified if they were acutely exposed to individuals who eventually tested positive. The framework thus allows us to address the delicate balance of preventing disease spread while minimizing the social and economic burdens of quarantine. This optimal contact tracing strategy is studied as a function of limitations in testing resources, partial technology adoption, and other intervention methods such as social distancing and lockdown measures. The framework is globally applicable, as the distribution describing contact heterogeneity is directly adaptable to any digital tracing implementation.

Keywords: Asymptotic analysis; Basic reproduction number; Contact tracing; Epidemiological modeling.


Conflict of interest statement

The authors declare that they have no known competing financial interests or personal relationships that could have appeared to influence the work reported in this paper.

Figures

Fig. 1
Fig. 1
Disease dynamics and contact tracing framework.(left) Upon infection, susceptible individuals (S) enter a latent exposed stage (E) when the disease incubates before infectiousness. Upon becoming infectious, a proportion pa of the population remain asymptomatic (A), while the remainder pass through a presymptomatic stage (P) before becoming symptomatic (I). Infectious individuals are removed (R) through recovery/isolation (rates γA and γI), isolation after testing (dotted arrow, rate τ), or quarantining as a consequence of contact tracing (dashed arrows, rate α(1Θ)I+αΘI(μKK) for K{E,A,P,I}). The total contact tracing rate α depends on the proportion of the population who adopt the contact tracing ua, the testing rate τ, the factor (1us(t)), representing the reduction of transmission rates due to social intervention measures and the notification threshold, un, representing the minimal exposure required to notify traced contacts. Removal via contact tracing is partitioned into the fraction of contacts who were infected by the tested case Θ, and those who were not (1Θ), where Θ represents the tracing precision and depends on the susceptible proportion S and the notification threshold un. Contact tracing also causes quarantine of susceptible individuals (Q) that had non-infectious contact with an infected case (dashed arrow at rate α(1Θ)I, return rate q). The force of infection, F depends on transmission rates βK and infection densities, and social intervention measures. (right) Contact heterogeneity is incorporated via a distribution of exposure levels: contact are encountered at exposure e with density ρ(e) and result in infection with probability pi(e). The notification threshold (illustrated for un=1) affects the contact tracing rate and precision via the integral fc (blue and green shaded region) expressing the fraction of contacts notified, and the integral fi (green shaded region), which captures the proportion of contacts who had infectious contact with the tested case. (Color version online.)
Fig. 2
Fig. 2
Flattening the curve. (left) Early-phase disease outcomes as a function of the maximum testing capacity τ. Colored curves correspond to an adoption fraction ua{0,0.2,0.3,0.4,0.5} and show the time t for 0.1% of the population to have been infected. Black dashed lines are asymptotic approximations (detailed in Supplementary Materials Section S2 B). Increasing testing capacity and the adoption fraction decelerates the initial disease outbreak. (right) Long-term disease dynamics for ua=0.4. Colored curves correspond to τ{1,2,5,10,20}×104 and show the total fraction of infected individuals E+A+P+I. If present, markers along the curves (of corresponding color) show the time when the testing capacity saturates (smaller t) and desaturates (larger t). Increased testing capacity delays testing saturation, leading to smaller peak infection proportions. [inset] Susceptible proportion S corresponding to the same simulation as the main plot. As testing desaturates the susceptible proportion rises. This is a result of a large number of healthy quarantined individuals Q returning to the susceptible pool.
Fig. 3
Fig. 3
Conditions for outbreak prevention viaR0analysis. (left) Basic reproduction number R0 for S=1 and un=0 as a function of adoption fraction ua and social interventions us. The dashed curve shows the R0=1 level set, which is the intervention threshold separating an outbreak from no outbreak. Increasing social intervention us or contact tracing adoption ua increases disease control. (right) Intervention thresholds for S{1,0.925,0.85,0.775,0.7} and un=0. Dotted curves show the level sets R0|S=1S=1 and correspond to neglecting the dependence of the contact tracing efficiency on S. Previous contact tracing descriptions do not account for the susceptible proportion of the population, and thus underestimate the necessary disease control.
Fig. 4
Fig. 4
To quarantine or not to quarantine. (left) Quarantine cost 0TQdt as a function of notification threshold un, for ua=0.5, us=0.35, and T{1,1.5,2,3,4} years. The notification threshold axis is mapped from the interval [0,un] to [1,] so as to spread out the region near criticality unun to illustrate the minimum cost (with un denoting the notification threshold for which R0=1). Each marked un value corresponds to an identical mark in the inset. As un increases from un=0 to the value at which the minimum is obtained, the quarantine cost improves by nearly two orders of magnitude while there is little variation in R0. Black dashed curves show the asymptotic approximation derived in Supplementary Materials Section S2 B. [inset] Basic reproduction number R0 for us=0.35 as a function of ua and un. The dashed line shows the R0=1 level set. (right) Optimal contact tracing precision Θ (i.e. the precision associated with the optimal notification threshold), as a function of social intervention measures us and the adoption faction ua, within the region where an outbreak is controllable for sufficiently small un but not controllable for arbitrarily large un. At the lower R0=1 boundary only un=0 prevents the epidemic, which corresponds to the minimal precision Θmin. Beyond the boundary there is a rapid increase in the optimal un and thus a rapid increase in precision. In the vicinity of the upper boundary the optimal un diverges, corresponding to the precision converging to Θmax. [inset] One-dimensional slices of the tracing precision for fixed ua (green) and fixed us (orange). We denote by ua and us the critical parameter values for which R0=1 when all else is fixed, while usmax denotes the upper boundary of the region, beyond which there is no outbreak even in the absence of contact tracing. (Color version online.)

Similar articles

Cited by

References

    1. Anon . DP–3T Project; 2020. Decentralized Privacy-Preserving Proximity Tracing: Technical Report.
    1. Anon . European Data Protection Board; 2020. Guidelines 04/2020 on the use of location data and contact tracing tools in the context of the COVID-19 outbreak: Technical Report.
    1. Baker R.E., Yang W., Vecchi G.A., Metcalf C.J.E., Grenfell B.T. Susceptible supply limits the role of climate in the early SARS-CoV-2 pandemic. Science. 2020 - PMC - PubMed
    1. Becker N.G., Glass K., Li Z., Aldis G.K. Controlling emerging infectious diseases like SARS. Math. Biosci. 2005;193(2):205–221. - PubMed
    1. Brauer F. Mathematical epidemiology is not an oxymoron. BMC Public Health. 2009;9(1):S2. - PMC - PubMed

LinkOut - more resources