. 2021 Jan 4;131(1):e138699.
doi: 10.1172/JCI138699.

Apobec1 complementation factor overexpression promotes hepatic steatosis, fibrosis, and hepatocellular cancer

Affiliations

Apobec1 complementation factor overexpression promotes hepatic steatosis, fibrosis, and hepatocellular cancer

Valerie Blanc et al. J Clin Invest. .

Abstract

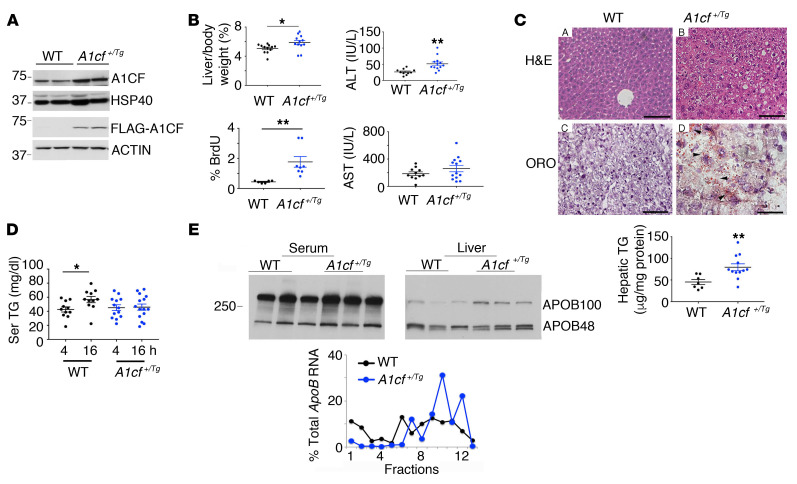
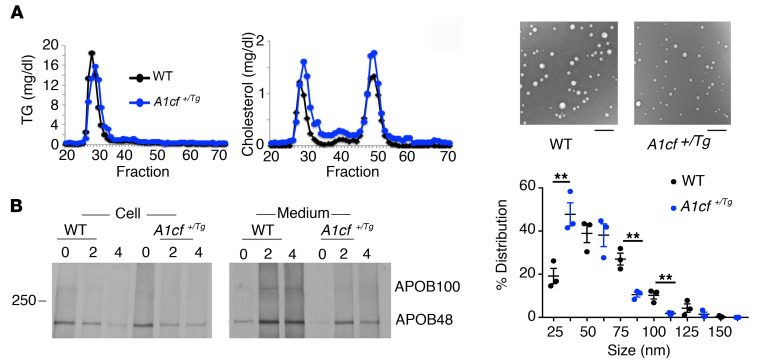
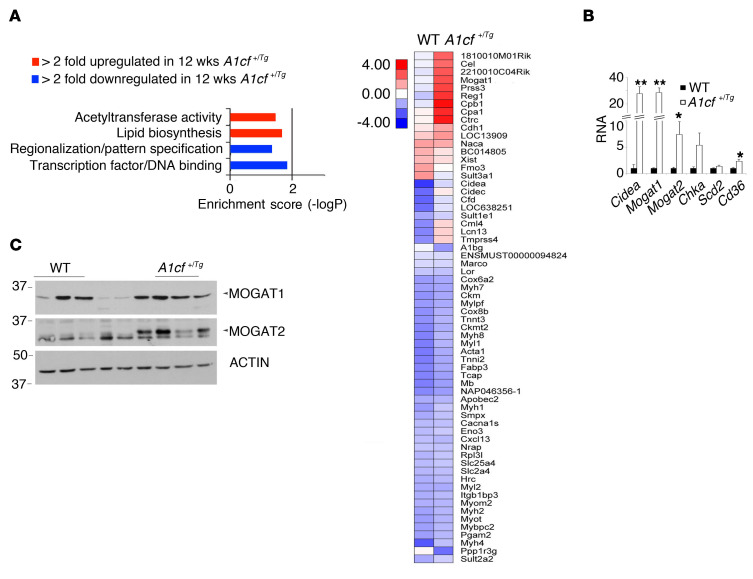
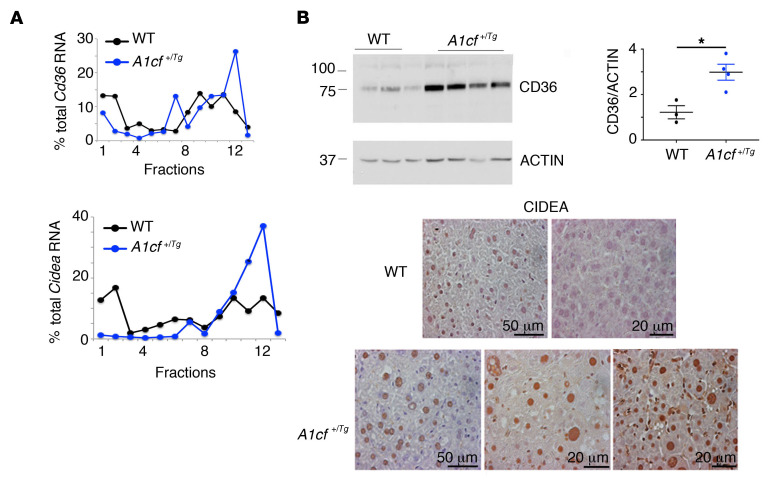
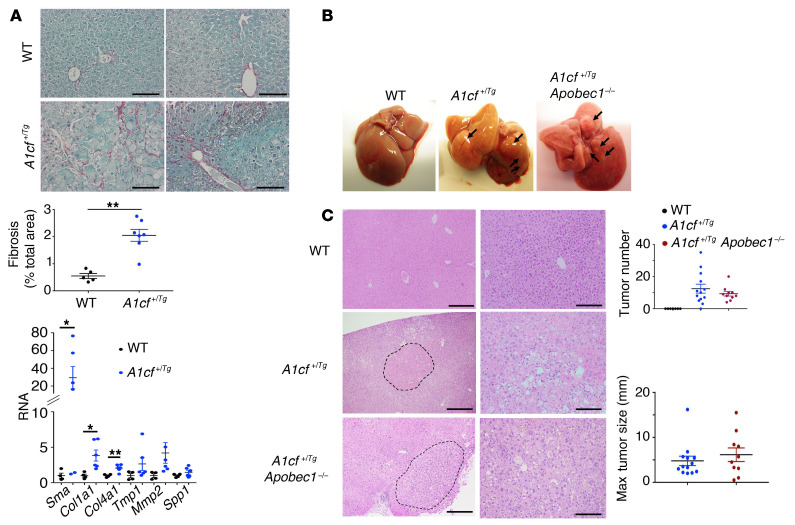
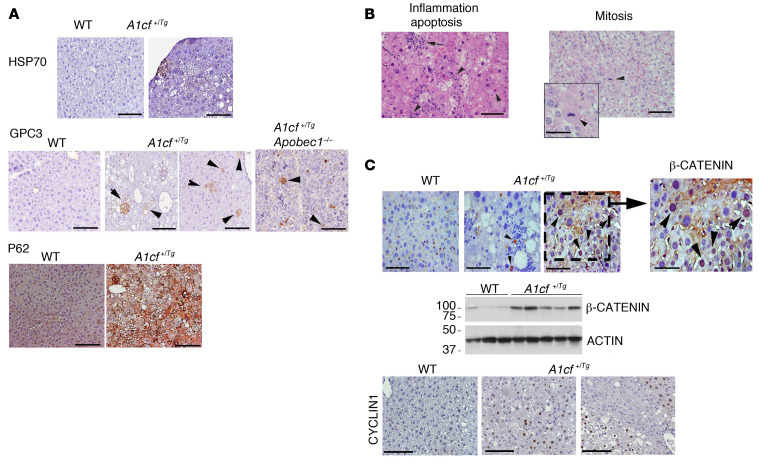
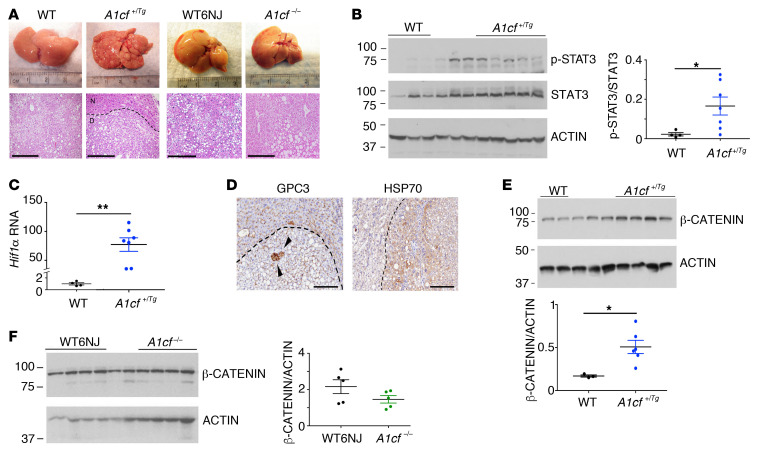
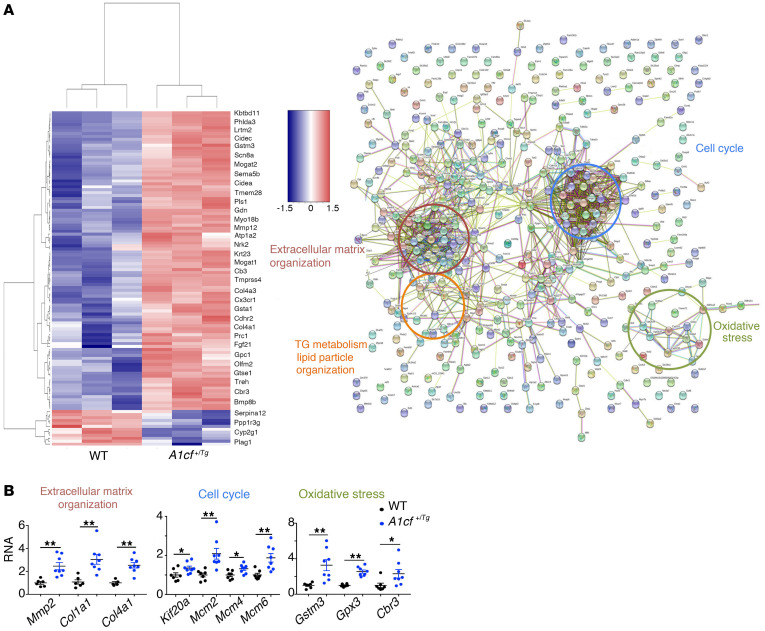
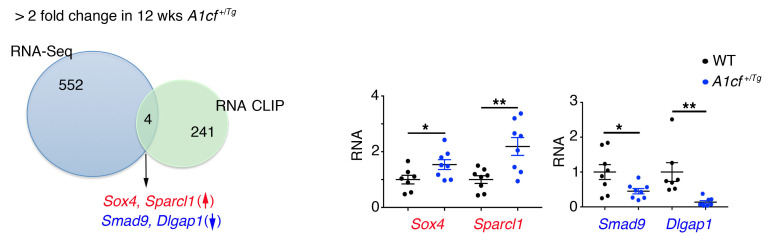
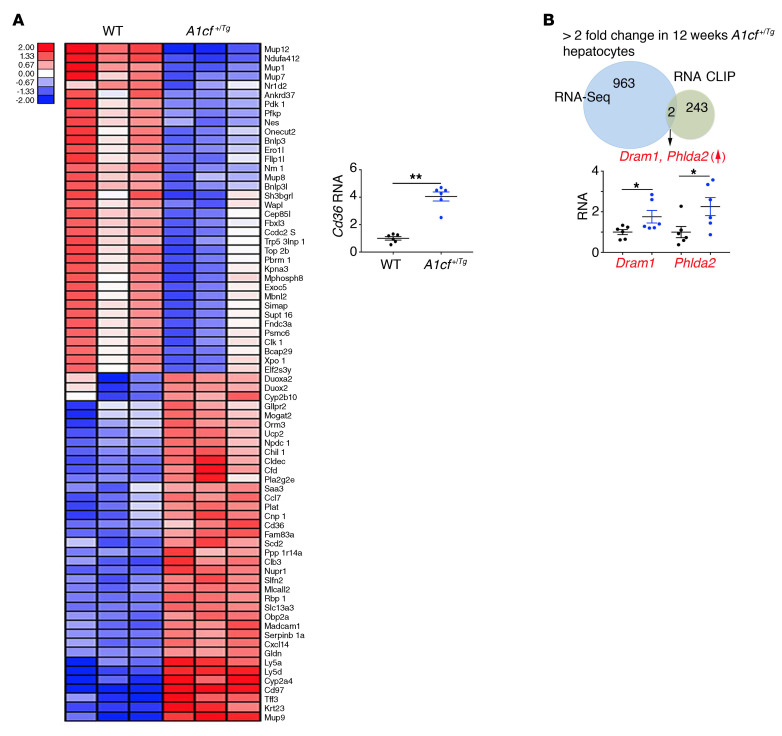
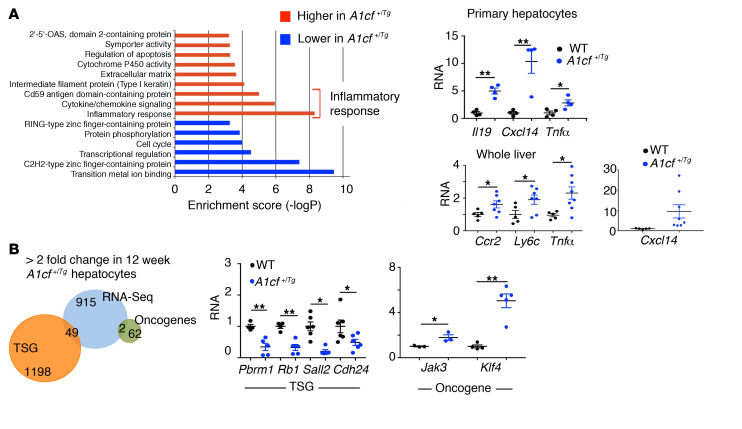
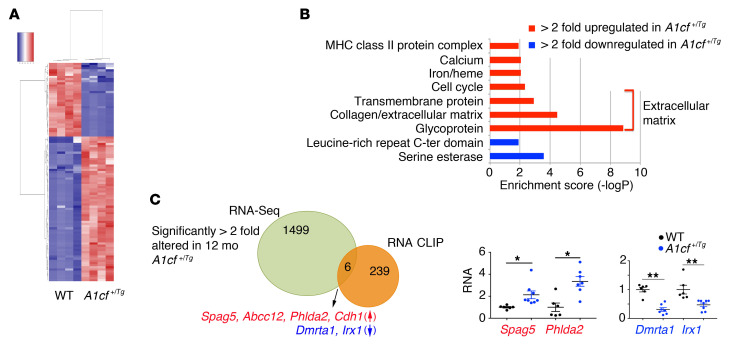
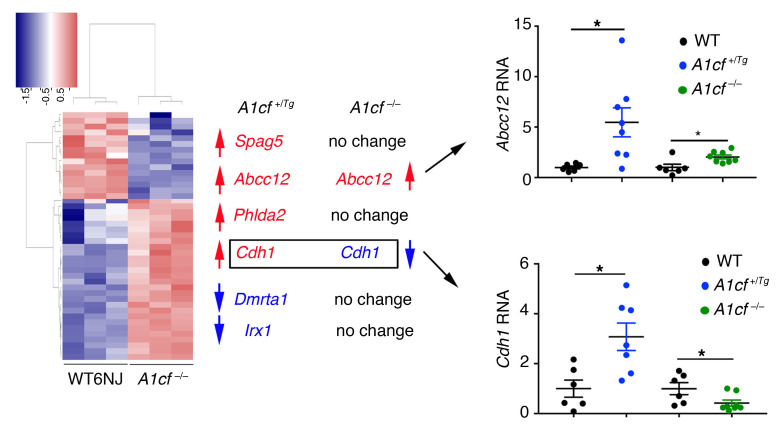
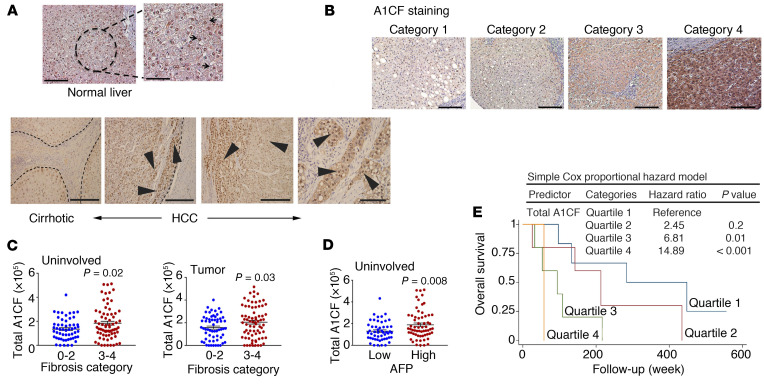
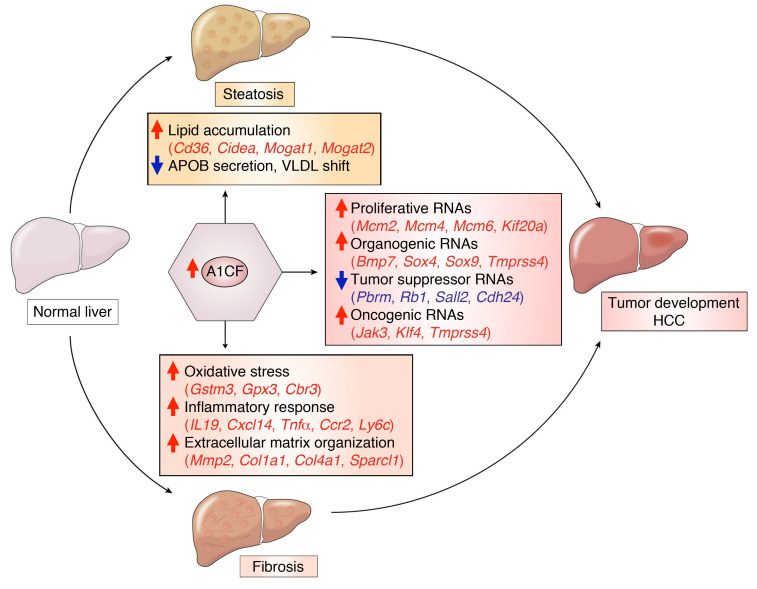
The RNA-binding protein Apobec1 complementation factor (A1CF) regulates posttranscriptional ApoB mRNA editing, but the range of RNA targets and the long-term effect of altered A1CF expression on liver function are unknown. Here we studied hepatocyte-specific A1cf-transgenic (A1cf+/Tg), A1cf+/Tg Apobec1-/-, and A1cf-/- mice fed chow or high-fat/high-fructose diets using RNA-Seq, RNA CLIP-Seq, and tissue microarrays from human hepatocellular cancer (HCC). A1cf+/Tg mice exhibited increased hepatic proliferation and steatosis, with increased lipogenic gene expression (Mogat1, Mogat2, Cidea, Cd36) associated with shifts in polysomal RNA distribution. Aged A1cf+/Tg mice developed spontaneous fibrosis, dysplasia, and HCC, and this development was accelerated on a high-fat/high-fructose diet and was independent of Apobec1. RNA-Seq revealed increased expression of mRNAs involved in oxidative stress (Gstm3, Gpx3, Cbr3), inflammatory response (Il19, Cxcl14, Tnfα, Ly6c), extracellular matrix organization (Mmp2, Col1a1, Col4a1), and proliferation (Kif20a, Mcm2, Mcm4, Mcm6), and a subset of mRNAs (including Sox4, Sox9, Cdh1) were identified in RNA CLIP-Seq. Increased A1CF expression in human HCC correlated with advanced fibrosis and with reduced survival in a subset with nonalcoholic fatty liver disease. In conclusion, we show that hepatic A1CF overexpression selectively alters polysomal distribution and mRNA expression, promoting lipogenic, proliferative, and inflammatory pathways leading to HCC.

Keywords: Hepatology; Liver cancer; Metabolism; RNA processing.


Conflict of interest statement

Conflict of interest: The authors have declared that no conflict of interest exists.

Figures

Figure 1
Figure 1. Young (8- to 14-week-old) A1cf+/Tg mice on chow diet exhibit increased proliferation and hepatic steatosis.
(A) Western blot of A1cf transgene expression in A1cf+/Tg liver using A1CF and FLAG antibodies. (B) Liver/body weight ratio of A1cf+/Tg mice, represented as mean ± SEM, *P < 0.05. Serum alanine aminotransferase (ALT) and aspartate aminotransferase (AST) in A1cf+/Tg mice (11–13 per genotype). Data are shown as mean ± SEM, **P < 0.01. Proliferative index expressed as percentage of BrdU-positive hepatocytes (mean ± SEM, n = 6–8), **P < 0.01. (C) H&E- and Oil Red O–stained liver sections from A1cf+/Tg mice. Scale bars: 50 μm. Hepatic triglyceride (TG) content (mean ± SEM, 7–12 mice), **P < 0.01. (D) Serum TG after 4- or 16-hour fast (n = 11–15 animals per group). Data are mean ± SEM, *P < 0.05. (E) Western blot of serum and hepatic APOB. Polysomal distribution of ApoB RNA upon fractionation of hepatic cytoplasmic extracts from A1cf+/Tg mice: monosome (fractions 1–6) and polysome (fractions 7–13). Data are representative of 4 separate isolations. Unpaired Student’s t test was used to determine significance between A1cf+/Tg and WT control groups for all experiments.
Figure 2
Figure 2. Young A1cf+/Tg mice show reduced APOB secretion and smaller VLDL particles.
(A) Serum lipoprotein profile (n = 4 per group) following a 4-hour fast and fractionation by fast protein liquid chromatography. TG and cholesterol levels were biochemically determined. Bottom panel: Electron microscopy of serum VLDL particles isolated from pooled serum, 4 hours after Pluronic F-127 injection. Scale bars: 500 nm. Unpaired Student’s t test was used to determine significance between groups. Size distribution of VLDL particles is representative of 3 separate evaluations, **P < 0.01. (B) Pulse chase analysis of [35S]-labeled APOB synthesis and secretion from primary hepatocytes isolated from A1cf+/Tg mice. Autoradiograph is a representative image of 3 independent experiments.
Figure 3
Figure 3. Hepatic enrichment in genes involved in lipid biosynthesis in A1cf+/Tg mice.
Expression profile of liver-enriched genes in 8- to 14-week-old chow-fed A1cf+/Tg mice. (A) Enriched KEGG pathways in differentially expressed genes from A1cf+/Tg livers. Heatmap diagram of the more than 2-fold differentially expressed genes in A1cf+/Tg mice. (B) qPCR validation of differentially upregulated genes involved in lipid biosynthesis (n = 6–7 mice per genotype). Data are mean ± SEM. Unpaired Student’s t test was used to determine significance between genotypes, *P < 0.05, **P < 0.01. (C) Western blot analysis of MOGAT1 and MOGAT2 in livers from chow-fed A1cf+/Tg mice. Actin was used as loading control. (n = 4–5 mice per genotype.)
Figure 4
Figure 4. Altered expression of genes promoting fatty acid uptake and lipogenesis in A1cf+/Tg mice.
(A) Polysomal distribution of Cd36 and Cidea RNAs from cytoplasmic extracts from A1cf+/Tg liver. RNA abundance was quantitated by qPCR across monosome (fractions 1–6) and polysome (fractions 7–13). Data are representative of 3 separate fractionations. (B) Western blot analysis of CD36 in liver of A1cf+/Tg mice using actin as loading control. Data are mean ± SEM. Significance was determined using unpaired Student’s t test, *P < 0.05. Immunohistochemical analysis of CIDEA in liver of A1cf+/Tg mice and littermate controls.
Figure 5
Figure 5. Hepatic overexpression of A1CF promotes fibrosis and spontaneous tumorigenesis.
(A) Representative images of Sirius red–stained A1cf+/Tg and WT livers. Scale bars: 50 μm. Quantitation of Sirius red–stained area expressed as percentage total area (mean ± SEM). Significance was determined using unpaired Student’s t test, **P < 0.01 (n = 6). Bottom panel: qPCR evaluation of fibrogenic genes in livers of chow-fed 12-month-old A1cf+/Tg mice. Data are mean ± SEM (n = 6 per genotype). Unpaired t test was used to determine significance between 12-month-old groups, *P < 0.05. (B) Gross images of liver from A1cf+/Tg and A1cf+/Tg Apobec1–/– mice at 12 months of age fed a low-fat chow diet. (C) Representative images of H&E-stained liver sections from A1cf+/Tg and A1cf+/Tg Apobec1–/– mice. The dashed curved lines delineate tumor margin. Scale bars: 100 μm (left) and 50 μm (right). Macroscopic quantitation and size of nodules showing total number (top) and maximum size (bottom) of tumors.
Figure 6
Figure 6. Increased expression of HCC markers in 12-month-old A1cf+/Tg mice.
(A) Representative images of HSP70 and p62 expression in HCC from 12-month-old A1cf+/Tg mice. Representative images of hepatic GPC3 in 12-month-old A1cf+/Tg and A1cf+/Tg Apobec1–/– mice. Arrowheads indicate clusters of GPC3-positive cells. (B) Representative H&E images of pathological features identified in 12-month-old A1cf+/Tg liver. Left panel: Arrow indicates focal inflammation. Arrowheads indicate apoptotic cells. Right panel: Arrowhead indicates mitotic body. (C) Immunohistochemical staining of 12-month-old A1cf+/Tg livers with β-catenin antibody. Expression of β-catenin in liver tissue from A1cf+/Tg and littermate controls evaluated by Western blot and compared with actin. Representative images of cyclin D1 in liver from 12-month-old A1cf+/Tg mice. All panels, scale bars: 50 μm.
Figure 7
Figure 7. Accelerated hepatic tumorigenesis in A1cf+/Tg mice fed a trans-fat/fructose diet.
(A) Top: Gross images of liver from A1cf+/Tg and A1cf–/– mice fed a trans-fat/fructose diet for 6 months. Bottom: H&E staining revealing fat accumulation in all genotypes but dysplastic nodules (dashed area) only in A1cf+/Tg liver. Scale bars: 100 μm. (B) Western blot analysis of STAT3 activation/phosphorylation at Tyr 705. p-STAT3 was normalized to total STAT3 (n = 7 A1cf+/Tg and 4 WT). Unpaired Student’s t test was used to determine significance between groups, *P < 0.05. (C) Expression of STAT3 downstream target, Hif1α RNA, by qPCR. Data are mean ± SEM (n = 7 A1cf+/Tg and 4 WT), **P < 0.01 determined by unpaired Student’s t test. (D) Representative images of GPC3- and HSP70-stained sections from A1cf+/Tg mice. Distinct nodules are delineated by dashed curved lines. GPC3 staining shows rare cells staining with cytoplasmic positivity within the nodule (arrowheads). Positive HSP70 staining in liver nodule, supporting neoplastic progression. Scale bars: 50 μm. (E and F) Expression of β-catenin in liver from 7 A1cf+/Tg and 4 WT mice (E) and 5 A1cf–/– mice and 5 aged-matched WT6NJ mice (F). Expression of β-catenin normalized to actin is shown as β-catenin/actin ratio. Significance was determined using unpaired Student’s t test, *P < 0.05.
Figure 8
Figure 8. Differentially expressed genes in livers from young A1cf+/Tg mice.
(A) Heatmap of the 556 differentially expressed genes. STRING analysis of the differentially expressed genes showing enriched pathways. (B) qPCR validation of gene clusters involved in extracellular matrix organization (red), cell cycle (blue), and oxidative stress (green). Data are mean ± SEM (n = 6–8), *P < 0.05, **P < 0.01 (unpaired t test).
Figure 9
Figure 9. Schematic representation of differentially expressed genes in young A1cf+/Tg mice in relation to A1CF RNA CLIP targets.
Two A1CF RNA targets (Sox4 and Sparcl1) are upregulated (red) and 2 (Smad9 and Dlgap1) are downregulated (blue) in A1cf+/Tg liver. Expression of these 4 targets was validated by qPCR (n = 7–8) and is shown as mean ± SEM, *P < 0.05, **P < 0.01 (unpaired t test).
Figure 10
Figure 10. Differentially expressed genes in primary hepatocytes from young A1cf+/Tg mice in relation to A1CF RNA CLIP targets.
(A) Heatmap of 966 differentially altered genes in primary hepatocytes from A1cf+/Tg mice. Upregulation of Cd36 RNA in A1cf+/Tg hepatocytes represented as mean ± SEM (n = 6), **P < 0.01 (unpaired t test). (B) Venn diagram showing two A1CF RNA CLIP targets (Dram1 and Phlda2) upregulated in A1cf+/Tg hepatocytes with mRNA expression, validated by qPCR, shown as mean ± SEM (n = 6), *P < 0.05 (unpaired t test).
Figure 11
Figure 11. A1cf+/Tg primary hepatocytes show enrichment in inflammatory response pathways.
(A) Gene Ontology analysis showing functional pathways overrepresented (red) and underrepresented (blue) in A1cf+/Tg hepatocytes. Relative expression of genes involved in inflammatory response examined by qPCR, in both isolated hepatocytes and whole liver (5–8 per genotype). Data are mean ± SEM, *P < 0.05, **P < 0.01 (unpaired t test). (B) Venn diagram representing comparative analysis between genes with differentially altered expression in A1cf+/Tg hepatocytes and Tumor Suppressor Gene (TSG) and Oncogene databases. qPCR validation of a subset of TSG and Oncogene RNAs from 4–5 independent hepatocyte isolations per genotype. Data are mean ± SEM, *P < 0.05, **P < 0.01 (unpaired t test).
Figure 12
Figure 12. Summary of differentially expressed genes in liver of 12-month-old chow-fed A1cf+/Tg mice.
(A) Heatmap showing expression of 1505 differentially expressed genes in A1cf+/Tg liver. (B) Gene Ontology analysis depicting functional categories overrepresented (red) and underrepresented (blue) in A1cf+/Tg livers. (C) Venn diagram summarizing comparative analysis between 1505 differentially altered genes in A1cf+/Tg liver and A1CF RNA targets identified by RNA CLIP. Six A1CF RNA targets showed altered expression, with 4 (Spag5, Abcc12, Phlda2, and Cdh1) upregulated (red) and 2 (Dmrta1 and Irx1) downregulated (blue). Expression was confirmed by qPCR (6–8 animals per genotype). Data indicate mean ± SEM, *P < 0.01, **P < 0.05 (unpaired t test).
Figure 13
Figure 13. Expression profile of differentially expressed A1CF RNA CLIP targets in 12-month-old A1cf–/– mice.
Heatmap representation of 298 genes with altered expression in liver of 12-month-old chow-fed A1cf–/– mice. Expression of A1CF RNA targets, differentially expressed in 12-month-old A1cf+/Tg, in liver of 12-month-old A1cf–/– mice. Genes upregulated in aged A1cf+/Tg mice are indicated in red; genes downregulated are indicated in blue. RNA-Seq analysis showed that of the 6 genes identified from RNA-Seq and RNA CLIP in A1cf+/Tg mice, only Cdh1 was both upregulated in A1cf+/Tg mice and downregulated in A1cf–/– mice. Cdh1 RNA expression in A1cf+/Tg and A1cf–/– liver was confirmed by qPCR (n = 6–7 per genotype). Data represent mean ± SEM, *P < 0.05 (unpaired t test).
Figure 14
Figure 14. A1CF expression inferred from immunohistochemical staining in human HCC tissue microarray.
(A) Top: A1CF staining of normal human liver showing homogeneous strong nuclear expression. Scale bars: 50 μm. Bottom: A1CF in cirrhotic and HCC tissue. Staining shows a gradient of expression with strong nuclear A1CF staining at the edge of cirrhotic nodules and tumor (arrowheads). Scale bars: 50 μm (first 3 panels) and 20 μm (last panel). (B) A1CF expression in 137 human samples from a tissue microarray. Samples were categorized according to A1CF staining evaluated by quantitation of pixels (see Methods). A representative image of each category is shown. Scale bars: 50 μm. (C) A1CF expression and comparison among fibrosis categories in uninvolved and tumor tissues from all patients. Data represent mean ± SEM (unpaired t test). (D) A1CF expression in uninvolved tissue and comparison among patients with low and high levels of AFP, represented as mean ± SEM (unpaired t test). (E) Kaplan-Meier plots of the overall survival rates in HCC subjects with underlying NAFLD, stratified by A1CF staining intensity. Patients were divided into 4 quartiles based on A1CF total expression in uninvolved tissue. Patients with highest A1CF staining (quartile 4) show significantly reduced survival compared with patients with lower A1CF staining intensity (quartiles 1–3). Inset shows Cox proportional hazard values.
Figure 15
Figure 15. Schematic summary of findings with an integrated mechanism for A1CF-induced hepatic carcinogenesis.
Hepatic overexpression of A1CF induces steatosis via pathways including increased expression of lipogenic genes, increased fatty acid/lipid uptake (Cidea, Mogat1, Mogat2, Cd36), and reduced VLDL APOB secretion. Increased A1CF expression is also associated with increased oxidative stress (Gstm3, Gpx3, Cbr3), augmented inflammatory response (Il19, Cxcl14, Tnfα, Ccr2, Ly6c), and exaggerated extracellular matrix organization (Mmp2, Col1a1, Col4a1, Sparcl1), which together promote accumulation of collagen and fibrosis. In parallel, hepatic overexpression of A1CF increases expression of proliferative genes (Mcm2, Mcm4, Mcm6, Kif20a), organogenic genes (Bmp7, Sox4, Sox9, Tmprss4), and oncogenic genes (Jak3, Klf4, Tmprss4) and decreases expression of tumor suppressor genes (Pbrm1, Rb1, Sall2, Cdh24). These adaptive responses, including steatosis, fibrosis, and augmented proliferation, combine to promote spontaneous hepatic carcinogenesis in A1cf+/Tg mice.

Similar articles

Cited by

References

    1. Rinella M, Charlton M. The globalization of nonalcoholic fatty liver disease: prevalence and impact on world health. Hepatology. 2016;64(1):19–22. doi: 10.1002/hep.28524. - DOI - PubMed
    1. Forner A, Llovet JM, Bruix J. Hepatocellular carcinoma. Lancet. 2012;379(9822):1245–1255. doi: 10.1016/S0140-6736(11)61347-0. - DOI - PubMed
    1. Adams LA, Anstee QM, Tilg H, Targher G. Non-alcoholic fatty liver disease and its relationship with cardiovascular disease and other extrahepatic diseases. Gut. 2017;66(6):1138–1153. doi: 10.1136/gutjnl-2017-313884. - DOI - PubMed
    1. Sookoian S, Pirola CJ, Valenti L, Davidson NO. Genetic pathways in nonalcoholic fatty liver disease: insights from systems biology. Hepatology. 2020;72(1):330–346. doi: 10.1002/hep.31229. - DOI - PMC - PubMed
    1. Pirola CJ, Sookoian S. The dual and opposite role of the TM6SF2-rs58542926 variant in protecting against cardiovascular disease and conferring risk for nonalcoholic fatty liver: a meta-analysis. Hepatology. 2015;62(6):1742–1756. doi: 10.1002/hep.28142. - DOI - PubMed

Publication types

MeSH terms