. 2021 Jan 12;13(1):205.
doi: 10.3390/nu13010205.

Parenteral Fish-Oil Containing Lipid Emulsions Limit Initial Lipopolysaccharide-Induced Host Immune Responses in Preterm Pigs

Affiliations

Parenteral Fish-Oil Containing Lipid Emulsions Limit Initial Lipopolysaccharide-Induced Host Immune Responses in Preterm Pigs

William Yakah et al. Nutrients. .

Abstract

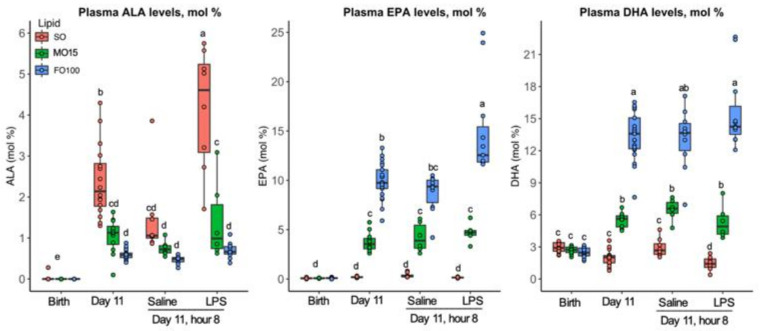
Multicomponent lipid emulsions are available for critical care of preterm infants. We sought to determine the impact of different lipid emulsions on early priming of the host and its response to an acute stimulus. Pigs delivered 7d preterm (n = 59) were randomized to receive different lipid emulsions for 11 days: 100% soybean oil (SO), mixed oil emulsion (SO, medium chain olive oil and fish oil) including 15% fish oil (MO15), or 100% fish oil (FO100). On day 11, pigs received an 8-h continuous intravenous infusion of either lipopolysaccharide (LPS-lyophilized Escherichia coli) or saline. Plasma was collected for fatty acid, oxylipin, metabolomic, and cytokine analyses. At day 11, plasma omega-3 fatty acid levels in the FO100 groups showed the highest increase in eicosapentaenoic acid, EPA (0.1 ± 0.0 to 9.7 ± 1.9, p < 0.001), docosahexaenoic acid, DHA (day 0 = 2.5 ± 0.7 to 13.6 ± 2.9, p < 0.001), EPA and DHA-derived oxylipins, and sphingomyelin metabolites. In the SO group, levels of cytokine IL1β increased at the first hour of LPS infusion (296.6 ± 308 pg/mL) but was undetectable in MO15, FO100, or in the animals receiving saline instead of LPS. Pigs in the SO group showed a significant increase in arachidonic acid (AA)-derived prostaglandins and thromboxanes in the first hour (p < 0.05). No significant changes in oxylipins were observed with either fish-oil containing group during LPS infusion. Host priming with soybean oil in the early postnatal period preserves a higher AA:DHA ratio and the ability to acutely respond to an external stimulus. In contrast, fish-oil containing lipid emulsions increase DHA, exacerbate a deficit in AA, and limit the initial LPS-induced inflammatory responses in preterm pigs.

Keywords: acute inflammation; arachidonic acid; eicosanoids; fatty acids; lipid metabolism; metabolomics; oxylipins; preterm pig; sphingomyelin.


Conflict of interest statement

Fresenius Kabi provided the lipid emulsions used in this study. Martin has grant support from Feihe International and Mead Johnson Nutrition; serves on the scientific advisory boards of Plakous Therapeutics, Inc. and LUCA Biologics; and has served as a consultant to Fresenius Kabi. Burrin has received grant support from Fresenius Kabi outside of this work. The other authors declare no conflicts of interest. The funders had no role in the design of the study; in the collection, analyses, or interpretation of data; in the writing of the manuscript, or in the decision to publish the results.

Figures

Figure 1
Figure 1
Experimental study design. Pigs were delivered 7 days preterm and received total parenteral nutrition for 11 days. On day 11, pigs received either LPS (lyophilized E. Coli) or saline. 1Mixed oil contains: 30% soybean oil, 30% medium chain triglycerides, 25% olive oil, 15% fish oil. GA, gestational age; LPS, lipopolysaccharide.
Figure 2
Figure 2
Vital sign changes in pigs during LPS challenge. Hourly recordings in temperature, oxygen saturation, and heart rate by lipid group, SO (A, n = 16), MO (B, n = 20), and FO100 (C, n = 23) lipid groups. Data was presented as line plot showing median and IQR. Groups without common letters are significantly different (p < 0.05). FO100, 100 percent fish oil; LPS, lipopolysaccharide; MO15, mixed oil with 15% fish oil; SO, 100% soybean oil.
Figure 3
Figure 3
Specific plasma n-3 fatty acid profiles across postnatal age as a function of lipid group. Concentrations of fatty acids were determined by GC-MS and are presented as mol% in the form of boxplots with dots. Data show median and IQR. At day 11, pigs in each lipid group received either LPS or saline, and fatty acid levels were measured at 8 h at the end of the continuous infusion. Labeled points without a common letter represent a statistically significant difference of p < 0.05. ALA, α-linolenic acid; DHA, docosahexaenoic acid; EPA, eicosapentaenoic acid; FO100, 100 percent fish oil; MO15, mixed oil with 15% fish oil; SO, 100% soybean oil.
Figure 4
Figure 4
Specific plasma n-6 fatty acid profiles across postnatal age as a function of lipid group. Concentrations of fatty acids were determined by GC-MS and are presented as mol% in the form of boxplots with dots. Data show median and IQR. At day 11, pigs in each lipid group received either LPS or Saline, and fatty acid levels were measured at 8 h at the end of the continuous infusion. Labeled points without a common letter represent a statistically significant difference of p < 0.05. AA, arachidonic acid; DGLA, dihomo-γ linolenic acid; FO100, 100 percent fish oil; LA, linoleic acid; MO15, mixed oil with 15% fish oil; SO, 100% soybean oil.
Figure 5
Figure 5
Plasma fatty acid ratios across postnatal age as a function of lipid group. Concentrations of fatty acids were determined by GC-MS and are presented as mol% in the form of boxplots with dots. Data show median and IQR. At day 11, pigs in each lipid group received either LPS or Saline, and fatty acid levels were measured at 8 h at the end of the continuous infusion. Labeled points without a common letter represent a statistically significant difference of p < 0.05. AA, arachidonic acid; DGLA, dihomo-γ linolenic acid; EPA, eicosapentaenoic acid; FO100, 100 percent fish oil; LA, linoleic acid; MO15, mixed oil with 15% fish oil; n-3, omega-3, n-6, omega-6; SO, 100% soybean oil.
Figure 6
Figure 6
Changes in plasma oxylipins at day 11 compared to day zero (priming stage) by lipid group, SO (n = 10), MO15 (n = 9), and FO100 (n = 10). Scatter plot shows the median fold change of oxylipins within each lipid group indicated by colors and parent fatty acids of the oxylipins indicated by shapes. AA, arachidonic acid; ALA, α-linolenic acid; DGLA, dihomo-γ linolenic acid; DHA, docosahexaenoic acid; EPA, eicosapentaenoic acid; FO100, 100 percent fish oil; LA, linoleic acid; MO15, mixed oil with 15% fish oil; SO, 100% soybean oil.
Figure 7
Figure 7
Changes in plasma oxylipins during LPS infusion. Scatter plot shows the median fold change of oxylipins at different hours of infusion (shape) compared to baseline on day 11 within each lipid group, SO (red, n = 10), MO15 (green, n = 9), and FO100 (blue, n = 10). AA, arachidonic acid; ALA, α-linolenic acid; DGLA, dihomo-γ linolenic acid; DHA, docosahexaenoic acid; EPA, eicosapentaenoic acid; FO100, 100 percent fish oil; LPS, lipopolysaccharide; LA, linoleic acid; MO15, mixed oil with 15% fish oil; SO, 100% soybean oil.
Figure 8
Figure 8
Plasma levels of C-reactive protein (CRP), interleukin (IL)-1b, IL-6, IL-8, IL-10 and tumor necrosis factor (TNF)-α by lipid group, (SO (n = 8), MO15 (n = 6), and FO100 (n = 11), recorded hourly after the introduction of lipopolysaccharide on day 11. Data show median and IQR. Labeled points without a common letter represent a statistically significant difference of p < 0.05. FO100, 100 percent fish oil; MO15, mixed oil with 15% fish oil; SO, 100% soybean oil.
Figure 9
Figure 9
Changes in plasma lipid metabolites at birth, day 11, and at the end of an 8 h continuous infusion of saline or LPS on day 11 by lipid group, SO (n = 16), MO15 (n = 13), and FO100 (n = 19). The heatmap shows the median relative expression of the top 50 significantly different lipid metabolites by 2-way ANOVA (lipid × day) per lipid groups. FO100, 100 percent fish oil; LPS, lipopolysaccharide; MO15, mixed oil with 15% fish oil; SO, 100% soybean oil.

Similar articles

Cited by

References

    1. Andescavage N.N., Plessis A., Carter R., Serag A., Evangelou I., Vezina G., Robertson R., Limperopoulos C. Complex Trajectories of Brain Development in the Healthy Human Fetus. Cereb. Cortex. 2017;27:5274–5283. doi: 10.1093/cercor/bhw306. - DOI - PMC - PubMed
    1. Bouyssi K.M., Plessis A.J., Carter R., Brossard R.M., Murnick J., Tinkleman L., Robertson R.L., Limperopoulos C. Third Trimester Brain Growth in Preterm Infants Compared with in Utero Healthy Fetuses. Pediatrics. 2016;138 doi: 10.1542/peds.2016-1640. - DOI - PMC - PubMed
    1. Darmaun D., Lapillonne A., Simeoni U., Picaud J.C., Roze J.C., Saliba E., Bocquet A., Chouraqui J.P., Dupont C., Feillet F., et al. Parenteral nutrition for preterm infants: Issues and strategy. Arch. Pediatr. 2018;25:286–294. doi: 10.1016/j.arcped.2018.02.005. - DOI - PubMed
    1. Martin C.R., Dasilva D.A., Cluette B.J.E., Dimonda C., Hamill A., Bhutta A.Q., Coronel E., Wilschanski M., Stephens A.J., Driscoll D.F., et al. Decreased postnatal docosahexaenoic and arachidonic acid blood levels in premature infants are associated with neonatal morbidities. J. Pediatr. 2011;159:743–749. doi: 10.1016/j.jpeds.2011.04.039. - DOI - PMC - PubMed
    1. Martin C.R., Cheesman A., Brown J., Makda M., Kutner A.J., Silva D., Zaman M., Freedman S.D. Factors Determining Optimal Fatty Acid Absorption in Preterm Infants. J. Pediatr. Gastroenterol. Nutr. 2016;62:130–136. doi: 10.1097/MPG.0000000000000934. - DOI - PMC - PubMed

LinkOut - more resources