Review
. 2021 Jan 12;10(1):51.
doi: 10.3390/biology10010051.

Microscopy Methods for Biofilm Imaging: Focus on SEM and VP-SEM Pros and Cons

Affiliations
Review

Microscopy Methods for Biofilm Imaging: Focus on SEM and VP-SEM Pros and Cons

Michela Relucenti et al. Biology (Basel). .

Abstract

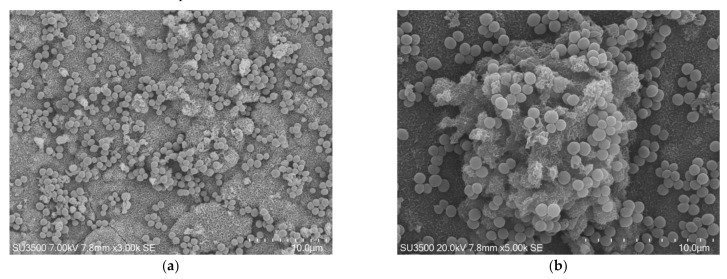
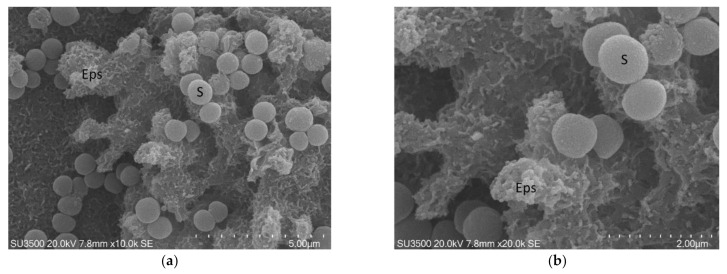
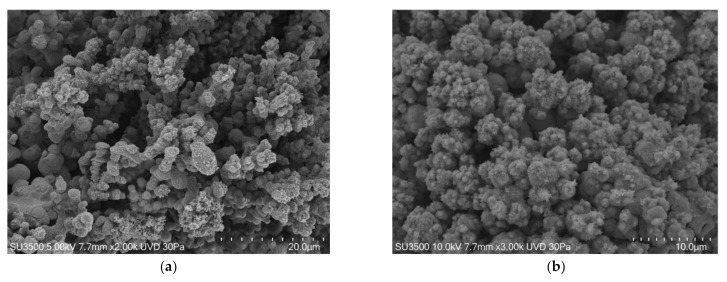
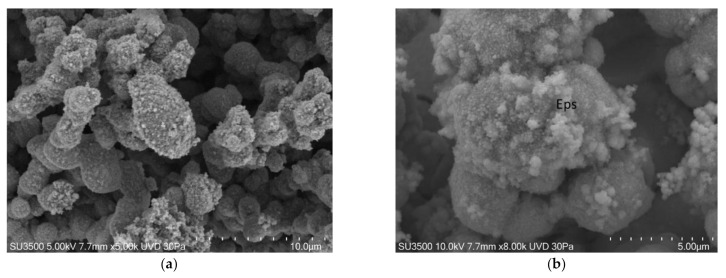
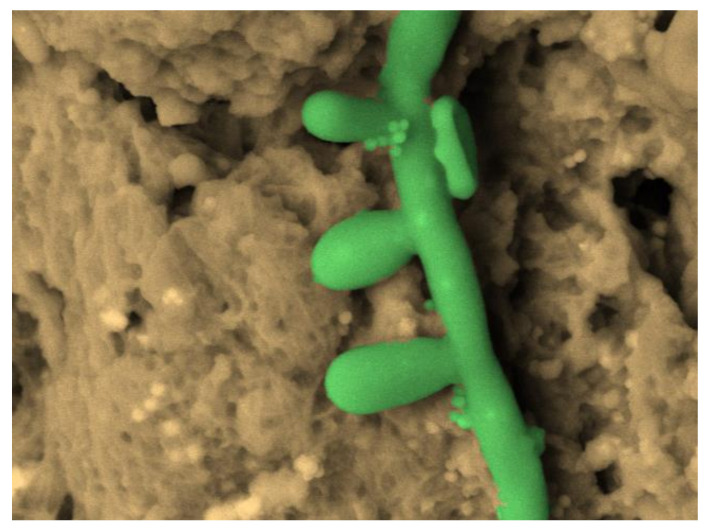
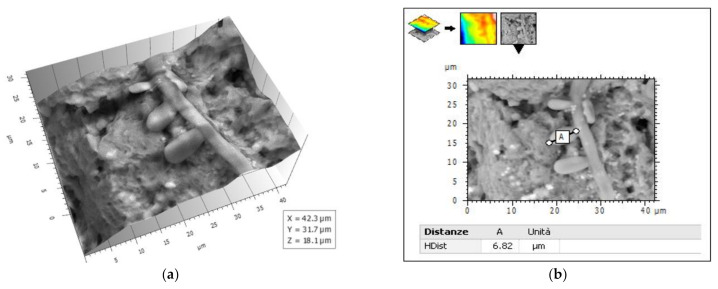
Several imaging methodologies have been used in biofilm studies, contributing to deepening the knowledge on their structure. This review illustrates the most widely used microscopy techniques in biofilm investigations, focusing on traditional and innovative scanning electron microscopy techniques such as scanning electron microscopy (SEM), variable pressure SEM (VP-SEM), environmental SEM (ESEM), and the more recent ambiental SEM (ASEM), ending with the cutting edge Cryo-SEM and focused ion beam SEM (FIB SEM), highlighting the pros and cons of several methods with particular emphasis on conventional SEM and VP-SEM. As each technique has its own advantages and disadvantages, the choice of the most appropriate method must be done carefully, based on the specific aim of the study. The evaluation of the drug effects on biofilm requires imaging methods that show the most detailed ultrastructural features of the biofilm. In this kind of research, the use of scanning electron microscopy with customized protocols such as osmium tetroxide (OsO4), ruthenium red (RR), tannic acid (TA) staining, and ionic liquid (IL) treatment is unrivalled for its image quality, magnification, resolution, minimal sample loss, and actual sample structure preservation. The combined use of innovative SEM protocols and 3-D image analysis software will allow for quantitative data from SEM images to be extracted; in this way, data from images of samples that have undergone different antibiofilm treatments can be compared.

Keywords: biofilm; scanning electron microscopy; variable pressure scanning electron microscopy.


Conflict of interest statement

The authors declare no conflict of interest.

Figures

Figure 1
Figure 1
S. mutans prepared by conventional scanning electron microscope (SEM) protocol. (a) SEM, 3000×. S. mutans spherical bacterial cells were scattered on biofilm matrix compact surface. Image was captured from the same sample observed in Figure 1a from [50]; (b) SEM, 5000×. Increasing magnification S. mutans spherical bacterial cells appeared clustered in small groups on the surface of a rough and dense extracellular matrix (Eps).
Figure 2
Figure 2
S. mutans prepared by conventional SEM procedure. (a) SEM, 10,000×. Eps forms a canalicular system of compact trabeculae with spiny surface. Bacterial cells, S, are adherent to the Eps surface. Eps: extracellular polymeric substance. Image was captured from the same sample observed in [50] Figure 1d; (b) SEM, 20,000×. Bacterial cells appear irregular, Eps micro-canalicular system is not developed, only superficial holes are visible. Bacterial cells lay down on the Eps surface, and they appear naked, without a matrix covering. Bacterial cells are sometimes fragmented or indented; Eps showed a compact aspect due to the collapse of its fine structure. Bacterial cells, uncovered by the matrix, rest on the Eps surface. Eps: extracellular polymeric substance, S: S. mutans. Image was captured from the same sample observed in [50]. Figure 1f.
Figure 3
Figure 3
S. mutans prepared by conventional VP-SEM procedure. (a) VP-SEM 2000×. An intricate micro-canalicular system develops among bacterial towers. Image was captured from the same sample observed in [50] Fig. (b) VP-SEM 3000×. Hydration preservation confers biofilm a spongy aspect, without shrinking or any sign of collapse. Image was captured from the same sample observed in [50] Figure 2d.
Figure 4
Figure 4
S. mutans prepared by conventional variable pressure SEM (VP-SEM) procedure. (a) VP-SEM 5000×. Bacterial towers are lined by a superficial granulation representing Eps secretion. Image was captured from the same sample observed in [50] Figure 2f. (b) VP-SEM 8000×. On S. mutans cells surface is clearly visible the fine graininess of freshly secreted Eps components. Image is the same of [50] Figure 2e.
Figure 5
Figure 5
S. mutans prepared by the OsO4-RR-TA-IL procedure. (a) 3000×. The biofilm topography showed a spongy appearance. (b) 5000×. The biofilm topography showed both compact, c, and spongy, s, appearance, a single bacterial cell, b, was partially embedded in Eps.
Figure 6
Figure 6
S. mutans prepared by the OsO4-RR-TA-IL procedure. (a) At high magnification, a well-developed micro-canalicular system, m, is visible in the spongy Eps, 10,000×. Image was captured from the same sample observed in Figure 3b from [50]. (b). High voltage, high magnification, and high-resolution image of microcanalicular system, m. Fully hydrated Eps appears as a spongy structure formed by globular aggregate, g, at nanometric level, no filaments or collapsed network are visible, 20,000×. Image was captured from the same sample observed in [50] Figure 3f.
Figure 7
Figure 7
S. mutans prepared by the conventional SEM protocol. At high magnification, 30,000×, Eps appeared as a collapsed network of filaments, cell surface, s, was naked, and not covered by Eps.
Figure 8
Figure 8
S. mutans prepared by the OsO4-RR-TA-IL procedure. At high magnification, 30,000×, and high voltage, 15 kV, a globular Eps formed trabeculae of a microcanalicular system, m, and lines the bacterial cells’ surface, s. This high magnification and high-resolution image confirms the value of this protocol in terms of biofilm three-dimensional structure preservation up to the nanometric level.
Figure 9
Figure 9
Candida albicans hyphae with conidia and spores, SEM OsO4-RR-TA-IL protocol 3000×, image artificially colored by software 3D Hitachi Mountains Map (Digital Surf, France).
Figure 10
Figure 10
(a) 3-D reconstruction from picture in Figure 9 by 3D Hitachi Mountains 7 software. (b) Conidium length measure.

Similar articles

Cited by

References

    1. Costerton J.W., Geesey G.G., Cheng K.-J. How Bacteria Stick. Sci. Am. 1978;238:86–95. doi: 10.1038/scientificamerican0178-86. - DOI - PubMed
    1. Costerton J.W., Lewandowski Z., Caldwell D.E., Korber D.R., Lappin-Scott H.M. Microbial Biofilms. Annu. Rev. Microbiol. 1995;49:711–745. doi: 10.1146/annurev.mi.49.100195.003431. - DOI - PubMed
    1. Kolenbrander P.E. Oral Microbial Communities: Biofilms, Interactions, and Genetic Systems. Annu. Rev. Microbiol. 2000;54:413–437. doi: 10.1146/annurev.micro.54.1.413. - DOI - PubMed
    1. Shapiro J.A. Thinking about bacterial populations as multicellular organisms. Annu. Rev. Microbiol. 1998;52:81–104. doi: 10.1146/annurev.micro.52.1.81. - DOI - PubMed
    1. Di Martino P. Extracellular polymeric substances, a key element in understanding biofilm phenotype. AIMS Microbiol. 2018;4:274–288. doi: 10.3934/microbiol.2018.2.274. - DOI - PMC - PubMed

LinkOut - more resources