. 2021 Jan 12;11(1):50.
doi: 10.3390/metabo11010050.

In Vivo Metabolism of [1,6-13C2]Glucose Reveals Distinct Neuroenergetic Functionality between Mouse Hippocampus and Hypothalamus

Affiliations

In Vivo Metabolism of [1,6-13C2]Glucose Reveals Distinct Neuroenergetic Functionality between Mouse Hippocampus and Hypothalamus

Antoine Cherix et al. Metabolites. .

Abstract

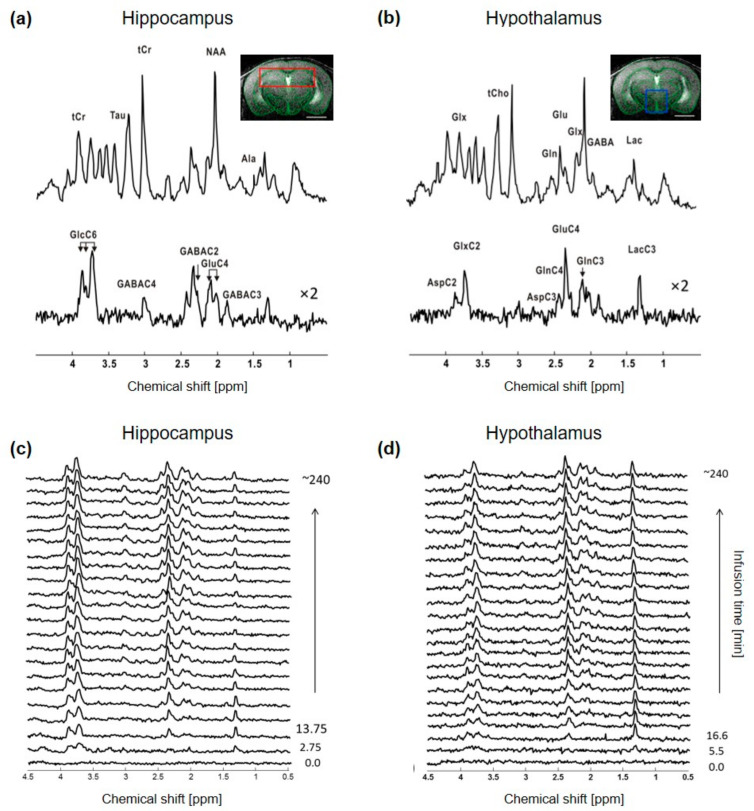
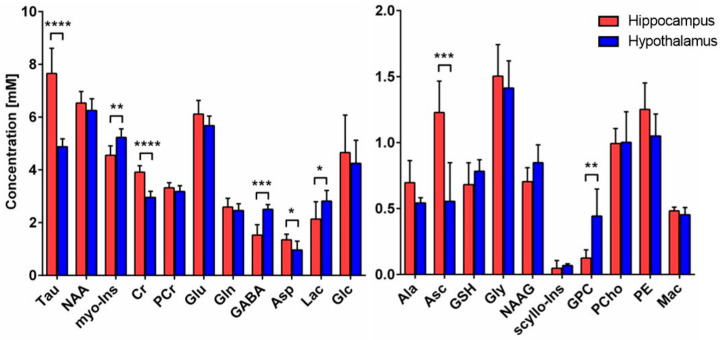
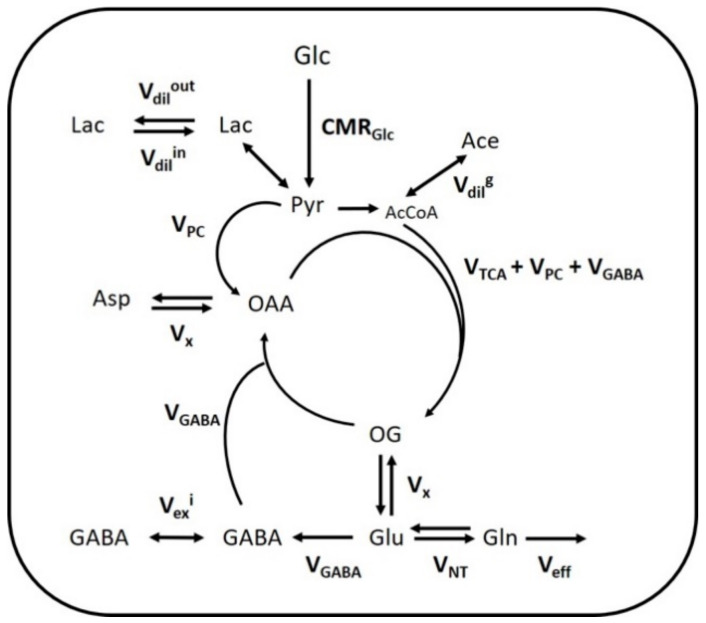
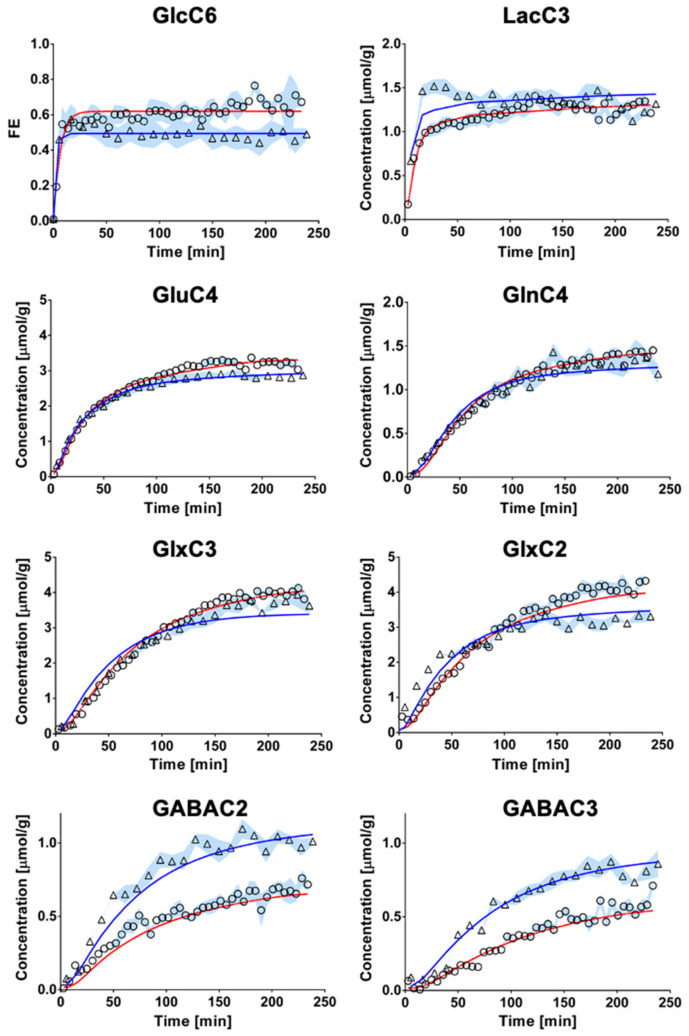
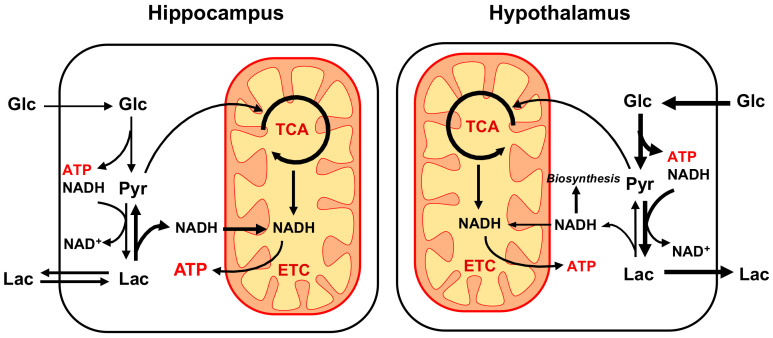
Glucose is a major energy fuel for the brain, however, less is known about specificities of its metabolism in distinct cerebral areas. Here we examined the regional differences in glucose utilization between the hypothalamus and hippocampus using in vivo indirect 13C magnetic resonance spectroscopy (1H-[13C]-MRS) upon infusion of [1,6-13C2]glucose. Using a metabolic flux analysis with a 1-compartment mathematical model of brain metabolism, we report that compared to hippocampus, hypothalamus shows higher levels of aerobic glycolysis associated with a marked gamma-aminobutyric acid-ergic (GABAergic) and astrocytic metabolic dependence. In addition, our analysis suggests a higher rate of ATP production in hypothalamus that is accompanied by an excess of cytosolic nicotinamide adenine dinucleotide (NADH) production that does not fuel mitochondria via the malate-aspartate shuttle (MAS). In conclusion, our results reveal significant metabolic differences, which might be attributable to respective cell populations or functional features of both structures.

Keywords: 13C-MRS; brain metabolism; in vivo imaging; mathematical modeling; metabolic flux analysis.


Conflict of interest statement

The authors declare no conflict of interest. Wuhan United Imaging Life Science Instruments Ltd. has played no role in this research.

Figures

Figure 1
Figure 1
In vivo 1H-[13C]-MRS acquisition in mouse hippocampus and hypothalamus. Typical 1H-[13C]-MRS spectra of (a) hippocampus and (b) hypothalamus of a mouse. The non-edited (top) and edited (bottom) spectra are presented with a Lorentzian apodization of 1 Hz for hippocampus and 2 Hz for hypothalamus and the volume of interest (VOI) is shown in the anatomical image for hippocampus (red, (a) panel) and hypothalamus (blue, (b) panel). Peak labeling was distributed between the two spectra to avoid over-crowding. Abbreviations: Ala, alanine; Asp, aspartate; Gln, glutamine; Glu, glutamate; Glx, glutamine + glutamate; Tau, taurine; tCr, total creatine; GABA, γ-aminobutyric acid; Lac, lactate; Glc, glucose. Proton resonances bound to specific carbon are indicated by C and followed by the position number, e.g., C2, C3 and C4 etc. Timeline of typical edited spectra of (c) hippocampus and (d) hypothalamus showing glucose 13C labeling incorporation to its downstream brain metabolites throughout the infusion time (minutes). In (c), every other edited 1H-[13C]-MRS spectra were displayed. All spectra are shown with 5 Hz Lorentzian apodization.
Figure 2
Figure 2
Neurochemical differences between hippocampus and hypothalamus. Neurochemical differences between hippocampus (n = 8) and hypothalamus (n = 6) were assessed using Student t-test; * p < 0.05; ** p < 0.01; *** p < 0.001; **** p < 0.0001. Data are presented as mean ± SD. Abbreviations: Tau, taurine; NAA, N-acetyl aspartate; myo-Ins, myo-inositol; Cr, creatine; PCr, phosphocreatine, Glu glutamate; Gln, glutamine; GABA, γ-aminobutyric acid; Asp, aspartate; Lac, lactate; Glc, glucose; Ala, alanine; Asc, ascorbate; GSH, glutathione; Gly, glycine; NAAG, N-acetylaspartyl glutamate; scyllo-Ins, scyllo-inositol; GPC, glycerophosphorylcholine; PCho, phosphocholine; PE, phosphoethanolamine; Mac, macromolecules.
Figure 3
Figure 3
Mathematical 1-compartment model of brain metabolism assessed with [1,6-13C2]Glc. Labeled and non-labeled glucose (Glc) is metabolized to pyruvate (Pyr) in the brain, which corresponds to the cerebral metabolic rate of glucose (CMRGlc). Pyruvate, in fast exchange with lactate (Lac), can either exchange with blood lactate (via Vdilin or Vdilout), be carboxylated into oxaloacetate (OAA) in glial cells (via VPC) or enter mitochondrial tricarboxylic acid (TCA) cycle (via VTCA). Dilution can occur in the acetyl-CoA (AcCoA) pool produced from pyruvate, by exchange with ketone bodies, acetate (Ace) or glial-specific metabolism (via Vdilg). Transamination in the mitochondria (Vx) lead to the exchange of labeling from OAA and oxoglutarate (OG) with aspartate (Asp) and glutamate (Glu) respectively. Glu labels glutamine (Gln) through the neurotransmitter cycling flux (VNT), and the excess Gln is released in the blood (Veff) to maintain anaplerotic balance. In inhibitory neurons, Glu-GABA flux (VGABA) corresponds to the synthesis of GABA from Glu and its recycling into the TCA cycle. Due to potential compartmentation of GABA metabolic pools, an exchange flux can occur, leading to GABA labeling dilution (Vexi).
Figure 4
Figure 4
Fitting of the 1-compartment model of brain metabolism to hippocampal and hypothalamic metabolic 13C-labeling curves. Hippocampal (circles) and hypothalamic (triangle) 13C-labeling curves (mean ± SD) were analyzed with a 1-compartment model of brain metabolism. The resulting overall fit of hippocampus (red line) was comparable to that of hypothalamus (blue line) in terms of goodness-of-fit (hippocampus, R2= 0.994; hypothalamus, R2 = 0.973).
Figure 5
Figure 5
Schematic representation of main energy metabolic differences observed between hippocampus and hypothalamus using 1H-[13C]-MRS. Overall, energy production rate appears to be higher in hypothalamus (hippo: 20.5 vs. hypo: 23.7 μmol ATP/g/min) with a distinct metabolic organization. While tricarboxylic acid (TCA) cycle is comparable between structures, suggesting similar mitochondrial NADH production and oxidation, hippocampus relies significantly less on glycolysis to produce energy. The resulting lack of cytoplasmic ATP and NADH produced in the hippocampus are likely to be compensated by blood lactate influx that can provide NADH to be oxidized by the electron transport chain (ETC) in a process involving the malate-aspartate shuttle (MAS). As a result, the glycolysis-based metabolism of hypothalamus might produce more lactate and cytoplasmic NADH that is available for biosynthetic purpose.

Similar articles

Cited by

References

    1. Raichle M.E., Gusnard D.A. Appraising the brain’s energy budget. Proc. Natl. Acad. Sci. USA. 2002;99:10237–10239. doi: 10.1073/pnas.172399499. - DOI - PMC - PubMed
    1. Kleinridders A., Ferris H.A., Reyzer M.L., Rath M., Soto M., Manier M.L., Spraggins J.M., Yang Z., Stanton R.C., Caprioli R.M., et al. Regional differences in brain glucose metabolism determined by imaging mass spectrometry. Mol. Metab. 2018;12:113–121. doi: 10.1016/j.molmet.2018.03.013. - DOI - PMC - PubMed
    1. Burtscher J., Zangrandi L., Schwarzer C., Gnaiger E. Differences in mitochondrial function in homogenated samples from healthy and epileptic specific brain tissues revealed by high-resolution respirometry. Mitochondrion. 2015;25:104–112. doi: 10.1016/j.mito.2015.10.007. - DOI - PubMed
    1. Bao A.-M., Meynen G., Swaab D. The stress system in depression and neurodegeneration: Focus on the human hypothalamus. Brain Res. Rev. 2008;57:531–553. doi: 10.1016/j.brainresrev.2007.04.005. - DOI - PubMed
    1. McEwen B.S. Stress and hippocampal plasticity. Annu. Rev. Neurosci. 1999;22:105–122. doi: 10.1146/annurev.neuro.22.1.105. - DOI - PubMed

LinkOut - more resources