Circulating microRNA: The Potential Novel Diagnostic Biomarkers to Predict Drug Resistance in Temporal Lobe Epilepsy, a Pilot Study
- PMID: 33445780
- PMCID: PMC7828221
- DOI: 10.3390/ijms22020702
Circulating microRNA: The Potential Novel Diagnostic Biomarkers to Predict Drug Resistance in Temporal Lobe Epilepsy, a Pilot Study
Abstract
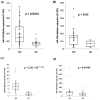
MicroRNAs (miRNAs) are small noncoding RNAs that have emerged as new potential epigenetic biomarkers. Here, we evaluate the efficacy of six circulating miRNA previously described in the literature as biomarkers for the diagnosis of temporal lobe epilepsy (TLE) and/or as predictive biomarkers to antiepileptic drug response. We measured the differences in serum miRNA levels by quantitative reverse transcriptase polymerase chain reaction (qRT-PCR) assays in a cohort of 27 patients (14 women and 13 men; mean ± SD age: 43.65 ± 17.07) with TLE compared to 20 healthy controls (HC) matched for sex, age and ethnicity (11 women and 9 men; mean ± SD age: 47.5 ± 9.1). Additionally, patients were classified according to whether they had drug-responsive (n = 17) or drug-resistant (n = 10) TLE. We have investigated any correlations between miRNAs and several electroclinical parameters. Three miRNAs (miR-142, miR-146a, miR-223) were significantly upregulated in patients (expressed as average expression ± SD). In detail, miR-142 expression was 0.40 ± 0.29 versus 0.16 ± 0.10 in TLE patients compared to HC (t-test, p < 0.01), miR-146a expression was 0.15 ± 0.11 versus 0.07 ± 0.04 (t-test, p < 0.05), and miR-223 expression was 6.21 ± 3.65 versus 1.23 ± 0.84 (t-test, p < 0.001). Moreover, results obtained from a logistic regression model showed the good performance of miR-142 and miR-223 in distinguishing drug-sensitive vs. drug-resistant TLE. The results of this pilot study give evidence that miRNAs are suitable targets in TLE and offer the rationale for further confirmation studies in larger epilepsy cohorts.
Keywords: ASMs; antiseizure medications; diagnosis; miRNAs; prognosis; temporal lobe epilepsy.
Conflict of interest statement
The authors declare no conflict of interest.
Figures


References
-
- Coan A.C., Campos B.M., Yasuda C.L., Kubota B.Y., Bergo F.P., Guerreiro C.A., Cendes F. Frequent seizures are associated with a network of gray matter atrophy in temporal lobe epilepsy with or without hippocampal sclerosis. PLoS ONE. 2014;9:e85843. doi: 10.1371/journal.pone.0085843. - DOI - PMC - PubMed
MeSH terms
Substances
LinkOut - more resources
Full Text Sources
Other Literature Sources

