Review
. 2021 Feb 10;121(3):1746-1803.
doi: 10.1021/acs.chemrev.0c00779. Epub 2021 Jan 14.

The Use of Alternative Strategies for Enhanced Nanoparticle Delivery to Solid Tumors

Affiliations
Review

The Use of Alternative Strategies for Enhanced Nanoparticle Delivery to Solid Tumors

Mukaddes Izci et al. Chem Rev. .

Abstract

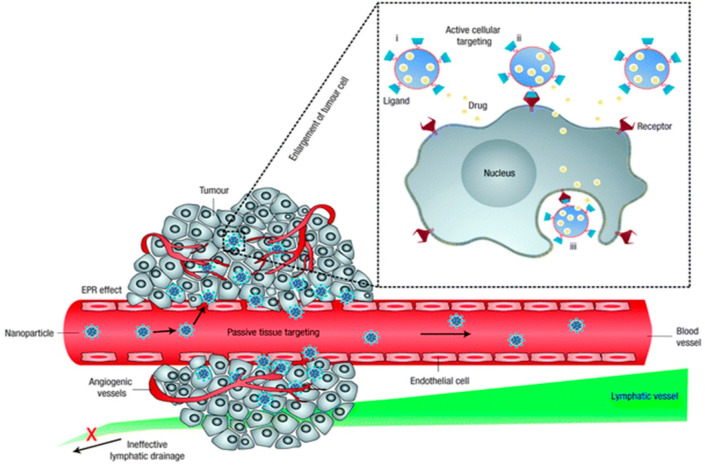
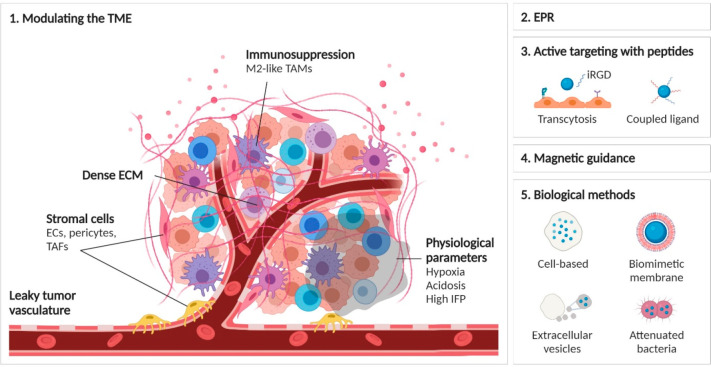
Nanomaterial (NM) delivery to solid tumors has been the focus of intense research for over a decade. Classically, scientists have tried to improve NM delivery by employing passive or active targeting strategies, making use of the so-called enhanced permeability and retention (EPR) effect. This phenomenon is made possible due to the leaky tumor vasculature through which NMs can leave the bloodstream, traverse through the gaps in the endothelial lining of the vessels, and enter the tumor. Recent studies have shown that despite many efforts to employ the EPR effect, this process remains very poor. Furthermore, the role of the EPR effect has been called into question, where it has been suggested that NMs enter the tumor via active mechanisms and not through the endothelial gaps. In this review, we provide a short overview of the EPR and mechanisms to enhance it, after which we focus on alternative delivery strategies that do not solely rely on EPR in itself but can offer interesting pharmacological, physical, and biological solutions for enhanced delivery. We discuss the strengths and shortcomings of these different strategies and suggest combinatorial approaches as the ideal path forward.


Conflict of interest statement

The authors declare no competing financial interest.

Figures

Figure 1
Figure 1
Nanomaterials as carrier for drug delivery in cancer therapy. The biophysicochemical properties are also shown. Reproduced with permission from ref (15). Copyright 2014 Wiley VCH.
Chart 1
Chart 1. A Description of Common Factors Involved in NM Delivery to Solid Tumors
Figure 2
Figure 2
Passive and active tumor targeting. Passive tumor targeting is the extravasation of NM due the increased permeability of the tumor vessel together with a lower lymphatic drainage. This is also known as the EPR effect. Active cellular targeting is the surface functionalizing of NM with ligands to induce cell-specific recognition and binding. The contents of the NMs can be released close to the target cells (i), act as an extracellular release drug depot by attaching to the cell membrane (ii) or can also internalize into the cell (iii). Reproduced with permission from ref (11). Copyright 2007 Nature Publishing Group.
Figure 3
Figure 3
Schematic overview of the different methods used to enhance NM delivery to solid tumors. (1) Modulation of the tumor microenvironment and associated factors including stromal cells, immunomodulation, physiological parameters, or extracellular matrix density, as discussed in section 2 of this review. (2) The principle of enhanced permeability and retention and how to enhance or exploit it as discussed in section 3. (3) The use of multiple peptides or peptides aiming at enhancing transcytosis, as discussed in section 4. (4) The concept of magnetic targeting for enhanced tumor delivery as discussed in section 5. (5) The use of biological methods, including cellular hitchhiking of NMs, use of cell-based membranes for biomimetic coatings, the use of extracellular vesicles or attenuated bacteria to specifically guide NMs to the tumors, as discussed in section 6.
Figure 4
Figure 4
The impact of pharmaceutical vessel modulation on macro- and microtumor vasculature and on tumor-targeted drug delivery. During vessel permeabilization, the gaps between the endothelial cells are widened due the vasodilatation and increased gaps between endothelial and perivascular cells. Vessel normalization restores the morphology and functionality of the tumor vasculature by improving vascular perfusion and promoting vascular maturity. Vascular disruption tampers with the endothelial lining and reduces the perfusion (of immature vasculature), which enhances the vascular permeability. Vascular promotion increases vessel density and distribution leading to an enhanced relative blood volume in tumors. On the basis of the vascular characteristics of tumors, many pharmaceutical strategies could be used that have different effects on the penetration and accumulation of the drugs and drug delivery systems. Reproduced with permission from ref (36). Copyright 2017 Elsevier Publishing.
Figure 5
Figure 5
The three-step process of iRGD-enhanced tumor accumulation of silicasome-encapsulated drugs. IRGD binds first to αv integrins, followed by a protease cleavage of bound iRGD. This cleavage leads at the tumor site to a C-terminus CendR-contaning fragment of iRGD. Finally, this CendR fragment binds to NRP-1 receptor, which further induces transcytosis through the vessel endothelium and promotes thus the uptake of the silicasome. Cargo is delivered directly to the target tumor. Reproduced with permission from ref (197). Copyright 2017 American Society for Clinical Investigation.
Figure 6
Figure 6
Time-dependent in vivo breast tumor imaging with etchable ZHS-QDs. Normal mice and mice bearing orthotopic MCF10CA1a human breast tumors received an intravenous injection of iRGD, CRGDC, or PBS before intravenous ZHS-QD injection. Ag-TS or PBS was given intraperitoneally. n = 4 per group. (a) The mice were anesthetized and imaged from the ventral side with a Li-Cor Pearl imager under 800 nm channel at the indicated time points. Arrows, tumors. (b) NIR signals in the tumor per unit area plotted against time. (c) Time-dependent changes of CI in the tumor area. Statistics, two-way analysis of variance; error bars, SEM; ns, not significant; ***P < 0.001. Reproduced with permission from ref (207). Copyright 2017 Nature Publishing group.
Figure 7
Figure 7
Evaluation of the ability of the dual-ligand nanoparticles to target metastasis in vivo in the MDA-MB-231 mouse model. (a) The synopsis shows the timeline and schedule of the in vivo imaging studies. After 25 days from systemic injection of MDA-MB-231 cells via the tail vein, bioluminescence imaging (BLI) showed the development of metastasis in the lungs. Each metastatic site was numbered, which is indicated on the BLI images. (b) Representative fluorescence molecular tomography (FMT) images of the mouse with metastatic spots 4 and 5. FMT imaging was performed 3 h after injection of a cocktail of RGD-NP, PSN-NP, and dual-ligand-NP. (c) Using the different NIR fluorophores on each nanoparticle variant, the fluorescence signal in the thoracic region of the FMT images was quantified for each formulation (n = 5 mice). On the basis of phantom measurements of each formulation using the FMT system, the fluorescence signal was converted to nanoparticle concentration (mean ± SD; y-axis is in logarithmic scale). (d) Total number of nanoparticles for PSN-NP, RGD-NP, and dual-ligand-NP is shown for each metastatic spot (y-axis is in logarithmic scale). Reproduced with permission from ref (211). Copyright 2015 American Chemical Society.
Figure 8
Figure 8
Quantitative evaluation of the ability of the nanoparticle targeting variants to target metastasis in the 4T1 mouse model. (a) Each formulation was systemically administered via a tail vein injection at the same dose (NT-NP indicates the nontargeted nanoparticle). The fluorescence signal of the fluorescence images of the lung sections was quantified for each formulation at 3 h after injection (n = 5 mice). On the basis of phantom measurements of each formulation using the IVIS imaging system, the fluorescence signal was converted to nanoparticle concentration (mean ± SD; * indicates p < 0.05 by Student’s t test; n = 4–6 mice per group). (b) Bioluminescence signal from the thoracic region of each animal was quantified and summarized for each group, representing the metastatic burden of the different groups used in the targeting studies. Data are presented as mean ± SD. (c) Nanoparticle deposition of the nanoparticle targeting variants in lung metastasis is presented separately for each animal. (d) Organ distribution of NT-NP and CREKA-NP was evaluated in the 4T1 mouse model (n = 5). Reproduced with permission from ref (227). Copyright 2018 Royal Society of Chemistry.
Figure 9
Figure 9
In vivo magnetic targeting assessment of m-NC-111In with increasing amounts of SPION in CT26 tumor-bearing BALB/c mice under the influence of an 8 mm diameter magnet (0.43 T). Mice were iv injected with indium-111 labeled NC 1–5. A permanent magnet (0.43 T, 8 mm in diameter) was applied at one tumor site (TU+) for 1 h, and organs were excised at 24 h postinjection. (a) Blood clearance profiles. (b) Excretion profiles. (c) Organ biodistribution profile. (d) Tumor accumulation profiles. (e) Magnetic targeting efficacy. (f) In vivo single-photon emission computed tomography-computed tomography (SPECT-CT) imaging of m-NC 4–111In. (g) In vivo T2-weighted MR imaging of m-NC 4–111In. Cross sections in (f) were from lung (LU), liver (LI), spleen (SP), kidney (KI), nonmagnetically targeted tumor (TU-), and magnetically targeted tumor (TU+) at equivalent time points. Tumors in (f) and (g) are marked in dashed lines. Results are expressed as % ID/g of organ as mean ± SEM (n = 3). One-way ANOVA was performed using IBM SPSS Statistics software followed by Tukey’s multiple comparison test (*, p < 0.05; **, p < 0.01). Reproduced with permission from ref (233). Copyright 2016 American Chemical Society.
Figure 10
Figure 10
(a) Polystyrene NPs (PS-NPs) were covalently coated with either IgG or anti-PECAM lung affinity moieties, labeled with trace amounts of I-125-IgG and IV injected into mice either alone or hitchhiked onto RBCs (R-H). Shown is the percent injected I-125 dose (%ID) for each organ, as well as the lung-to-liver %ID ratios for each group. (b) %ID in the lungs for the different types of nanocarriers (NCs) either freely administered or adsorbed onto RBCs. (c) Lung-to-liver and lung-to-blood ratios for the RH NCs that displayed the highest lung uptake (liposomes and nanogels). (d) %ID per organ for mice injected with free or RH nanogels that were either bare or coated with random rat IgG, anti-PECAM, or anti-ICAM. Reproduced with permission from ref (253) Copyright 2018 Nature Publishing Group.
Figure 11
Figure 11
(a) Experimental timeline in which B16F10 melanoma tumor-bearing mice were sublethally lymphodepleted by irradiation and administered Thy1.1+CD8+ T cells the next day either alone, with free interleukin-15 superagonist (IL-15Sa) or backpacked with protein nanogels carrying IL-15Sa and anchored by maleimide chemistry to T cell CD45 receptors (aCD45/IL-15Sa-NGs). Mice were sacrificed and tissues were processed and analyzed by flow cytometry 7 days later. (b) Flow cytometry graphs displaying the frequency of tumor-infiltrating T cells among all the lymphocytes for the different groups. (c–f) Number of adoptively transferred (ACT) and endogenous T cells in blood (c), nontumor draining lymph nodes (non-TDLNs, d), TDLNs (e), and tumors (f). (g) Ratio of counts of ACT T cells in the nanogel-treated group relative to the free IL-15Sa-treated group in the different tissues. (h–j) Counts of proliferation marker Ki67+ (h), granzyme-B+ (i), and polyfunctional (j) ACT T cells in tumors for the different treated groups. Reproduced with permission from ref (290). Copyright 2018 Nature Publishing Group.
Figure 12
Figure 12
(A) Experimental setup for testing the in vivo effect of MSCs loaded with Ce6-grafted polydopamine NPs (PDA-Ce6) on tumor growth with or without irradiation with PDT/PTT. (B) Harvested lung tumors on day 15 post B16F10 murine melanoma injection. (C–F) Count of metastatic colonies (C), lung weights (D), Kaplan–Meier survival curves (E), and median survival times for each group (F). This figure has been reproduced with permission from ref (307). Copyright 2020 Royal Society of Chemistry.
Figure 13
Figure 13
(A,B) Increased internalization of DOX-loaded magnetic iron oxide NPs (MNPs) coated with membrane fragments of UM-SCC-7 (A) and HeLa (B) cells in homotypic cancer cells compared to other cell lines. (C) Viability of UM-SCC-7 cells upon 3 and 6 h exposure to DOX-loaded MNPs coated with membranes obtained from different cell lines (UM-SCC-7, COS7, and HeLa). (D,F) Relative tumor volumes (D) and body weights (F) upon treatment of UM-SCC-7 tumor-bearing mice with variations of MNPs with or without targeting by application of an external magnetic field (MF) on days indicated by the red arrows. (E) Average tumor weight measured on day 12 post treatment. (G) Photograph of UM-SCC-7 tumor-bearing mice and tumors on day 12 post treatment for each of the different groups (a = PBS, b = DOX, c = @HeLa, d = @COS7, e = @UM-SCC-7, f = @UM-SCC-7 + MF). Reproduced with permission from ref (342). Copyright 2016 American Chemical Society.
Figure 14
Figure 14
(a,b) Peritumorally injected MC-1 cells localize in hypoxic regions (brown islands) of mouse xenografts. (c) Fluorescent images of MC-1 bacteria stained with FITC-conjugated secondary antibodies in adjacent sections of the same xenografts. (d) TEM images of MC-1 bacteria highlighting the presence of magnetosomes. Reproduced with permission from ref (365). Copyright 2016 Nature Publishing Group.
Figure 15
Figure 15
Number of publications reporting blood incompatibilities in vivo (a) and in vitro (b) for different types of nanomaterials. This image has been reproduced with permission from ref (383). Copyright 2019 Wiley-VCH.

Similar articles

Cited by

References

    1. Fenton O. S.; Olafson K. N.; Pillai P. S.; Mitchell M. J.; Langer R. Advances in Biomaterials for Drug Delivery. Adv. Mater. 2018, 30, e1705328.10.1002/adma.201705328. - DOI - PMC - PubMed
    1. Salata O. Applications of Nanoparticles in Biology and Medicine. J. Nanobiotechnol. 2004, 2, 3.10.1186/1477-3155-2-3. - DOI - PMC - PubMed
    1. Anselmo A. C.; Mitragotri S. Nanoparticles in the Clinic: An Update. Bioeng. Transl. Med. 2019, 4, e10143.10.1002/btm2.10143. - DOI - PMC - PubMed
    1. Anselmo A. C.; Mitragotri S. An Overview of Clinical and Commercial Impact of Drug Delivery Systems. J. Controlled Release 2014, 190, 15–28. 10.1016/j.jconrel.2014.03.053. - DOI - PMC - PubMed
    1. Torchilin V. P. Multifunctional, Stimuli-Sensitive Nanoparticulate Systems for Drug Delivery. Nat. Rev. Drug Discovery 2014, 13, 813–827. 10.1038/nrd4333. - DOI - PMC - PubMed

Publication types