

The role of ultrasonographic lung aeration score in the prediction of postoperative pulmonary complications: an observational study
- PMID: 33446103
- PMCID: PMC7807225
- DOI: 10.1186/s12871-021-01236-6
The role of ultrasonographic lung aeration score in the prediction of postoperative pulmonary complications: an observational study
Abstract
Background: Postoperative pulmonary complications (PPCs) are important contributors to mortality and morbidity after surgery. The available predicting models are useful in preoperative risk assessment, but there is a need for validated tools for the early postoperative period as well. Lung ultrasound is becoming popular in intensive and perioperative care and there is a growing interest to evaluate its role in the detection of postoperative pulmonary pathologies.
Objectives: We aimed to identify characteristics with the potential of recognizing patients at risk by comparing the lung ultrasound scores (LUS) of patients with/without PPC in a 24-h postoperative timeframe.
Methods: Observational study at a university clinic. We recruited ASA 2-3 patients undergoing elective major abdominal surgery under general anaesthesia. LUS was assessed preoperatively, and also 1 and 24 h after surgery. Baseline and operative characteristics were also collected. A one-week follow up identified PPC+ and PPC- patients. Significantly differing LUS values underwent ROC analysis. A multi-variate logistic regression analysis with forward stepwise model building was performed to find independent predictors of PPCs.
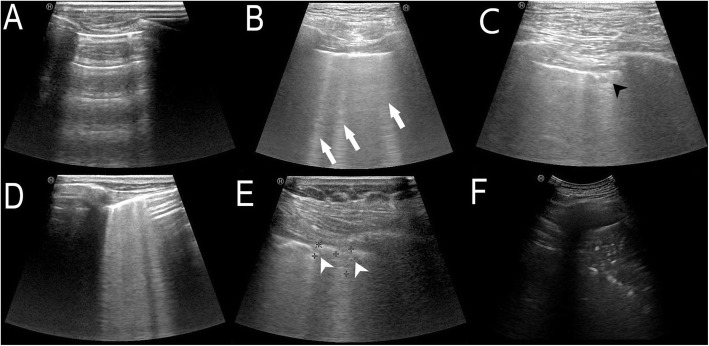
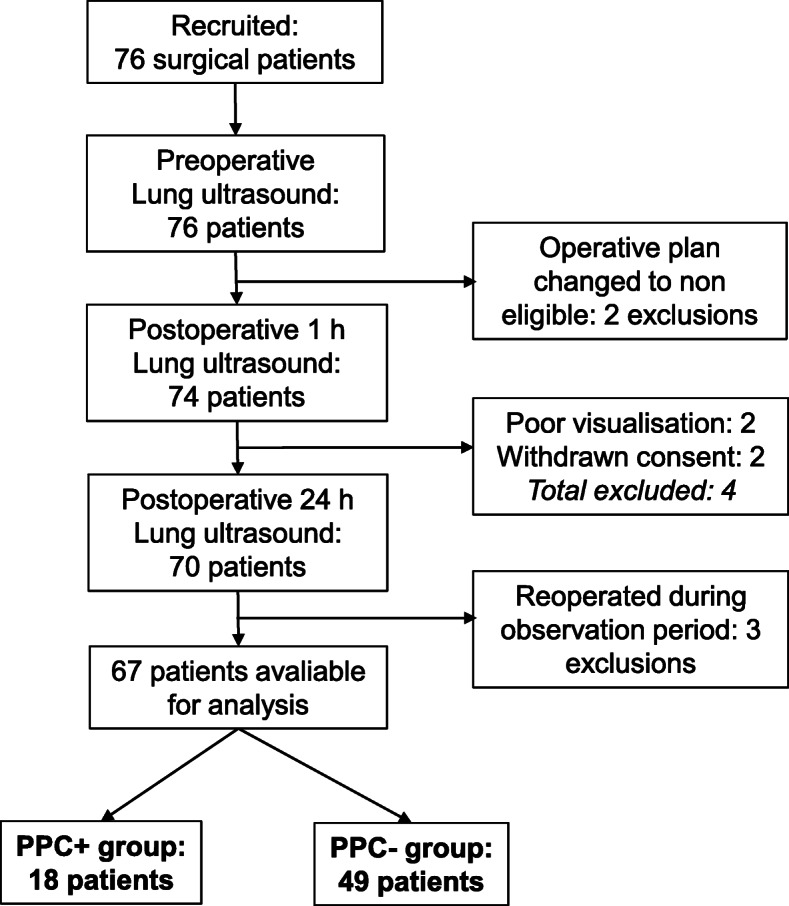
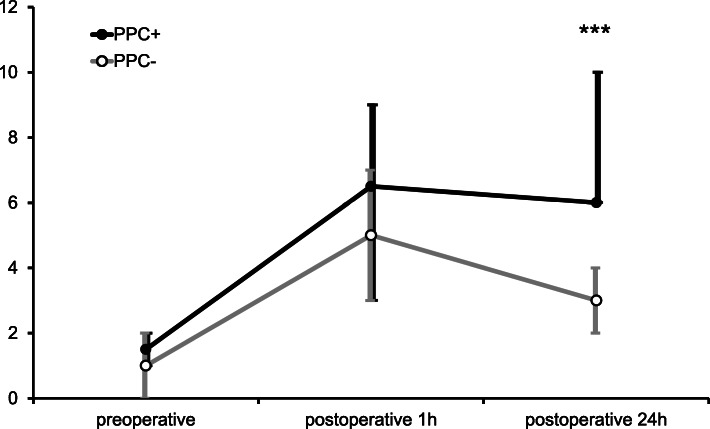
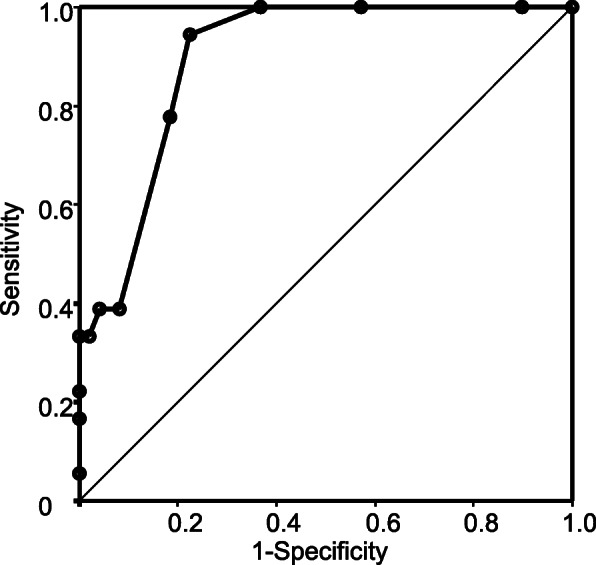
Results: Out of the 77 recruited patients, 67 were included in the study. We evaluated 18 patients in the PPC+ and 49 in the PPC- group. Mean ages were 68.4 ± 10.2 and 66.4 ± 9.6 years, respectively (p = 0.4829). Patients conforming to ASA 3 class were significantly more represented in the PPC+ group (66.7 and 26.5%; p = 0.0026). LUS at baseline and in the postoperative hour were similar in both populations. The median LUS at 0 h was 1.5 (IQR 1-2) and 1 (IQR 0-2; p = 0.4625) in the PPC+ and PPC- groups, respectively. In the first postoperative hour, both groups had a marked increase, resulting in scores of 6.5 (IQR 3-9) and 5 (IQR 3-7; p = 0.1925). However, in the 24th hour, median LUS were significantly higher in the PPC+ group (6; IQR 6-10 vs 3; IQR 2-4; p < 0.0001) and it was an independent risk factor (OR = 2.6448 CI95% 1.5555-4.4971; p = 0.0003). ROC analysis identified the optimal cut-off at 5 points with high sensitivity (0.9444) and good specificity (0.7755).
Conclusion: Postoperative LUS at 24 h can identify patients at risk of or in an early phase of PPCs.
Keywords: Lung ultrasound; Perioperative care; Point-of-care ultrasound; Postoperative pulmonary complications; Ultrasonography.
Conflict of interest statement
The authors declare that they have no competing interests.
Figures
Similar articles
-
Can the lung ultrasound score predict pulmonary complications after non-thoracic surgery in patients with blunt thoracic trauma: A single-center observational study.J Clin Anesth. 2024 Dec;99:111675. doi: 10.1016/j.jclinane.2024.111675. Epub 2024 Nov 5. J Clin Anesth. 2024. PMID: 39504920
-
Lung ultrasound on first postoperative day predicts out-of-hospital pulmonary complications following video-assisted thoracic surgery: A prospective cohort study.Eur J Anaesthesiol. 2025 Apr 1;42(4):347-356. doi: 10.1097/EJA.0000000000002113. Epub 2024 Dec 18. Eur J Anaesthesiol. 2025. PMID: 39698857
-
Role of Lung Ultrasound in the Detection of Postoperative Pulmonary Complications in Pediatric Patients: A Prospective Observational Study.J Cardiothorac Vasc Anesth. 2021 May;35(5):1360-1368. doi: 10.1053/j.jvca.2020.09.106. Epub 2020 Sep 16. J Cardiothorac Vasc Anesth. 2021. PMID: 33036888
-
The sound of air: point-of-care lung ultrasound in perioperative medicine.Can J Anaesth. 2018 Apr;65(4):399-416. doi: 10.1007/s12630-018-1062-x. Epub 2018 Feb 6. Can J Anaesth. 2018. PMID: 29411300 Review. English.
-
The role of lung ultrasound for detecting atelectasis, consolidation, and/or pneumonia in the adult cardiac surgery population: A scoping review of the literature.Aust Crit Care. 2024 Jan;37(1):193-201. doi: 10.1016/j.aucc.2023.08.002. Epub 2023 Sep 13. Aust Crit Care. 2024. PMID: 37709655
Cited by
-
Effect of Sugammadex versus neostigmine reversal on lung aeration score after operative fixation of cervical spine: A prospective, double blinded, randomised control trial.J Anaesthesiol Clin Pharmacol. 2025 Jul-Sep;41(3):523-531. doi: 10.4103/joacp.joacp_513_24. Epub 2025 Mar 22. J Anaesthesiol Clin Pharmacol. 2025. PMID: 40635839 Free PMC article.
-
Reliability and clinical correlations of semi-quantitative lung ultrasound on BLUE points in COVID-19 mechanically ventilated patients: The 'BLUE-LUSS'-A feasibility clinical study.PLoS One. 2022 Oct 14;17(10):e0276213. doi: 10.1371/journal.pone.0276213. eCollection 2022. PLoS One. 2022. PMID: 36240250 Free PMC article.
-
Impact of staged goal-directed fluid therapy on postoperative pulmonary complications in patients undergoing McKeown esophagectomy: a randomized controlled trial.BMC Anesthesiol. 2024 Sep 17;24(1):330. doi: 10.1186/s12871-024-02719-y. BMC Anesthesiol. 2024. PMID: 39289608 Free PMC article. Clinical Trial.
-
Association of point-of-care lung ultrasound findings with 30-day pulmonary complications after cardiac surgery: A prospective cohort study.Heliyon. 2024 May 16;10(10):e31293. doi: 10.1016/j.heliyon.2024.e31293. eCollection 2024 May 30. Heliyon. 2024. PMID: 38813155 Free PMC article.
-
The Effects of a Pre-Extubation Single Recruitment Maneuver on Ultrasonographic Lung Conditions in Patients Undergoing Lateral Decubitus Surgery: A Randomized Clinical Trial.J Clin Med. 2025 Apr 25;14(9):2969. doi: 10.3390/jcm14092969. J Clin Med. 2025. PMID: 40364000 Free PMC article.
References
-
- Abbott TEF, Fowler AJ, Pelosi P, Gama de Abreu M, Moller AM, Canet J, Creagh-Brown B, Mythen M, Gin T, Lalu MM, et al. A systematic review and consensus definitions for standardised end-points in perioperative medicine: pulmonary complications. Br J Anaesth. 2018;120(5):1066–1079. doi: 10.1016/j.bja.2018.02.007. - DOI - PubMed
Publication types
MeSH terms
LinkOut - more resources
Full Text Sources
Other Literature Sources
Medical
