. 2021 Jan 14;20(1):10.
doi: 10.1186/s12938-020-00844-6.

Measuring implanted patient response to tone pips

Affiliations

Measuring implanted patient response to tone pips

Juan M Cornejo et al. Biomed Eng Online. .

Abstract

Background: An electrical potential not previously reported-electrical cochlear response (ECR)-observed only in implanted patients is described. Its amplitude and growth slope are a measurement of the stimulation achieved by a tone pip on the auditory nerve. The stimulation and recording system constructed for this purpose, the features of this potential obtained in a group of 43 children, and its possible clinical use are described. The ECR is obtained by averaging the EEG epochs acquired each time the cochlear implant (CI) processes a tone pip of known frequency and intensity when the patient is sleeping and using the CI in everyday mode. The ECR is sensitive to tone pip intensity level, microphone sensitivity, sound processor gain, dynamic range of electrical current, and responsiveness to electrical current of the auditory nerve portion involved with the electrode under test. It allows individual evaluation of intracochlear electrodes by choosing, one at the time, the central frequency of the electrode as the test tone pip frequency, so the ECR measurement due to a variable intensity tone pip allows to establish the suitability of the dynamic range of the electrode current.

Results: There is a difference in ECR measurements when patients are grouped based on their auditory behavior. The ECR slope and amplitude for the Sensitive group is 0.2 μV/dBHL and 10 μV at 50 dBHL compared with 0.04 μV/dBHL and 3 μV at 50dBHL for the Inconsistent group. The clinical cases show that adjusting the dynamic range of current based on the ECR improved the patient's auditory behavior.

Conclusions: ECR can be recorded regardless of the artifact due to the electromyographic activity of the patient and the functioning of the CI. Its amplitude and growth slope versus the intensity of the stimulus differs between electrodes. The relationship between minimum ECR detection intensity level and auditory threshold suggests the possibility of estimating patient auditory thresholds this way. ECR does not depend on the subject's age, cooperation, or health status. It can be obtained at any time after implant surgery and the test procedure is the same regardless of device manufacturer.

Keywords: Cochlear implant fitting; Current dynamic range; Objective test; Pediatric population.


Conflict of interest statement

The authors declare that they have no competing interests.

Figures

Fig. 1
Fig. 1
Typical electrical cochlear response (ECR) morphology. It is generated due to electrical stimulation delivered to the patient’s auditory nerve each time the CI process a tone pip of known frequency and intensity. The figure illustrates the ECR due to a 20 ms, 1518 Hz at 60 dBHL tone pip presented in sound field with patient using the device in everyday mode and positioned 0.60 m away from the sound source
Fig. 2
Fig. 2
Average ECR amplitude linear regression versus test tone pip intensity level according to patient auditory behavior. (♦) Inconsistent group, (■) acceptable group, and (▲) sensitive group. Notice that sensitive group shows higher sensibility to electric stimulation, m = 0.2 µV/dBHL, and higher ECR amplitude than inconsistent and acceptable groups
Fig. 3
Fig. 3
Bar graphs for threshold amplitude (a) and threshold intensity (b) according to patient auditory behavior
Fig. 4
Fig. 4
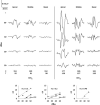
Case 1. Female user with quasi-normal auditory behavior. All electrodes show ECR morphology as described in Fig. 1 and ECR amplitude growing as test tone pip intensity level increases. For the same test tone pip intensity range and similar current dynamic range, the apical electrode shows higher growing slope, 0.5 µV/dBHL, than basal electrode, 0.1 µV/dBHL. Threshold intensity of 30 dBHL for apical electrode, and 20 dBHL for middle and basal electrodes
Fig. 5
Fig. 5
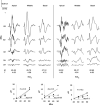
Case 2. Inconsistent auditory behavior. The ECR1 test result shows no recognized electrical activity for any electrode for a tone pip intensity level up to 50 dBHL. In ECR2, after 30 units increasing of the T level for all electrodes ECR was detected. Threshold intensity of 50 dBHL for apical electrode and 40 dBHL for middle and basal electrodes. However, ECR2 still shows low sensibility to electric current for all electrodes that reflects on low ECR amplitude compared to Case 1
Fig. 6
Fig. 6
Case 3. Deficient auditory behavior. ECR1 test result shows low ECR amplitude for all electrodes, with threshold intensity of 40 dBHL for apical and middle electrodes, and 50 dBHL for basal electrode. In ECR2 after increasing T and C level for all electrodes, the threshold intensity changes to 20, 30 years 40 dBHL for apical, middle and basal electrodes, respectively, and at the same time there is a general ECR amplitude increasing for all electrodes
Fig. 7
Fig. 7
Case 4. Sensible auditory behavior. ECR1 test result shows a threshold intensity of 20 dBHL for apical and middle electrodes, and 30 dBHL for basal electrode with slope and amplitude ECR higher than previous cases for all electrodes. After decreasing M level and keeping T level nearly unchanged for all electrodes, ECR2 test result shows a threshold intensity of 20 dBHL and a significant ECR slope and amplitude reduction for all electrodes. Apical electrode initial artifact is typical for this device brand
Fig. 8
Fig. 8
Experimental setup and block diagram of the system for ECR acquisition and recording. Patient asleep inside the audiometric test booth (D) and using the device in everyday operating mode. Four scalp EEG electrodes for two differential recording channels. (A) Stimulation module. Consist of a digital programmable tone pip’s generator, digital attenuator, audio power amplifier and loudspeaker. (B) Acquisition module. Consist of two EEG amplifiers, 30–500 Hz wide band, 0.1–300 Hz LPF, 12 dB/Octave and A/D converter. (C) Personal computer

References

    1. McKay CM, Smale N. The relation between ECAP measurements and the effect of rate on behavioral thresholds in cochlear implant users. Hear Res. 2017;346:62–70. doi: 10.1016/j.heares.2017.02.009. - DOI - PubMed
    1. Guenser G, Laudanski J, Phillipon B, Backus BC, Bordure P, Romanet P, et al. The relationship between electrical auditory brainstem responses and perceptual thresholds in Digisonic® SP cochlear implant users. Cochlear Implants Int. 2015;16(1):32–38. doi: 10.1179/1754762814y.0000000082. - DOI - PubMed
    1. Gordon KA, Papsin BC, Harrison RV. Toward a battery of behavioral and objective measures to achieve optimal cochlear implant stimulation levels in children. Ear Hear. 2004;25(5):447–63. https://www.ncbi.nlm.nih.gov/pubmed/15599192. - PubMed
    1. de Andrade KCL, Muniz LF, Menezes PL, Neto SDSC, Carnaúba ATL, Leal MC. The value of electrically evoked stapedius reflex in determining the maximum comfort level of a cochlear implant. J Am Acad Audiol. 2018;29(4):292–299. doi: 10.3766/jaaa.16117. - DOI - PubMed
    1. Raghunandhan S, Ravikumar A, Kameswaran M, Mandke K, Ranjith R. Electrophysiological correlates of behavioral comfort levels in cochlear implantees: a prospective study. Indian J Otolaryngol Head Neck Surg. 2015;67(3):210–222. doi: 10.1179/1754762814Y.0000000064. - DOI - PMC - PubMed