. 2021 Jan 14;14(1):16.
doi: 10.1186/s13045-020-01029-3.

STOML2 potentiates metastasis of hepatocellular carcinoma by promoting PINK1-mediated mitophagy and regulates sensitivity to lenvatinib

Affiliations

STOML2 potentiates metastasis of hepatocellular carcinoma by promoting PINK1-mediated mitophagy and regulates sensitivity to lenvatinib

Yahui Zheng et al. J Hematol Oncol. .

Abstract

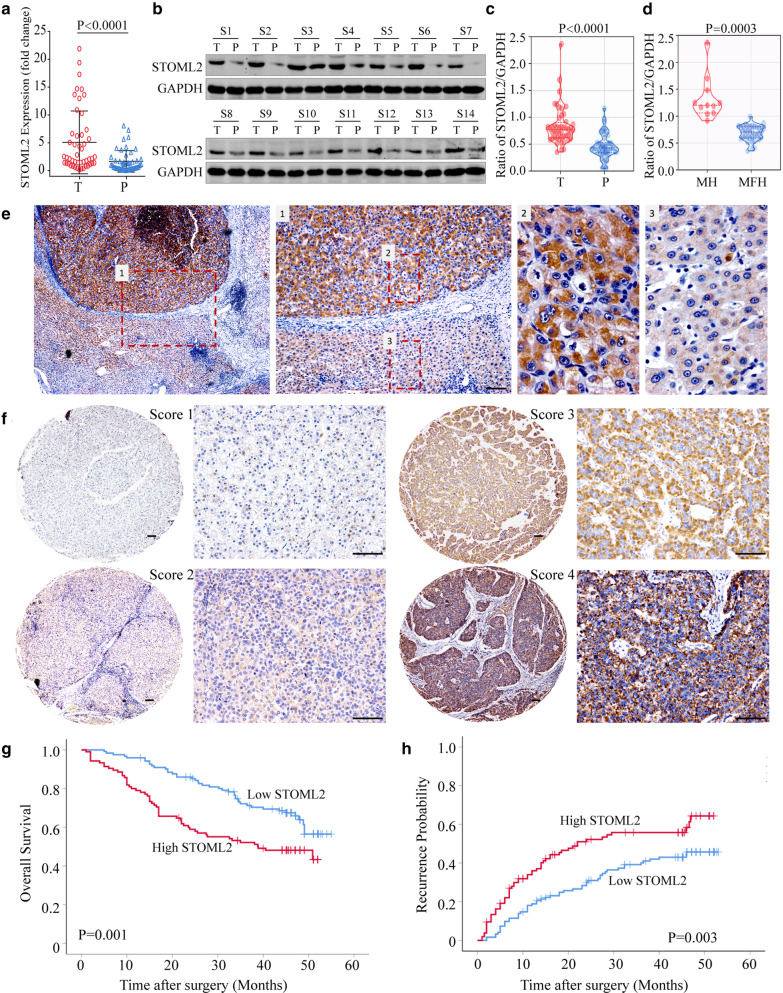
Background: Dysregulation of both mitochondrial biogenesis and mitophagy is critical to sustain oncogenic signaling pathways. However, the mechanism of mitophagy in promoting hepatocellular carcinoma (HCC) progression remains poorly understood. In this study, we investigated the clinical significance and biological involvement of mitochondrial inner membrane protein STOML2 in HCC.

Methods: STOML2 was identified by gene expression profiles of HCC tissues and was measured in tissue microarray and cell lines. Gain/loss-of-function experiment was applied to study the biological function of STOML2 in HCC. Flow cytometry, Western blotting, laser confocal microscopy, transmission electron microscopy, and co-immunoprecipitation were used to detect and analyze mitophagy. ChIP and luciferase reporter assay were conducted to evaluate the relationship between STOML2 and HIF-1α. The sensitivity to lenvatinib was assessed in HCC both in vitro and in vivo.

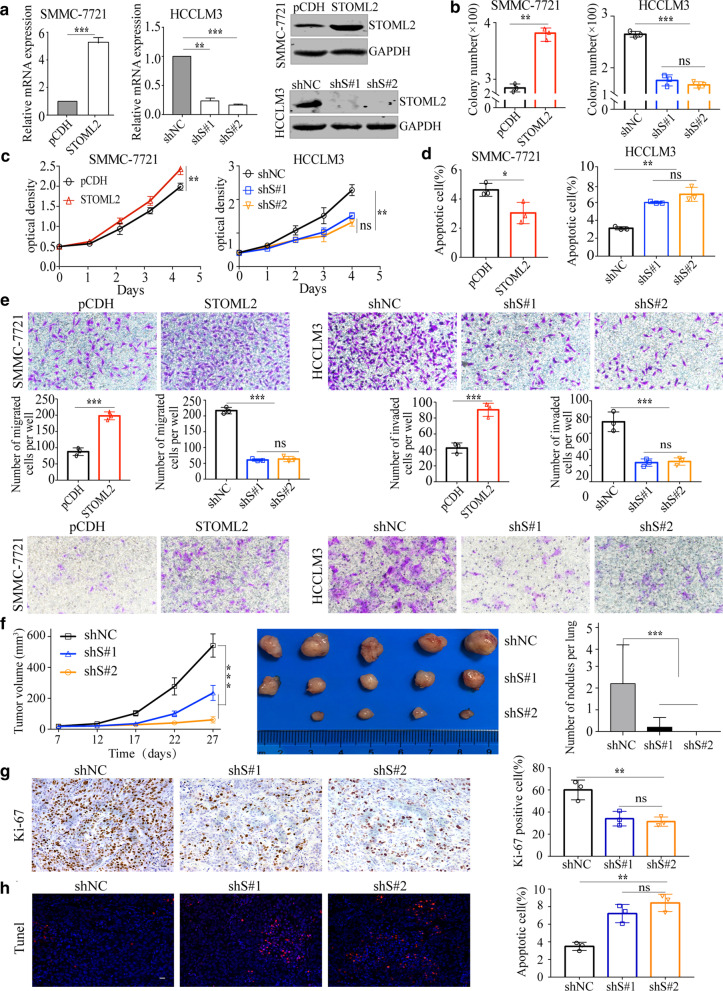
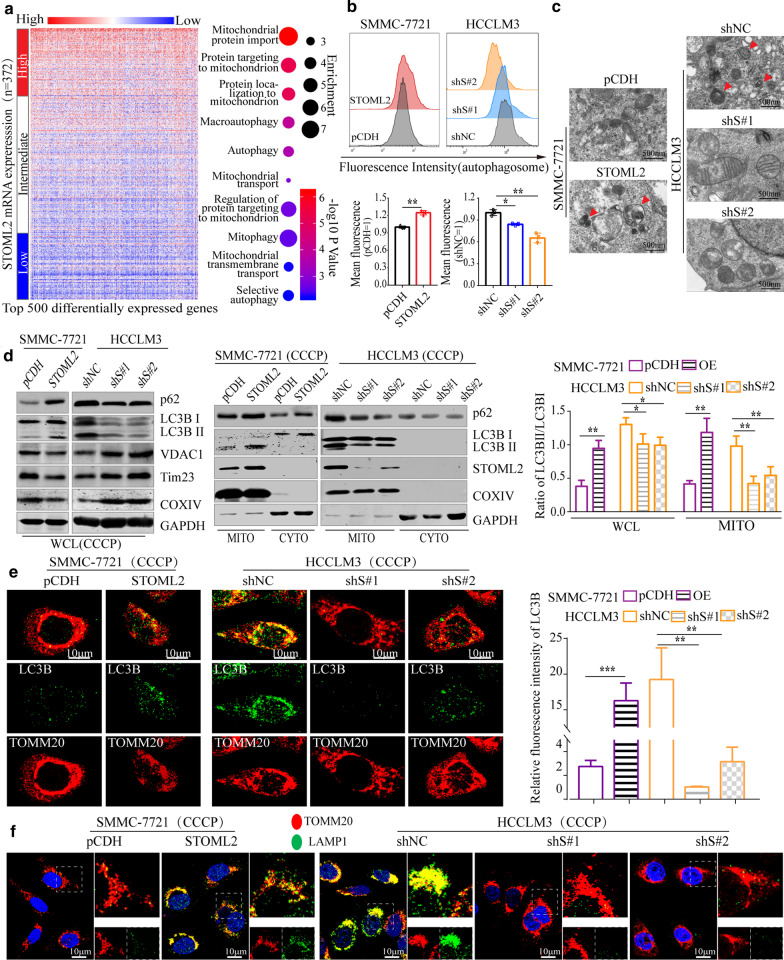
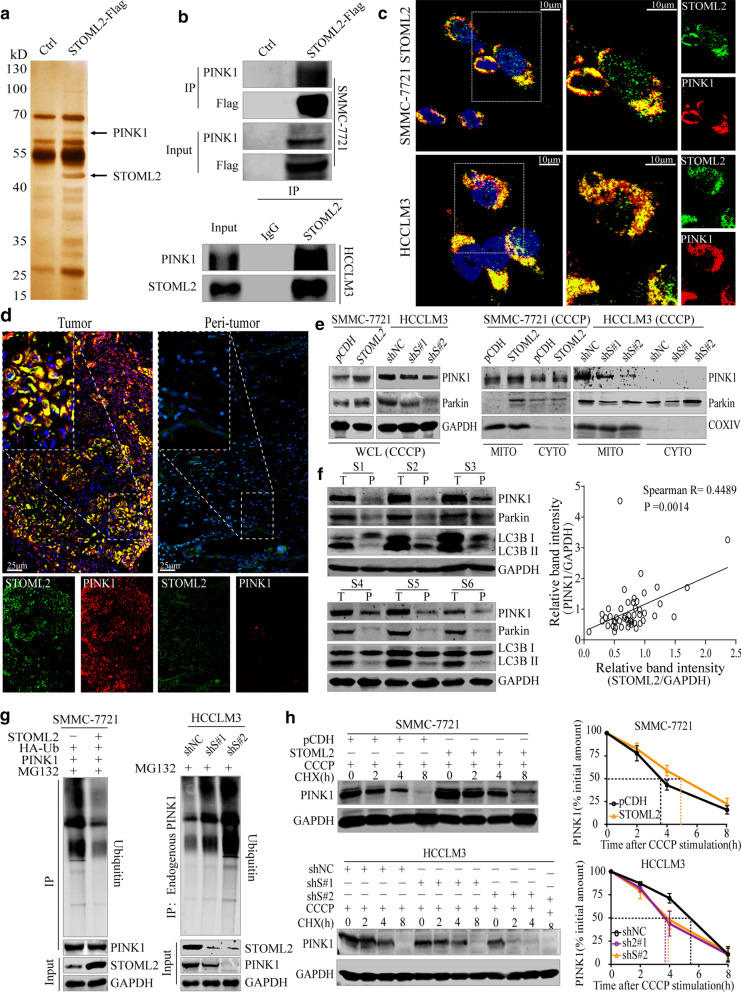
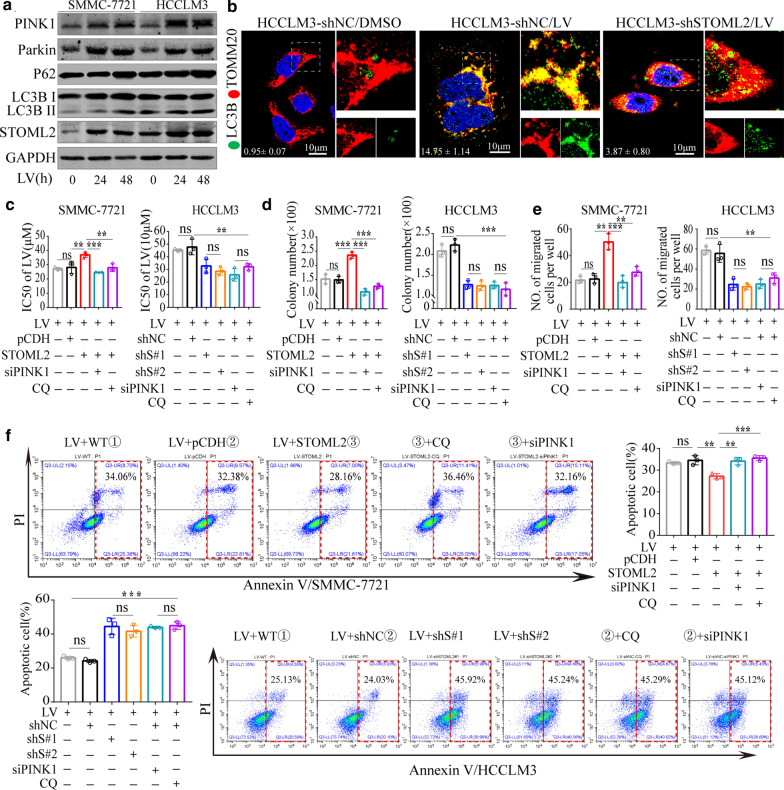
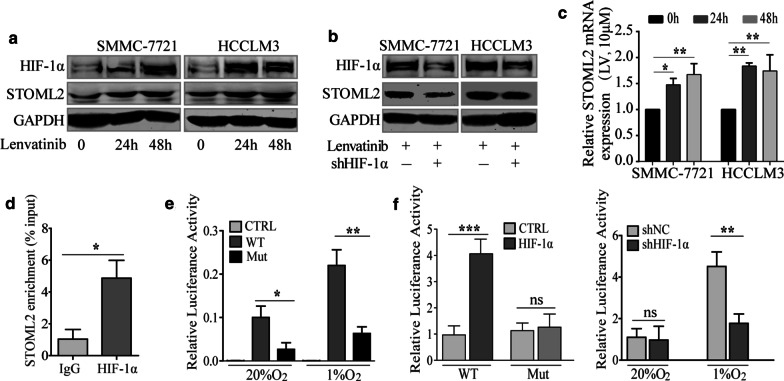
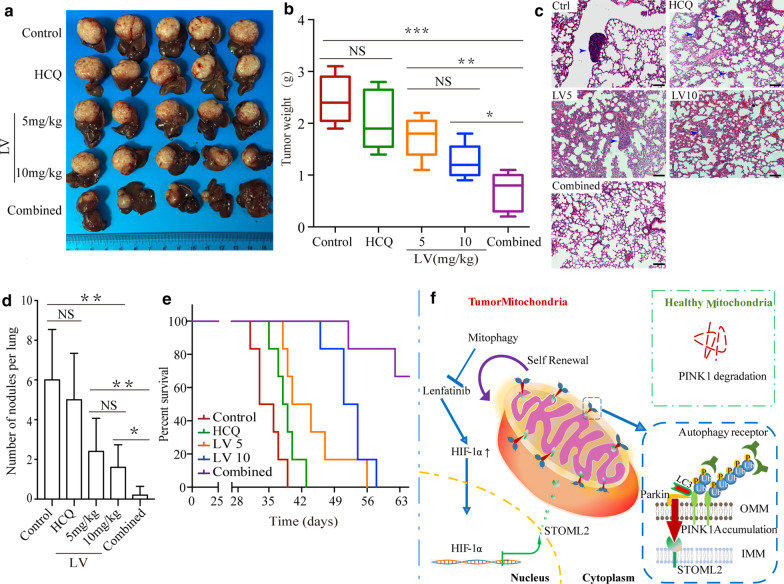
Results: Increased expression of STOML2 was found in HCC compared with paired peritumoral tissues. It was more significant in HCC with metastasis and correlated with worse overall survival and higher probability of recurrence after hepatectomy. Upregulation of STOML2 accelerated HCC cells colony formation, migration and invasion. Mechanically, TCGA dataset-based analysis showed enrichment of autophagy-related pathways in STOML2 highly-expressed HCC. Next, STOML2 was demonstrated to interact and stabilize PINK1 under cellular stress, amplify PINK1-Parkin-mediated mitophagy and then promote HCC growth and metastasis. Most interestingly, HIF-1α was upregulated and transcriptionally increased STOML2 expression in HCC cells under the treatment of lenvatinib. Furthermore, higher sensitivity to lenvatinib was found in HCC cells when STOML2 was downregulated. Combination therapy with lenvatinib and mitophagy inhibitor hydroxychloroquine obtained best efficacy.

Conclusions: Our findings suggested that STOML2 could amplify mitophagy through interacting and stabilizing PINK1, which promote HCC metastasis and modulate the response of HCC to lenvatinib. Combinations of pharmacologic inhibitors that concurrently block both angiogenesis and mitophagy may serve as an effective treatment for HCC.

Keywords: Hepatocellular carcinoma (HCC); Lenvatinib; Mitophagy; PTEN-induced putative kinase 1 (PINK1); Stomatin-like protein 2 (STOML2).


Conflict of interest statement

There is no conflict of interest with regard to the submitted manuscript.

Figures

Fig. 1
Fig. 1
STOML2 expression is upregulated in HCC tissues and predicts a poor prognosis. a-e The mRNA and protein level of STOML2 in 48 matched HCC tissues and adjacent non-tumor liver tissues was detected by qRT-PCR (a), Western blot (b), and immunohistochemical staining assay (e), representative bands of the STOML2 in HCC tissues and peri-tumor liver tissues were shown. The expression of STOML2 was normalized against GAPDH, according to the intensity of each lane with the use of computerized image system (Image-Pro Plus 6.0), and it was much higher in HCC tissues in contrast to the matched adjacent non-tumor liver tissues (c). Compared with metastasis-free HCC, the expression of STOML2 in metastasis HCCs was much higher (d). Representative immunohistochemical staining of STOML2 in HCC tissues and peri-tumor liver tissues were shown (Scale bar: 100 μm): 1, the view of both HCC and peri-tumor tissues; 2, the view of HCC tissue; 3, the view of peri-tumor tissue (e). f Scores indicate STOML2 levels in representative tumor tissues with immunohistochemical staining, which were calculated by intensity and percentage of stained cells (Scale bar: 100 μm). g, h Patients with high STOML2 expression have poorer OS (g) and higher probability of recurrence (h) compared with patients with low STOML2 expression: T tumor, P peri-tumor, S specimen, MH metastasis HCCs, and MFH metastasis-free HCCs.
Fig. 2
Fig. 2
STOML2 promotes HCC cell proliferation, migration, and invasion and inhibits HCC cell apoptosis. a Overexpression of STOML2 in SMMC-7721 and knockdown in HCCLM3 were detected by qRT-PCR (left and middle panel) and Western blot (right panel). b–e The effects of STOML2 gain- or loss-of-function on in vitro proliferation (b, c), apoptosis (d), migration, and invasion (e) of SMMC-7721 and HCCLM3 cells were measured by colony formation assay, CCK8, flow cytometric analysis of Annexin-V/PI staining and transwell assays. f The dynamic change of tumor volume between HCCLM3-shNC and HCCLM3-shS#1, HCCLM3-shS#2 in subcutaneous models, were shown (left and middle panel). Downregulation of STOML2 significantly suppressed lung metastasis in tail vein injection model (right panel). g Representative immunohistochemical staining of Ki-67 in subcutaneous tumor tissues of mice was shown (Scale bar: 100 μm), and the number of cells positively stained with Ki-67 was calculated from three independent fields for each image. h Representative TUNEL staining in subcutaneous tumor tissues of mice was shown (Scale bar: 100 μm), and the number of cells positively stained was calculated from three independent fields for each image. *P < 0.05; **P < 0.01; ***P < 0.001; ns, no significance
Fig. 3
Fig. 3
STOML2 promotes mitophagy in HCC cells under stress. a Expression of top 500 differentially expressed genes upregulated in HCC patients with different STOML2 expression and gene ontology term enrichment analysis for different biological processes controlled by differentially expressed genes among patients with high STOML2 expression. b The autophagic vacuoles were labeled with MDC and then detected by flow cytometry in SMMC-7721 and HCCLM3 cells. The fluorescence intensity of cells represented the autophagic level. c Representative TEM images depicted ultrastructure in SMMC-7721-pCDH or -STOML2-Flag and HCCLM3-shNC- or -shSTOML2. Red arrows indicated autophagic vacuoles. (Scale bars: 500 nm) d Under the treatment of CCCP (10 μM), total protein levels of p62, LC3B I/II and mitochondrial protein VDAC1, Tim23, COXIV were analyzed by Western blot. GAPDH was used as a loading control (left panel). Protein levels of STOML2, p62, and LC3B I/II in mitochondria were examined by purifying mitochondria from HCC cells. COX IV was used as a loading control for mitochondria (middle panel). Quantifying the ratio of LC3B II/LC3B I with image system in total and mitochondrial protein levels (right panel). e, f Confocal microscopy was performed to detect spatial co-localization of mitochondrial protein TOMM20 (red) with LC3B (green) (e, left and middle panel) and LAMP1 (green) (f) in SMMC-7721 and HCCLM3 control and derived cells under the treatment of CCCP (10 μM) for 4 h. (Scale bars:10 μm) The relative fluorescence intensity of LC3B are shown (e, right panel). *P < 0.05; **P < 0.01; ***P < 0.001; ns no significance, WCL whole cell lysate, MITO mitochondria
Fig. 4
Fig. 4
STOML2 interacted with PINK1 and contributed to its stability. a Total cell lysate was extracted from STOLM2 Flag-expressing or control cells treating with CCCP (10 μM), purified and resolved on SDS-PAGE. Silver stained gel showed differential bands, then the bands were retrieved and analyzed by MS. Identified PINK1 peptides are shown. b SMMC-7721 cells were transfected with STOML2-Flag or empty vector and subjected to immunoprecipitation using anti-Flag mAb. Co-immunoprecipitated PINK1 was detected using anti-PINK1 antibody (up panel). Endogenous STOML2 in HCCLM3 cells was immunoprecipitated using anti-STOML2 antibody with rabbit IgG as nonspecific control (down panel). Co-immunoprecipitated PINK1 was detected using anti-PINK1 antibody. c The co-localization between STOML2 (green) with PINK1 (red) was analyzed by confocal microscopy in SMMC-7721-STOML2 and HCCLM3 with CCCP (10 μM) stimulation. (Scale bar: 10 μm) d The expression and co-localization between STOML2 and PINK1 were analyzed in HCC and peri-tumor liver tissue of HCC patients by confocal microscopy. (Scale bar: 25 μm) e Under the treatment of CCCP (10 μM), total and mitochondrial protein levels of PINK1and Parkin were analyzed by Western blot. GAPDH and COX IV were used as loading controls. f Western blot analysis for PINK1, Parkin, LC3B I/II in 48 HCC tissues and peri-tumorous tissues patients (left panel), correlation analysis of the relative protein expression showed positive correlation between STOML2 and PINK1 in HCC patients (right panel). g Overexpression of STOML2 in SMMC-7721 increased accumulation of polyubiquitinated PINK1 when treated with MG132. PINK1 was pulled down and anti-ubiquitin antibody was used to detect polyubiquitinated PINK1 (left panel). Knockdown of STOML2 in HCCLM3 reduced polyubiquitinated PINK1 (right panel). h The upregulation of STOML2 reduces CCCP-induced PINK1 degradation. Western blot detected the alteration of PINK1 in SMMC-7721 and HCCLM3 with co-treatment of 10 μM CCCP and 10 μg/ml CHX for the indicated times (left panel). Densitometric analysis of PINK1 blots from three independent experiments is shown (right panel). GAPDH was used as a loading control
Fig. 5
Fig. 5
Inhibition of mitophagy sensitizes HCC cells to Lenvatinib treatment. a Western blot for PINK1, Parkin, p62, LC3BI/II in SMMC-7721 and HCCLM3 treated with lenvatinib (LV, 10 μM) at indicated time. GAPDH was used as a loading control. b The expression and co-localization of LC3B (green) with TOMM20 (red) increased sharply in HCCLM3-shNC cells treated with LV (10 μM) for 24 h, while the increase was counteracted significantly by shSTOML2 in HCCLM3 cells. The relative fluorescence intensity of LC3B is shown in the lower left corner. (Scale bars:10 μm) c-f SMMC-7721 and HCCLM3 control and derived cells were co-treated with LV(5 μM) and CQ (5 μM) or transiently transfected with PINK1 siRNA. IC50s of lenvatinib increased when STOML2 was upregulated (c). Identical to the IC50, under aforementioned conditions, colony formation (d) and migration (e) increased in HCC cells with STOML2 upregulation versus decreased with STOML2 downregulation. Correspondingly, apoptosis resulted from LV increased in HCC cells when STOML2 or PINK1 was downregulated or co-treated with CQ (f). **P < 0.01; ***P < 0.001; ns no significance, LV lenvatinib, WT wild type
Fig. 6
Fig. 6
STOML2 is upregulated by Lenvatinib in HCC with HIF-1α dependent. a Western blot analysis of STOML2 and HIF-1α expression in both SMMC-7721 and HCCLM3 cells after exposure to lenvatinib (10 μM) for 24 h and 48 h. b Knockdown of HIF-1α expression in both SMMC-7721 and HCCLM3 cells counteracted the upregulation of STOML2 caused by lenvatinib. c qRT-PCR analysis of STOML2 expression in both SMMC-7721 and HCCLM3 cells after exposure to lenvatinib (10 μM) for 24 h and 48 h. d Endogenous HIF-1α associated with the STOML2 promoter. ChIP qRT-PCR assay was performed with sonicated chromatins immunoprecipitated from HCCLM3 cells by anti-HIF-1α mAb or preimmune IgG (control). e CTRL, WT and Mut reporter were exposed to 20% O2 or 1% O2 for 12 h in the SMMC-7721 cells. f Overexpression of HIF-1α stimulated the STOML2 promoter reporter activity in SMMC-7721 cells (left panel). Knockdown of HIF-1α expression downregulated the STOML2 promoter reporter activity in the HCCLM3 cells (right panel). *P < 0.05; **P < 0.01; ***P < 0.001; ns no significance, Mut mutation, CTRL control
Fig. 7
Fig. 7
Inhibition effects of combination therapy with Lenvatinib and hydroxychloroquine were much better than Lenvatinib alone. a–e HCCLM3 orthotopically bearing mice were treated with HCQ, lenvatinib (5 mg/kg or 10 mg/kg) alone or combination with lenvatinib 5 mg/kg and HCQ 50 mg/kg, normal saline as control. a Representative images of the HCCLM3 orthotopic HCC tumors from each group (n = 5 mice/group). b Tumor weight in both low and high lenvatinib treatment groups was much lower than that in control group, while there was no difference between control and HCQ groups. The best inhibition efficacy was found in combination therapy group. c Representative H&E staining images of lung tissues of different treatment groups. Blue arrows indicated lung metastasis. Scale bar, 100 μm. d The mean number of lung metastasis in mice of each group. e The results of Kaplan–Meier survival curves for tumor bearing mice indicated that combination treatment prolonged OS of xenograft mice models bearing HCCLM3 significantly (P < 0.001), even much better than high dose of lenvatinib treatment group (P = 0.006). The P values for each comparison are as followed: Control versus HCQ (P = 0.065), Control versus LV5 (P = 0.023), Control versus LV10 (P < 0.001). f Schematic depiction of the underlying mechanisms of STOML2 upregulation in HCC and its functional role of facilitating HCC proliferation, metastasis and drug insensitivity via promoting PINK1-Parkin-mediated mitophagy. *P < 0.05; **P < 0.01; ***P < 0.001; ns no significance, LV5 lenvatinib 5 mg/kg, LV10 lenvatinib 10 mg/kg

Similar articles

Cited by

References

    1. Bray F, Ferlay J, Soerjomataram I, Siegel RL, Torre LA, Jemal A. Global cancer statistics 2018: GLOBOCAN estimates of incidence and mortality worldwide for 36 cancers in 185 countries. CA Cancer J Clin. 2018;68:394–424. doi: 10.3322/caac.21492. - DOI - PubMed
    1. Zong WX, Rabinowitz JD, White E. Mitochondria and cancer. Mol Cell. 2016;61:667–676. doi: 10.1016/j.molcel.2016.02.011. - DOI - PMC - PubMed
    1. Nickel A, Kohlhaas M, Maack C. Mitochondrial reactive oxygen species production and elimination. J Mol Cell Cardiol. 2014;73:26–33. doi: 10.1016/j.yjmcc.2014.03.011. - DOI - PubMed
    1. Rugarli EI, Langer T. Mitochondrial quality control: a matter of life and death for neurons. EMBO J. 2012;31:1336–1349. doi: 10.1038/emboj.2012.38. - DOI - PMC - PubMed
    1. Okamoto K. Organellophagy: eliminating cellular building blocks via selective autophagy. J Cell Biol. 2014;205:435–445. doi: 10.1083/jcb.201402054. - DOI - PMC - PubMed

Publication types

MeSH terms