

doi: 10.2807/1560-7917.ES.2021.26.1.2002023.
Real-time monitoring shows substantial excess all-cause mortality during second wave of COVID-19 in Europe, October to December 2020
Affiliations
- PMID: 33446304
- PMCID: PMC7809719
- DOI: 10.2807/1560-7917.ES.2021.26.1.2002023
Item in Clipboard
Real-time monitoring shows substantial excess all-cause mortality during second wave of COVID-19 in Europe, October to December 2020
Euro Surveill.
2021 Jan.
Abstract
The European monitoring of excess mortality for public health action (EuroMOMO) network monitors weekly excess all-cause mortality in 27 European countries or subnational areas. During the first wave of the coronavirus disease (COVID-19) pandemic in Europe in spring 2020, several countries experienced extraordinarily high levels of excess mortality. Europe is currently seeing another upsurge in COVID-19 cases, and EuroMOMO is again witnessing a substantial excess all-cause mortality attributable to COVID-19.
Keywords: COVID-19 pandemic; EuroMOMO; Europe; all-cause mortality.
Conflict of interest statement
Figures
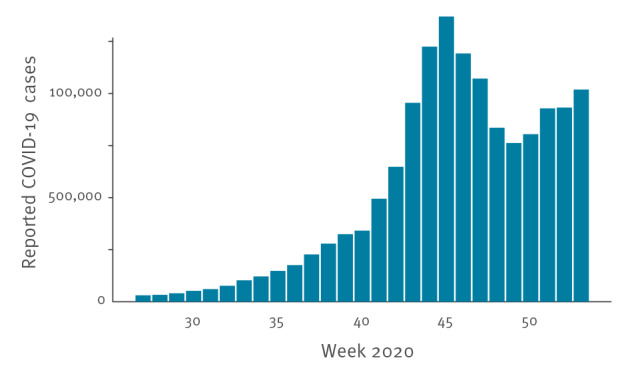
Weekly number of COVID-19 cases reported to the World Health Organization by the countries participating in the EuroMOMO networka, weeks 27 to 53, 2020
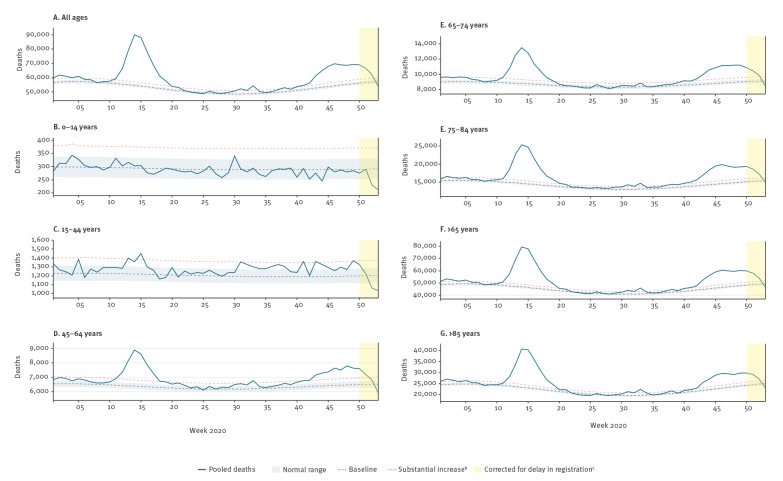
EuroMOMO pooled estimates of all-cause mortality (A) for all ages and (B–G) by age group, 27 participating countriesa or subnational areas, weeks 1 to 53 2020
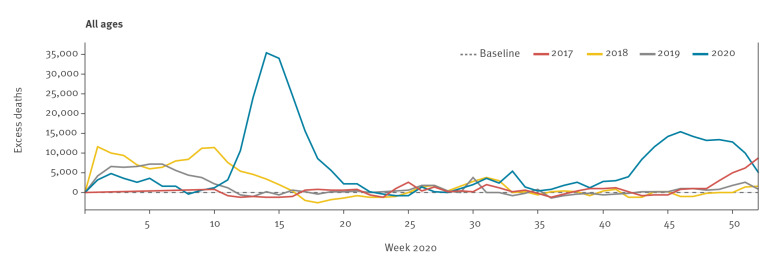
EuroMOMO pooled estimates of excess all-cause mortality for all ages by week and year, 27 participating countriesa or subnational areas, weeks 1 to 52 2017–2020
Comment in
-
Letter to the editor: Excess all-cause mortality during second wave of COVID-19 - the Polish perspective.Euro Surveill. 2021 Feb;26(7):2100117. doi: 10.2807/1560-7917.ES.2021.26.7.2100117. Euro Surveill. 2021. PMID: 33602384 Free PMC article. No abstract available.
References
-
- World Health Organization (WHO). Coronavirus Disease (COVID-19) Dashboard. Geneva: WHO; 2021. Available from: https://covid19.who.int/
-
- European Centre for Disease Prevention and Control (ECDC). COVID-19 situation update worldwide, as of week 53 2020. Stockholm: ECDC; 2021. Available from: https://www.ecdc.europa.eu/en/geographical-distribution-2019-ncov-cases
-
- World Health Organization Regional Office for Europe (WHO/Europe). COVID-19 situation in the WHO European Region. Copenhagen: WHO/Europe; 2021. Available from: https://who.maps.arcgis.com/apps/opsdashboard/index.html#/ead3c647565448...
-
- European Centre for Disease Prevention and Control (ECDC). COVID-19 situation update for the EU/EEA, as of week 53 2020. Stockholm: ECDC; 2021. Available from: https://www.ecdc.europa.eu/en/cases-2019-ncov-eueea
-
- Mazick A, Gergonne B, Nielsen J, F Wuillaume, M J Virtanen, A Fouillet, et al. Excess mortality among the elderly in 12 European countries, February and March 2012. Euro Surveill. 2012;17(14):20138. 10.2807/ese.17.14.20138-en - DOI - PubMed
MeSH terms
Grants and funding
LinkOut - more resources
Full Text Sources
Other Literature Sources
Medical