. 2021 Jan 19;118(3):e2002574118.
doi: 10.1073/pnas.2002574118.

An immunohistochemical study of lymphatic elements in the human brain

Affiliations

An immunohistochemical study of lymphatic elements in the human brain

Éva Mezey et al. Proc Natl Acad Sci U S A. .

Abstract

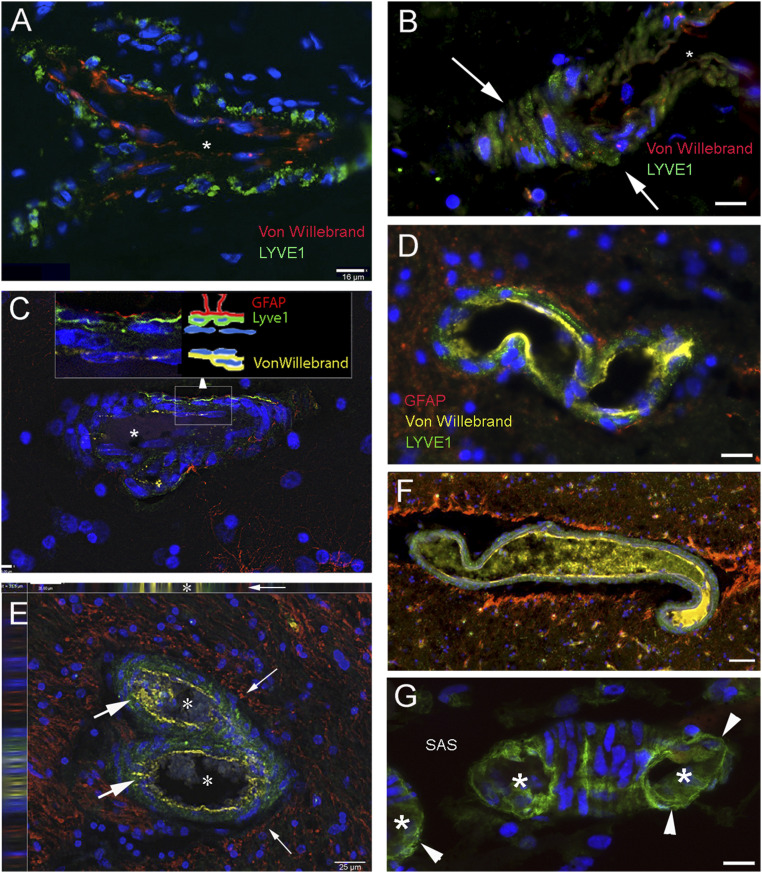
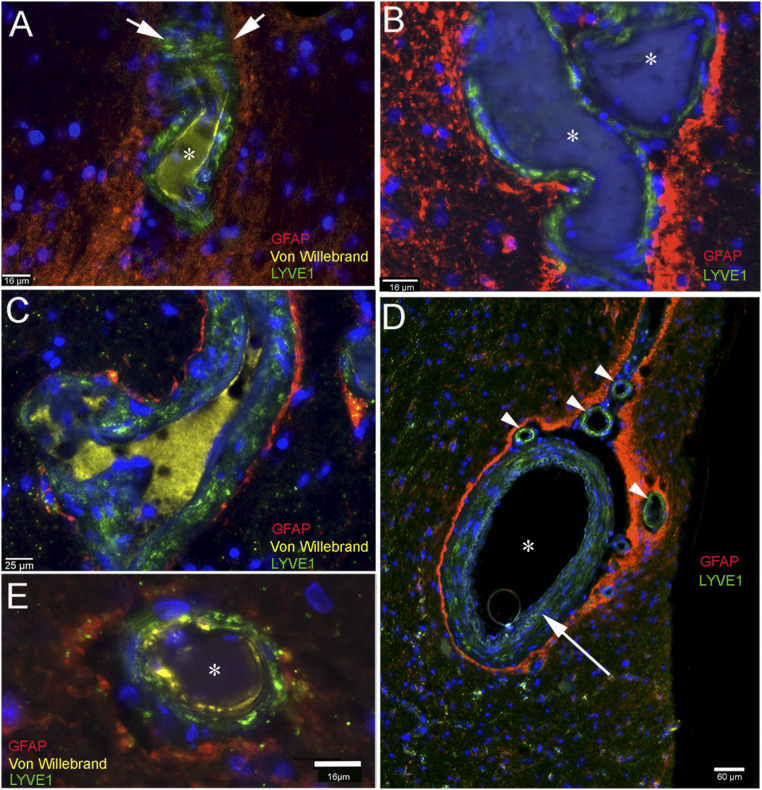
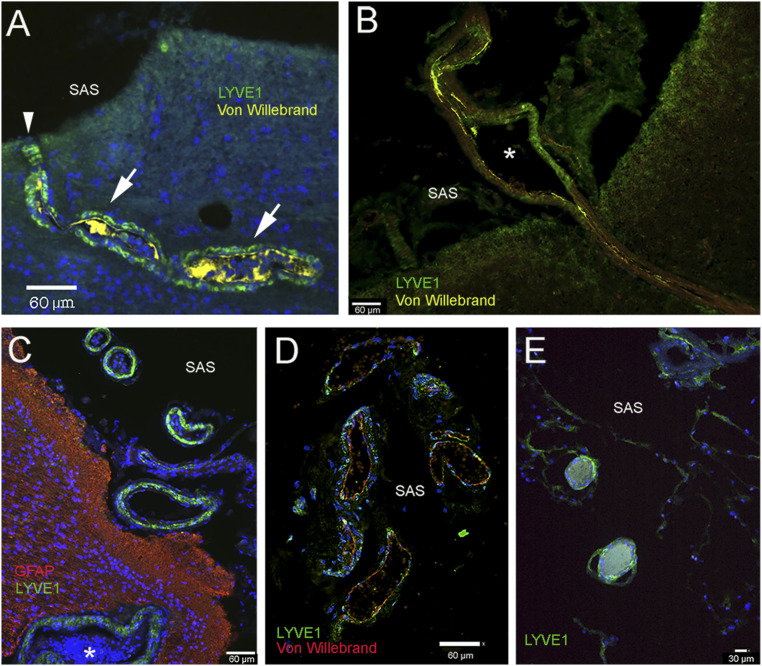
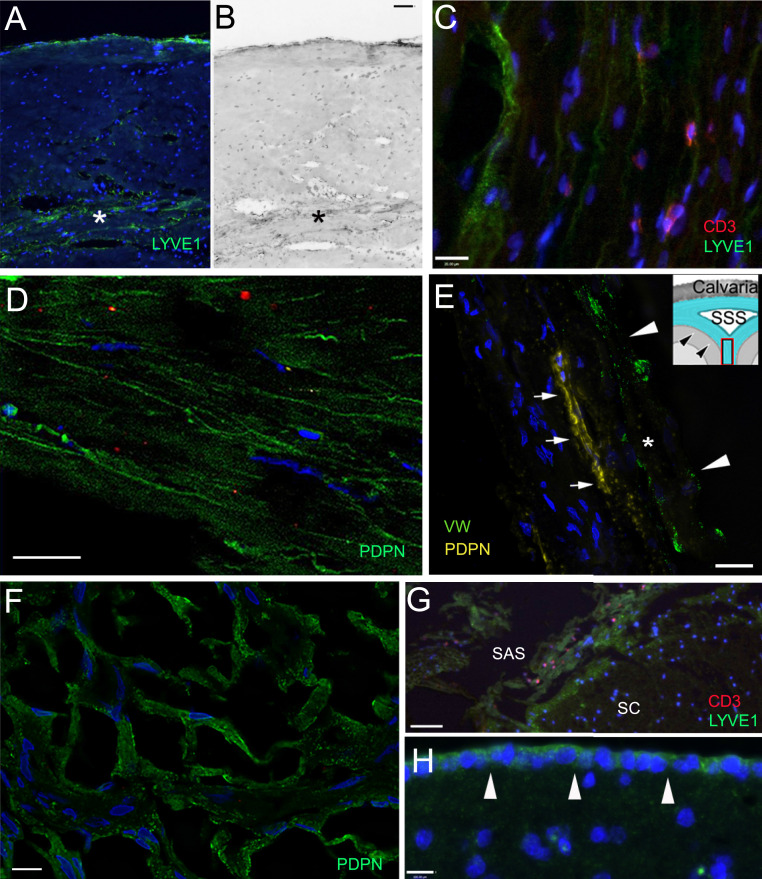
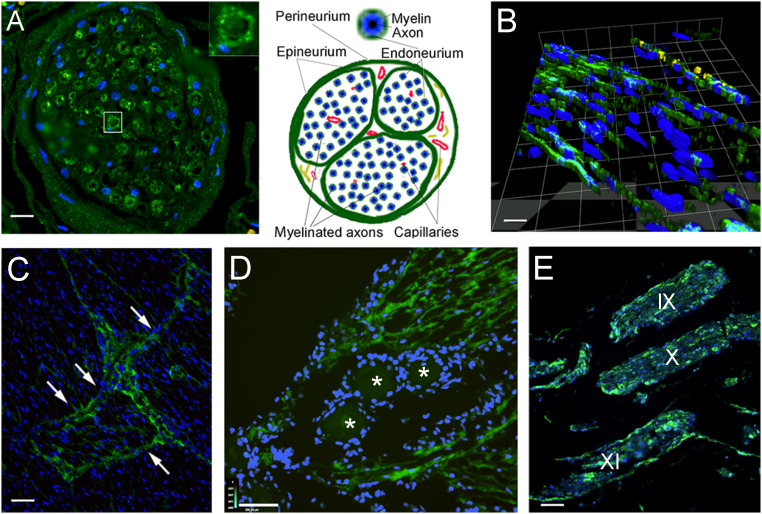
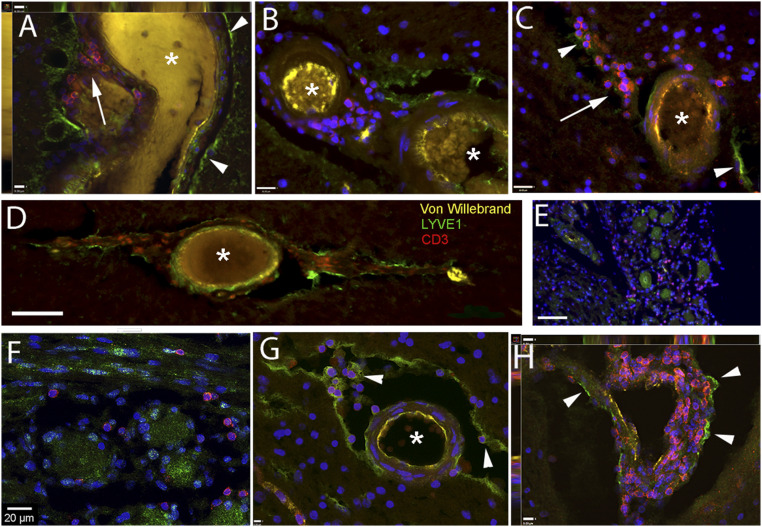
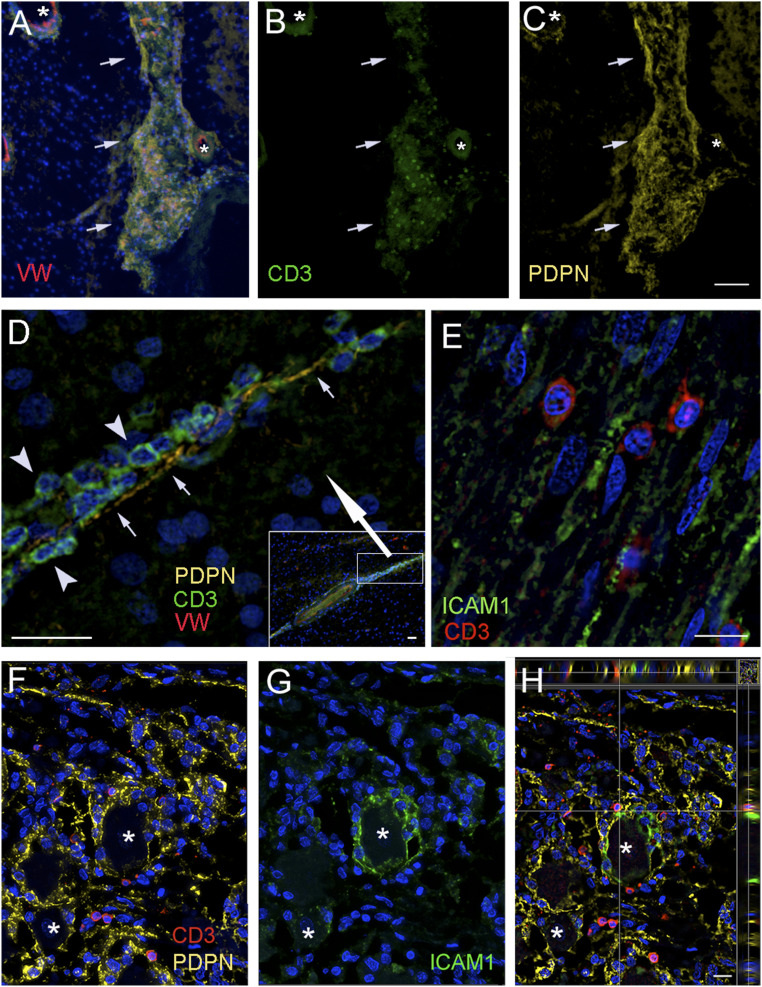
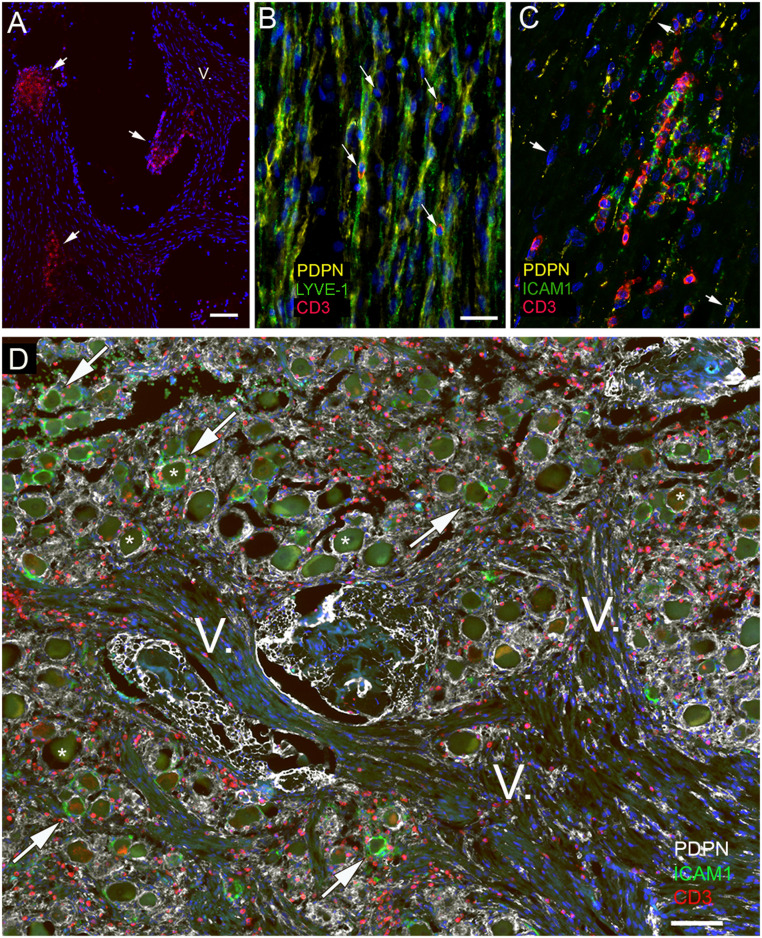
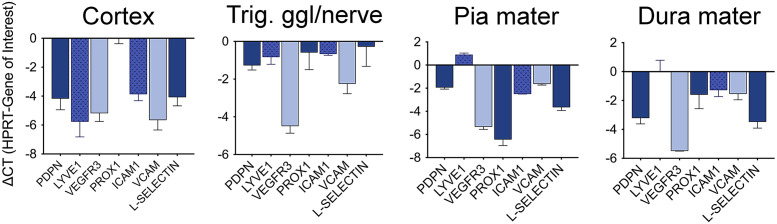
Almost 150 papers about brain lymphatics have been published in the last 150 years. Recently, the information in these papers has been synthesized into a picture of central nervous system (CNS) "glymphatics," but the fine structure of lymphatic elements in the human brain based on imaging specific markers of lymphatic endothelium has not been described. We used LYVE1 and PDPN antibodies to visualize lymphatic marker-positive cells (LMPCs) in postmortem human brain samples, meninges, cavernous sinus (cavum trigeminale), and cranial nerves and bolstered our findings with a VEGFR3 antibody. LMPCs were present in the perivascular space, the walls of small and large arteries and veins, the media of large vessels along smooth muscle cell membranes, and the vascular adventitia. Lymphatic marker staining was detected in the pia mater, in the arachnoid, in venous sinuses, and among the layers of the dura mater. There were many LMPCs in the perineurium and endoneurium of cranial nerves. Soluble waste may move from the brain parenchyma via perivascular and paravascular routes to the closest subarachnoid space and then travel along the dura mater and/or cranial nerves. Particulate waste products travel along the laminae of the dura mater toward the jugular fossa, lamina cribrosa, and perineurium of the cranial nerves to enter the cervical lymphatics. CD3-positive T cells appear to be in close proximity to LMPCs in perivascular/perineural spaces throughout the brain. Both immunostaining and qPCR confirmed the presence of adhesion molecules in the CNS known to be involved in T cell migration.

Keywords: CSF; T cells; cranial nerves; meninges; podoplanin.


Conflict of interest statement

The authors declare no competing interest.

Figures

Fig. 1.
Fig. 1.
LYVE1-labeled lymphatic cells along or within the wall of vessels in the human frontal and parietal cortex. Sections from brain regions of patients who suffered from neurological diseases (A and C–F) or who died from diseases that should not have affected the CNS (B and G) were immunostained using multiplex fluorescent immunohistochemistry with tyramide signal amplification (TSA). LYVE1, a membrane glycoprotein specific for lymphatic endothelial cells, is marked in green in all panels. The vascular endothelium is shown in red in A and B and in yellow in all other panels, representing the expression of von Willebrand factor. GFAP is stained in red for astrocytes forming the glia limitans around the vessels in CF. AC show small capillary-size structures that stained for LYVE1 and von Willebrand factor. DAPI, a chromosomal stain shown in blue, pinpoints cell nuclei in all images. The white arrows in B point at LYVE1-positive cells on the outside of the vessel before it has been transected by sectioning and the lumen becomes visible. In C, the image is a slice of a Z series taken at 0.5-μm intervals. The schematic Inset next to the enlarged (squared) area shows the layers stained with the different markers. (D) Three layers of cell types (capillary endothelium, lymphoid, and glial cells) stained with three different colors. E depicts a bifurcating vessel (lumina are labeled with asterisks), with LYVE1 labeling in the wall (large arrows) and lymphatic cells between basement membranes in the muscular layers. The image is one section out of a Z-stack and the side panels on Top and on the Left show the side views confirming the lymphatic-positive (green) staining lining the von Willebrand factor-positive vascular endothelium (yellow) on one side and a perivascular gap lined by red GFAP staining (small arrows). F is similar to D with the exception of the large artificial gap around the vessel. The yellow immunostained material in the lumen represents soluble von Willebrand factor; (G) a piece of a small capillary on the cortical surface with LYVE1-stained cells (arrowheads). Both in the cross-sections (labeled by asterisks) and the longitudinal portion, lymphatic cells form the outside wall. The star in AC labels the lumina of the vessels. SAS, subarachnoid space. (Scale bars: A, B, D, G, 16 μm; C, 7 μm; E, 25 μm; F, 50 μm.)
Fig. 2.
Fig. 2.
LYVE1-positive cells in vasculature in several brain regions; the glia limitans labeled by GFAP staining outlines the parenchymal side of the PVS. Multiplex immunostained sections from a variety of brain regions from patients. Red fluorescent processes of astrocytes (glia limitans) surround a small artificial space around the vessels. LYVE1 is stained in green and show the LMPCs that are present in the vascular adventitia in all panels. A and B show the von Willebrand factor staining in the vascular endothelial cells and also its soluble form in the vascular lumen (A and C). The green LYVE1-positive cells are dispersed among the muscle cells of the vascular wall. C shows a part of venous vasculature, clearly labeling cells in the wall with green (LYVE1) and the glia limitans (GFAP) in red. In D, a large artery can be seen (asterisk) with positive intralaminar LYVE1-labeled cells in the muscular layer (long arrow) among the basement membranes. The red staining represents the glia limitans that surrounds the artery and also the small LYVE1-stained vessels (vasa vasorum) in the adventitia. E, Similar to AC, but observe the large artificial gap around the vessel. (Scale bars: A, B, and E, 16 μm; C, 25 μm; D, 60 μm.)
Fig. 3.
Fig. 3.
Lymphatic markers in the wall of vessels connecting with the subarachnoid space (SAS) over the frontal and parietal cortex. AC and E are taken from patients with underlying neurological diseases, and C is from a patient with no neurological disease. A and B show vessels in the frontal cortex connecting with the subarachnoid space (SAS) in the arachnoid trabeculae. The outsides of the vessels are delineated by LYVE1-positive green cells, while the vascular endothelium is in yellow (staining von Willebrand factor). In A, the green LYVE1-positive cells that follow the vessel are labeled with arrows. The entry point of the vessel at the border of the SAS is labeled with an arrowhead. CE show vessels in the SAS. In C, the outside wall of the vessel is LYVE1 positive (green), and processes of astrocytes (GFAP) at the surface of the brain are red. The asterisks in B and C label vascular lumina. (Scale bars: AD, 60 μm; E, 30 μm.)
Fig. 4.
Fig. 4.
Lymphatic markers (LYVE1 and PDPN) in the meninges. Sections of the meninges from persons died of nonneurological causes (A, B, and EG) and who suffered from neurological disease (C and D). (AD) Upper (periosteal) and lower meningeal segments of the dura mater from the sagittal sinus; (E) falx cerebri; (F and G) arachnoid; (H) pia mater. (A and B) Bright-field image of the same field; in the dura mater LYVE1-positive lymphatic channels are stained green. The inner periosteal layer of the dura is adherent to the periosteum of the cranium. This layer is composed of tough compact collagenous fibers. The meningeal layer (labeled with a star) faces the arachnoid membrane. This layer is less compact; blood vessels and lymphatic elements fill up the intermembranous spaces. The capillaries and postcapillary venules are fenestrated (no BBB). (C) LYVE1-positive lymphatic cells and scattered T cells (stained in red with CD3 antibody) can be seen among the collagenous membranes of the dura. D shows podoplanin (PDPN; another accepted marker of lymphatic endothelial cells) positivity (green) in the dura mater in the inner surface of the basis of the cranium, in the cavernous sinus. E demonstrates a PDPN-positive (yellow fluorescence) lymphatic channel (small arrows) next to a sectioned vessel labeled with an asterisk and arrowheads (vascular endothelium is positive for von Willebrand factor; green fluorescence) in a thin section (taken from a Z stack at 1-µm optical thickness) of the falx cerebri (the anatomy is shown in the Inset, where arrowheads point at the dura mater and the square shows the approximate area of the falx cerebri where the sample was taken from. F demonstrates podoplanin staining of the arachnoid (from the Greek word for spider). It resembles a spider web. In G, many LYVE1-positive epithelial cells can be observed in the arachnoid covering the spinal cord (SC) and red fluorescent CD3-positive T cells are occasionally present near the LYVE1-positive connective tissue cells. (H) The cells of the pia mater (pointed at by white arrows) on the surface of the frontal cortex express LYVE1 (green). SAS, subarachnoid space; SSS, superior sagittal sinus. (Scale bars: A and B, 100 µm; C–F, as labeled.)
Fig. 5.
Fig. 5.
Lymphatic endothelial markers among the nerve fibers and fascicles of cranial nerves. Sections stained with antibody to LYVE1 (visualized in green fluorescence) of cranial nerves and the trigeminal ganglion from persons deceased without known neurological disorders. (A) Cross-sections of a branch of the trigeminal nerve are shown. Interestingly, the endoneurium (connective tissue sheets around the individual myelinated fibers) is positively stained; the Inset shows an enlargement of a single nerve fiber enclosed by the LYVE1-positive endoneurium. Nuclei of glial cells (Schwann cells and possibly microglia) and connective tissue are visible in blue (DAPI). In B, a three-dimensional reconstruction of a section of the trigeminal nerve is shown, demonstrating the presence of longitudinal LMPCs among the nerve fibers. On the Top of the image, cells with yellow fluorescence express the von Willebrand factor, indicating vascular endothelial cells of a small vessel in the section. (C) In a cross-section across a large nerve bundle, labeling is very strong among the fascicles (arrows). (D) A section through the trigeminal ganglion is shown. Cross-sections of trigeminal fibers around the ganglion cells (labeled with stars) show strong LYVE1 labeling. (E) Section of the brainstem with the origin of the IX, X, and XI cranial nerves running parallel. The perineurium as well as cells among the myelinated axons within the nerve fibers are strongly labeled with LYVE1. (Scale bars: A, 50 μm; B, 25 μm; C and E, 110 μm; D, 130 μm.)
Fig. 6.
Fig. 6.
T lymphocytes identified adjacent to LYVE1-positive staining in the PVSs. Sections from persons who suffered from neurological diseases (AD) and without known neurological diseases (EG). Samples were taken from the amygdala (A and G), parietal cortex (D), trigeminal ganglion (E and F), striatum (C and H), and vessels in the hippocampal sulcus (B). In all of the images, the asterisks label vascular lumina, arrows point at a congregation of T cells, and arrowheads point at some of LYVE1-positive cellular membranes. A shows the cross/longitudinal section of a large vein, where the vascular endothelium is yellow (VW: von Willebrand), the brain surface is lined by LYVE1-positive green cells, and the space between the outside of the vessel wall and the LYVE1-positive surface is filled with a large number of red, CD3-positive T cells. The image is one level of a Z stack showing the side views on the Top and Left. B shows similar images with small arteries in the hippocampal sulcus (B), and in the striatum (C and H). Once again, the T cells are in close proximity to LYVE1-positive structures. (E and F) High and low magnification, respectively, of the trigeminal ganglion, where CD3-positive T cells are found in-between the ganglion cells and—similarly to the other pictures—are close by to long LYVE1-positive cells in the connective tissue. G shows a cross-section of a medium-size artery, with VW staining in yellow, where LYVE1-positive cells are lining both the brain parenchyma and the outside of the vessel. They are also present within the adventitia of the vessel. The space between the brain and the vessel is filled with T cells (red), a few attached to the outside of the vascular wall. H shows a vascular loop in the striatum completely covered with T cells. The image is one level of a Z stack showing the side views on the Top and Left. (Scale bars: A, G, and H, 9 μm; B and C, 16 μm; D, 90 μm; E, 80 μm; F, 20 μm.)
Fig. 7.
Fig. 7.
Confirmation of findings with a second lymphatic element marker, podoplanin. Sections from persons who suffered from neurological disease (AD), or without known neurological diseases (EH). Samples were taken from the basal ganglia, the parietal cortex, and the cavernous sinus including the trigeminal ganglion and nerves. AC are images of the same area using different fluorescent filters. A shows the overlay of nuclear DAPI (blue); in B, T cells labeled with CD3 (green) and vascular endothelium shown by an antibody to von Willebrand factor (red) and the lymphatic endothelial marker, podoplanin (yellow) in the globus pallidus. The outside of a vessel within the parenchyma is visible that is (B) covered with green fluorescent T cells (CD3) that are attached to (C) the podoplanin-positive (yellow) outer membrane. The asterisks label vascular lumina; the arrows point at the vascular loops within the parenchyma (the DAPI staining in A shows the presence of neuronal cells, while in B only the T cells are visible). D shows a continuation of a perivascular space (seen in the Inset in the Lower Right corner) enlarged (see the rectangle in the Inset with the large white arrow pointing to the enlarged area) where CD3 positive green T cells (arrowheads) can be observed attached along the podoplanin positive (yellow) membranes (small arrows) of endothelial cells. E is a section of a branch of the trigeminal nerve, where the adhesion factor ICAM1 is stained green and red T cells are attached to the ICAM1-positive fibers. FH demonstrate a portion of the trigeminal ganglion with ganglion cells (asterisks) to show the overlap of PDPN (yellow), ICAM1 (green), and the CD3-positive T cells (red) adjacent to both. It is interesting that ICAM1 (G) is expressed by satellite cells surrounding the ganglion cells, but only around a fraction of the neurons. In H, which is an optical slice of the section, the side panels clearly indicate the close proximity of green (ICAM1-expressing) and yellow (PDPN-expressing) structures to the red T cells. (Scale bars: AC, 75 μm; D, 30 μm, D (Inset), 25 μm, EH, 20 μm.)
Fig. 8.
Fig. 8.
Expression of adhesion molecules in relation to T cells and lymphatic markers in the trigeminal nerve. All panels are from subjects with no known neurological disease. The trigeminal nerve was stained for CD3 (red), Lyve1 (green), and podoplanin (yellow). A shows a group of T cells at the sectioned surface of the nerve bundles (short arrows) suggesting an accumulation of T cells under the perineurium covering the nerve. One branch of the fifth cranial nerve is labeled with the roman numeral V. B demonstrates the colocalization of two lymphatic markers (podoplanin and Lyve1) in the endoneurial connective tissue and shows T cells (arrows) next to double-stained membranes. In C, yellow color represents PDPN, and the area where the red (CD3-positive) T cells gather is also strongly expressing the adhesion molecule ICAM1 (shown in green). A few PDPN-expressing cells with elongated nuclei are pointed at with arrows. ICAM1 seems to be expressed in the proximity of T cells. In D, the cross-section of the trigeminal ganglion and trigeminal branches from a strangulated victim is shown to demonstrate the T cell accumulation. Triple staining shows podoplanin (in white); ICAM1, the adhesion molecule known to be involved in T cell adhesion/migration (in green); and CD3 (in red) labeling all T cells. Large ganglion cells (some are labeled with stars) are clearly visible among the fibers. Note that—similarly to Fig. 7—only some of the ganglion cells are surrounded by ICAM1-positive green satellite cells (some of these are pointed out by arrows), while all other satellite cells are unstained for ICAM1 but still stained with PDPN (in yellow). (Scale bars: A and D, 100 µm; B and C, 50 µm.)
Fig. 9.
Fig. 9.
qPCR analysis of the trigeminal ganglia and nerve, cortex, and meninges to confirm the presence of mRNA encoding the studied proteins. In samples from three different donors for the trigeminal samples and individual samples of other regions from the tissue that was used for ICC, the mRNAs encoding all the proteins that we visualized using immunostaining were also present, confirming their expression.

Similar articles

Cited by

References

    1. Crivellato E., Travan L., Ribatti D., The Hippocratic treatise “On glands”: The first document on lymphoid tissue and lymph nodes. Leukemia 21, 591–592 (2007). - PubMed
    1. Mascagni P., Vasorum Lymphaticorum Corporis Humani Descriptio e Iconographia (Pazzini Carli, Siena, Italy, 1787).
    1. Schwalbe G., Der Arachnoidealraum, ein Lymphraum und sein Zusammenhang mit dem Perichorioidealraum. Centralblatt für die medicinischen Wissenschaften 7, 465 (1869).
    1. Key A., Retzius G., Studien in der Anatomie des Nervensystems und des Bindegewebes (Samson und Wallin, Stockholm, 1875).
    1. Tuke J. B., The Morisonian Lectures, delivered before the Royal College of Physicians of Edinburgh: Session 1874. Edinburgh Med. J. 20, 687–700 (1875). - PMC - PubMed

Publication types

MeSH terms

LinkOut - more resources