. 2021 Jan 19;118(3):e2017742118.
doi: 10.1073/pnas.2017742118.

Prior activation state shapes the microglia response to antihuman TREM2 in a mouse model of Alzheimer's disease

Affiliations

Prior activation state shapes the microglia response to antihuman TREM2 in a mouse model of Alzheimer's disease

Daniel C Ellwanger et al. Proc Natl Acad Sci U S A. .

Abstract

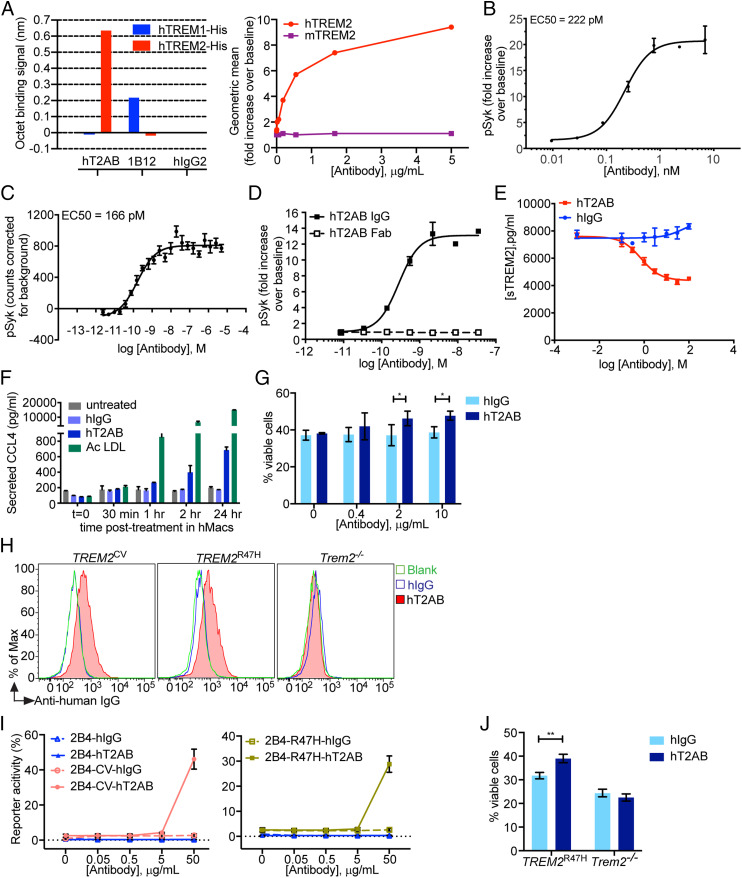
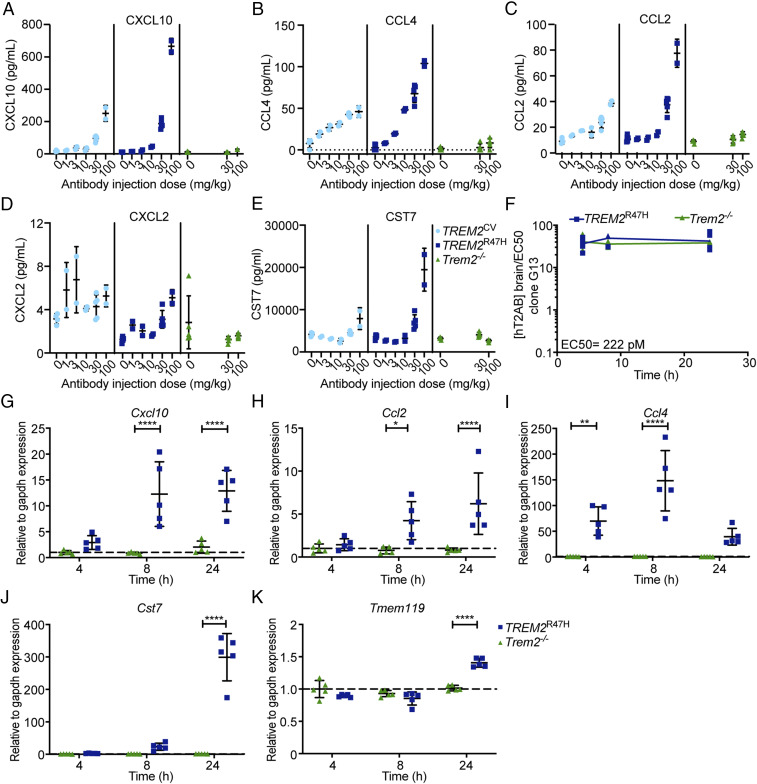
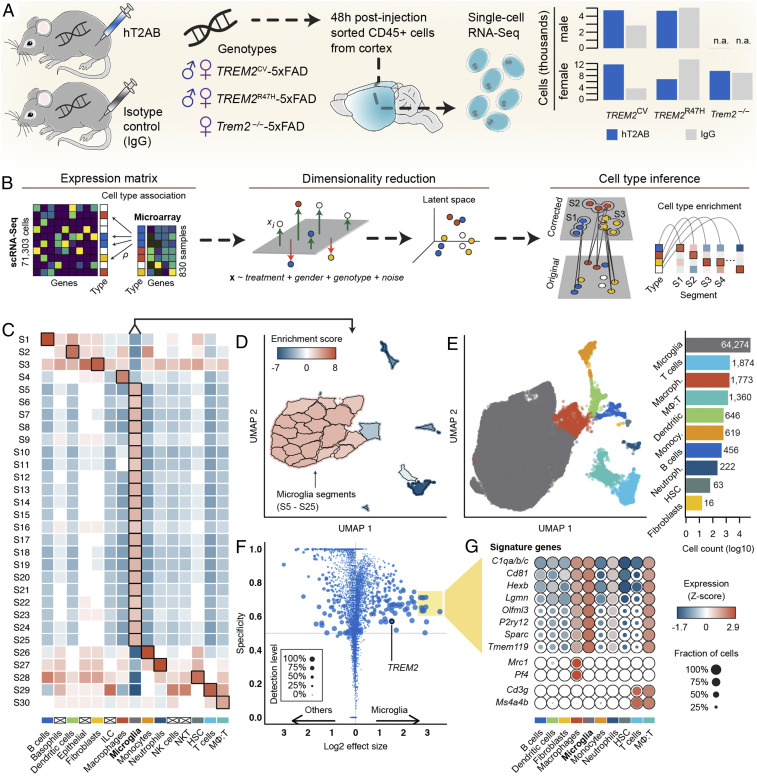
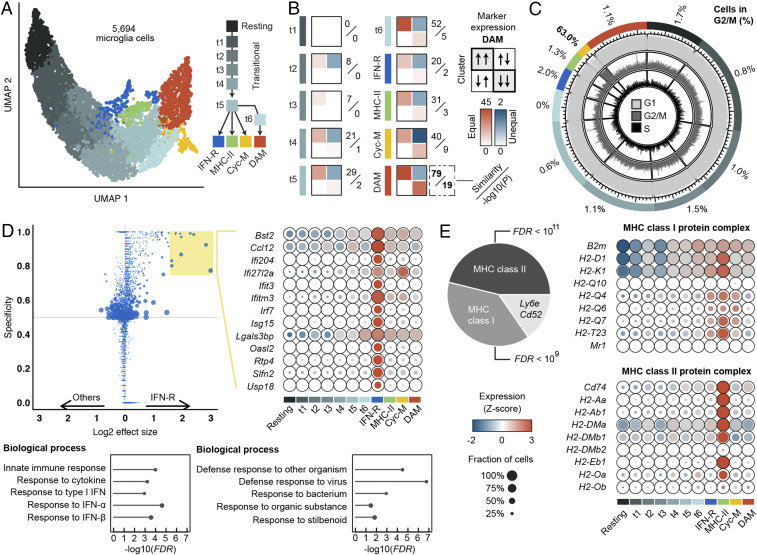
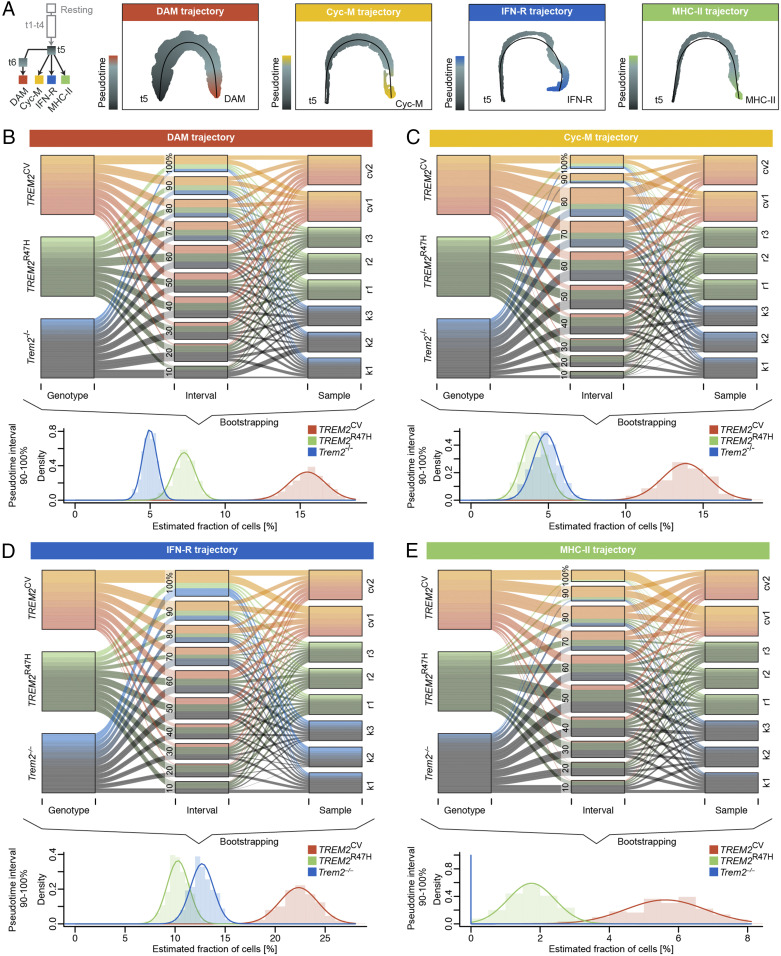
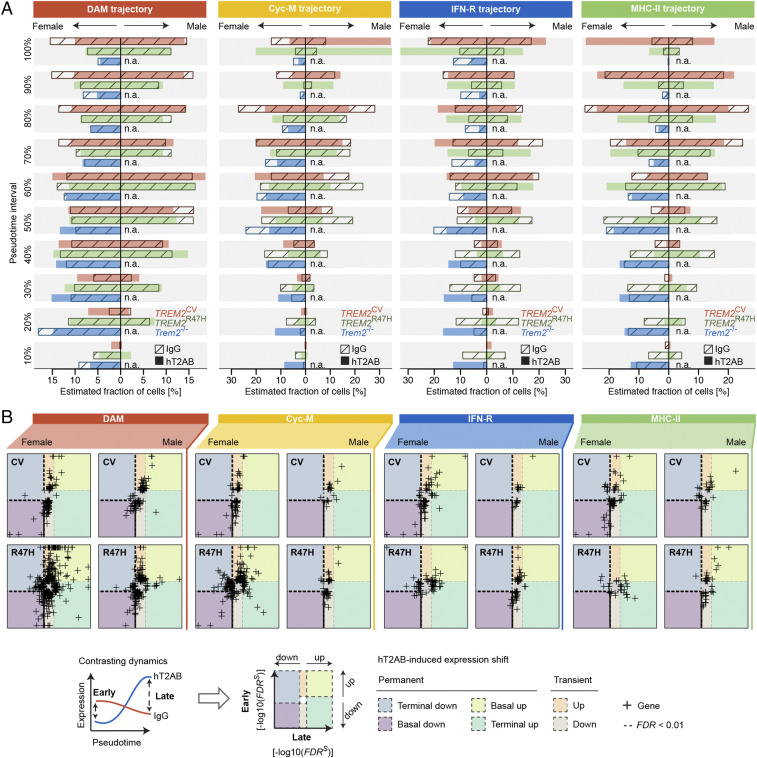
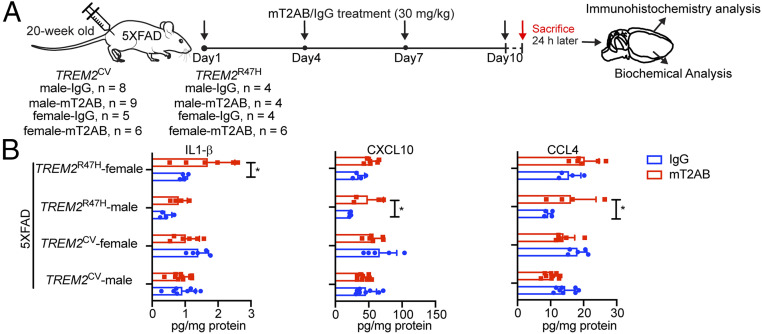
Triggering receptor expressed on myeloid cells 2 (TREM2) sustains microglia response to brain injury stimuli including apoptotic cells, myelin damage, and amyloid β (Aβ). Alzheimer's disease (AD) risk is associated with the TREM2R47H variant, which impairs ligand binding and consequently microglia responses to Aβ pathology. Here, we show that TREM2 engagement by the mAb hT2AB as surrogate ligand activates microglia in 5XFAD transgenic mice that accumulate Aβ and express either the common TREM2 variant (TREM2CV) or TREM2R47H scRNA-seq of microglia from TREM2CV-5XFAD mice treated once with control hIgG1 exposed four distinct trajectories of microglia activation leading to disease-associated (DAM), interferon-responsive (IFN-R), cycling (Cyc-M), and MHC-II expressing (MHC-II) microglia types. All of these were underrepresented in TREM2R47H-5XFAD mice, suggesting that TREM2 ligand engagement is required for microglia activation trajectories. Moreover, Cyc-M and IFN-R microglia were more abundant in female than male TREM2CV-5XFAD mice, likely due to greater Aβ load in female 5XFAD mice. A single systemic injection of hT2AB replenished Cyc-M, IFN-R, and MHC-II pools in TREM2R47H-5XFAD mice. In TREM2CV-5XFAD mice, however, hT2AB brought the representation of male Cyc-M and IFN-R microglia closer to that of females, in which these trajectories had already reached maximum capacity. Moreover, hT2AB induced shifts in gene expression patterns in all microglial pools without affecting representation. Repeated treatment with a murinized hT2AB version over 10 d increased chemokines brain content in TREM2R47H-5XFAD mice, consistent with microglia expansion. Thus, the impact of hT2AB on microglia is shaped by the extent of TREM2 endogenous ligand engagement and basal microglia activation.

Keywords: Alzheimer’s disease; TREM2; amyloid beta; microglia; monoclonal antibody.


Conflict of interest statement

Competing interest statement: D.C.E., Z.S., L.G., R.C., D.Y., D.W., P.R., J.B., S.R., D.C., P.L., S.S., S.A.H., I.N.F., and M.v.L.C. are current employees or were past Amgen employees at the time when the experiments were performed. S.S. is Vice President of Nura Bio Inc. M.C. received research support from Amgen and serves on the Scientific Advisory Board of Vigil Neuroscience Inc.

Figures

Fig. 1.
Fig. 1.
hT2AB is a hTREM2 agonistic antibody. (A) hT2AB specifically binds to hTREM2 but does not bind to hTREM1 or mTREM2. The data show the binding signals of hTREM2-His to hT2AB measured by Octet. 1B12 is an anti-hTREM1 antibody that binds exclusively to hTREM1-His. There is no binding to either hTREM1-His or hTREM2-His to irrelevant hIgG2 (Left). hT2AB binds to hTREM2 transiently coexpressed with hDAP12 in HEK293 cells but does not bind to HEK293 cells that express mTREM2 and mDAP12 as measured by flow cytometry (Right). (B, C) Functional EC50 of hT2AB in HEK293 cells stably expressing hTREM2 and hDAP12 (clone G13) (B) and hMacs (C). Activation of hTREM2 was determined by measuring the induction of Syk phosphorylation (pSyk) after exposure of cells to different concentrations of hT2AB (n = 8). (D) Activation of hTREM2 by hT2AB IgG1 and hT2AB Fab was determined by measuring Syk phosphorylation in clone G13 exposed to different concentrations of antibodies (n = 3). (E) Quantification of sTREM2 in conditioned media from hMacs treated with different concentrations of hT2AB or control hIgG1 antibody for 24 h without any immune challenge (n = 4 for each group). (F) Quantification of CCL4 in conditioned media from hMacs treated with hT2AB or control hIgG1 antibody at 200 nM at different time points. Acetylated LDL was used as a positive control (n = 2 for each group). (G) Cell viability assay of BMMs from TREM2CV mice after CSF1 withdrawal were treated with different concentrations of plate bound hT2AB or control hIgG1 for 48 h (n = 3 for each group). (H) Binding assay of hT2AB for BMMs from TREM2CV and TREM2R47H. BMMs from Trem2−/− were used as a negative control. (I) 2B4 reporter cell lines expressing hTREM2 (CV or R47H) were stimulated with different amounts of plate bound hT2AB or control hIgG1. GFP expression was measured by flow cytometry (n = 2 for each group). (J) Cell viability of BMMs from TREM2R47H mice after CSF1 withdrawal treated with plate bound hT2AB or control hIgG1 at 10 μg/mL for 48 h. *P < 0.05; **P < 0.01 by two-way ANOVA with Sidak’s multiple comparisons test. All data in Fig. 1 are shown as mean ± SD except for B and C, which depict mean ± SEM.
Fig. 2.
Fig. 2.
Pharmacokinetics and pharmacodynamics of hT2AB. (AE) Pharmacodynamic study of hT2AB in TREM2CV, TREM2R47H, or Trem2−/− male mice. Different mouse cohorts received a single dose of hT2AB i.v. in the range of 0 (vehicle) to 100 mg/kg for 24 h. Concentrations of chemokines, including CXCL10 (A), CCL4 (B), CCL2 (C), and CXCL2 (D), as well as a microglia activation biomarker CST7 (E), were measured by MSD technology in brain lysates (vehicle, n = 4 for TREM2CV, n = 5 for TREM2R47H or Trem2−/−; 1, 3, and 10 mg/kg, n = 2 for TREM2CV or TREM2R47H; 30 mg/kg, n = 5 for all three genotypes; 100 mg/kg, n = 2 for TREM2CV or TREM2R47H, n = 5 for Trem2−/−). (F–K) A single dose of hT2AB was administered i.v. in TREM2R47H or Trem2−/− male mice at 30 mg/kg. Different mouse cohorts were killed 4, 8, and 24 h after antibody treatment, and brain tissues were collected and lysed for measurement of hT2AB antibody levels and expression of microglial activation biomarkers (n = 5 for each group). (F) hT2AB brain concentration (nanomolar) is ∼25-fold higher than the EC50 values for Syk phosphorylation (222 pM) in clone G13 up to 24 h after i.v. administration of 30 mg/kg hT2AB. qRT-PCR analysis showed increased expression of Cxcl10 (G), Ccl2 (H), Ccl4 (I), and Cst7 (J), as well as the homeostatic microglia marker Tmem119 (K), upon hT2AB treatment. *P < 0.05; **P < 0.01; ****P < 0.0001 by two-way ANOVA with Sidak’s multiple comparisons test; all data are shown as mean ± SD.
Fig. 3.
Fig. 3.
Sampling microglia from the human TREM25XFAD mouse models. (A) Two days after antibody injection, CD45+ cells were collected from cortex of male and female 5XFAD mice with endogenous Trem2 knockout (Trem2−/−) with or without one of two variants of a human TREM2: CV and R47H. A total of 71,303 cells passed scRNA-seq quality control. (BD) Supervised immune cell type classification. Individual cells were assigned a similarity score to 830 microarray samples of sorted mouse immune cells generated by the Immunologic Genome (ImmGen) Project. Cells were embedded in a lower-dimensional latent space while blocking observed covariates. Cell type labels were corrected by the enriched cell type of each segment of the latent space. (E) Uniform manifold approximation and projection of all cells representing the global data structure; cells are colored by the 10 identified immune cell types. (F) Differential gene expression of microglia. Absolute differences in expression levels to other CD45+ cells are quantified by effect size; gene expression specificity and gene detection rate were determined using conditional probabilities with uniform priors for cell types to avoid sample size bias. Specificity is defined by the posterior probability that a cell is of a certain cell type given it is expressing a particular gene; the detection level is defined by the relative fraction of cells expressing a particular gene. (G) Expression profiles of 13 microglia signature genes meeting the specificity threshold of 0.6 and an effect size threshold of 2.5, and perivascular gene markers Mrc1 and Pf4, as well as T cell markers Cd3g and Ms4a4; the mean expression of the Complement C1q subcomponents a, b, and c is shown.
Fig. 4.
Fig. 4.
Characterization of activated microglia populations. (A) Unsupervised clustering identified 10 distinct subpopulations spanning a trajectory from homeostatic microglia toward four terminal phenotypes. (B) Contingency tables counting agreements (diagonal) and disagreements (off-diagonal) between the expression profile of the DAM population described by Keren-Shaul et al. (9) and each cluster in this study; quantifications are based on (log2) 0.5-fold up- and down-regulated genes relative to the homeostatic population. A similarity score is calculated by subtracting the off-diagonal values from the sum of the diagonal values; P values are calculated testing the overall agreement between both studies. Increasing gene expression similarities along the trajectory from t1 via t6 to the DAM cluster, highlighted in red, can be observed. (C) Scoring of cell cycle states. Each cell was predicted to be either in G1, G2/M, or S phase using machine learning. One cluster highlighted in yellow, Cyc-M, shows strong enrichment of cycling cells. (D) Differential expression analysis reveals one cluster, IFN-R, that shows enrichment of genes related to the interferon pathway (D), and one cluster, MHC-II, enriched in genes encoding members of the MHC class II protein complex (E). The expression of selected marker genes is shown in D, and all MHC class I/II genes as annotated in the GO are shown in E. Fisher’s exact test with false discovery rate (FDR) correction was used for GO term enrichment analysis.
Fig. 5.
Fig. 5.
Genotype-driven effects on microglia fates. (A) Trajectory tree and visualization of computed linear trajectories from t5 toward each terminal microglia type. Pseudotime was inferred by fitting principal curves (black lines) in the lower dimensional manifold. Each datapoint represents a cell colorized by its pseudotemporal location along the trajectory. (BE) Alluvial plots showing the relative fraction of each genotype and its replicates over all pseudotime intervals (Upper); representation was corrected for different samples sizes. The lower image shows the distributions of estimated fractions of cells in the 90 to 100% pseudotime interval using Bootstrapping (Lower).
Fig. 6.
Fig. 6.
hT2AB treatment effects on the microglia trajectory. (A) Estimated relative population sizes per time interval along each trajectory starting from the branching point toward the terminal end type. (B) Trajectory-based differential expression analysis of the early and late microglial differentiation stages. P values were calculated using Wald statistics and corrected for multiple testing via FDR. The FDR was weighted by the sign of the log fold-change S by FDRS and -log10 transformed. Negative values denote hT2AB-induced down-regulation; positive values indicate up-regulation. Using an FDR cutoff of 0.01, transcriptional changes were classified into six categories: two transient with an early up-/down-regulation converging to baseline level and four permanent with either early and late up-/down-regulation or only late up-/down-regulation, respectively.
Fig. 7.
Fig. 7.
Sustained acute treatment with mT2AB affects microglial responses to pathology differently. (A) Schematic diagram of mT2AB treatment in TREM2CV-5XFAD or TREM2R47H-5XFAD mice. The 20-wk-old mice were injected intraperitoneally with murine mT2AB at 30 mg/kg every 3 d for 10 d. Littermates were administered the same concentration of control mIgG1 antibody. Mice were killed 24 h after the last antibody injection and brains were harvested for immunohistochemistry and biochemical analysis. (B) Quantification of cytokines and chemokines, such as IL-1β, CXCL10, and CCL4 in the cortex lysates among different treatment groups. *P < 0.05; ***P < 0.001; ****P < 0.0001 by two-way ANOVA with Sidak’s multiple comparisons test. Data are shown as mean ± SD. TREM2CV-5XFAD, male, mIgG1, n = 8; TREM2CV-5XFAD, male, mT2AB, n = 9; TREM2CV-5XFAD, female, mIgG1, n = 5; TREM2CV-5XFAD, female, mT2AB, n = 6; TREM2R47H-5XFAD, male, mIgG1, n = 4; TREM2R47H-5XFAD, male, mT2AB, n = 4; TREM2R47H-5XFAD, female, mIgG1, n = 4; TREM2R47H-5XFAD, female, mT2AB, n = 6.

References

    1. Long J. M., Holtzman D. M., Alzheimer disease: An update on pathobiology and treatment strategies. Cell 179, 312–339 (2019). - PMC - PubMed
    1. Selkoe D. J., Hardy J., The amyloid hypothesis of Alzheimer’s disease at 25 years. EMBO Mol. Med. 8, 595–608 (2016). - PMC - PubMed
    1. Heneka M. T., Microglia take centre stage in neurodegenerative disease. Nat. Rev. Immunol. 19, 79–80 (2019). - PubMed
    1. Tanzi R. E., Bertram L., Twenty years of the Alzheimer’s disease amyloid hypothesis: A genetic perspective. Cell 120, 545–555 (2005). - PubMed
    1. Karch C. M., Goate A. M., Alzheimer’s disease risk genes and mechanisms of disease pathogenesis. Biol. Psychiatry 77, 43–51 (2015). - PMC - PubMed

MeSH terms