. 2021 Feb 24;41(8):1830-1843.
doi: 10.1523/JNEUROSCI.1734-20.2020. Epub 2021 Jan 14.

Complement Drives Synaptic Degeneration and Progressive Cognitive Decline in the Chronic Phase after Traumatic Brain Injury

Affiliations

Complement Drives Synaptic Degeneration and Progressive Cognitive Decline in the Chronic Phase after Traumatic Brain Injury

Ali Alawieh et al. J Neurosci. .

Abstract

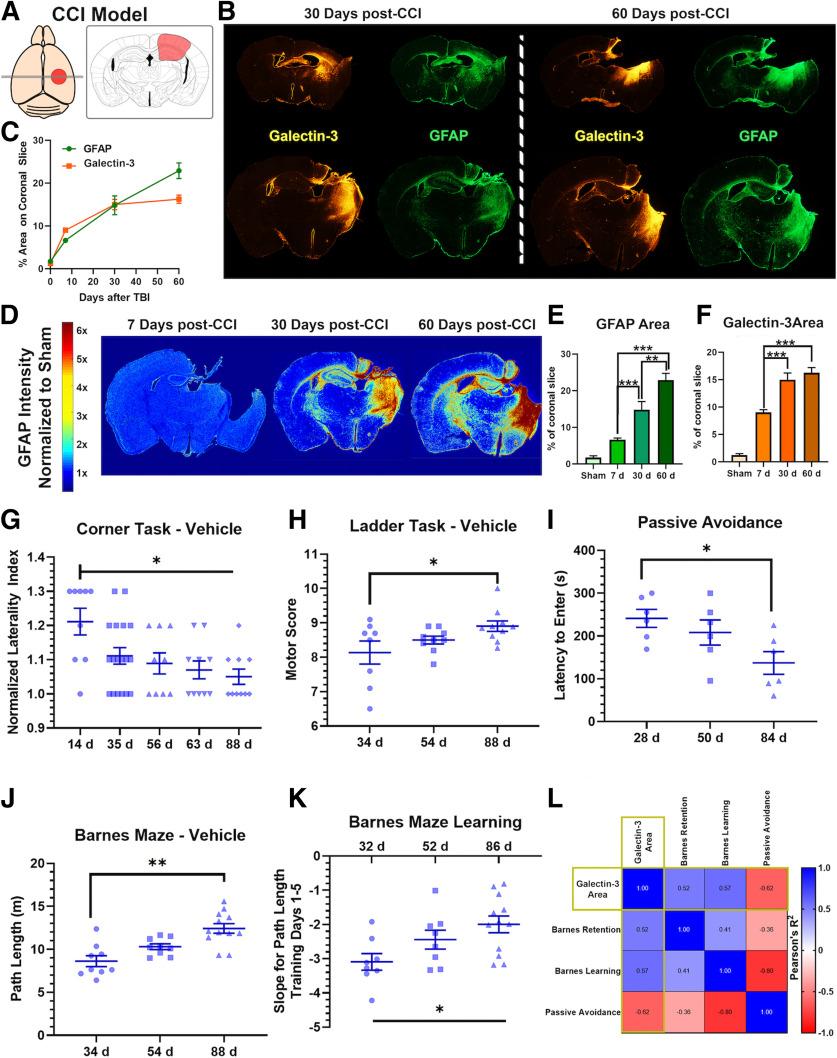
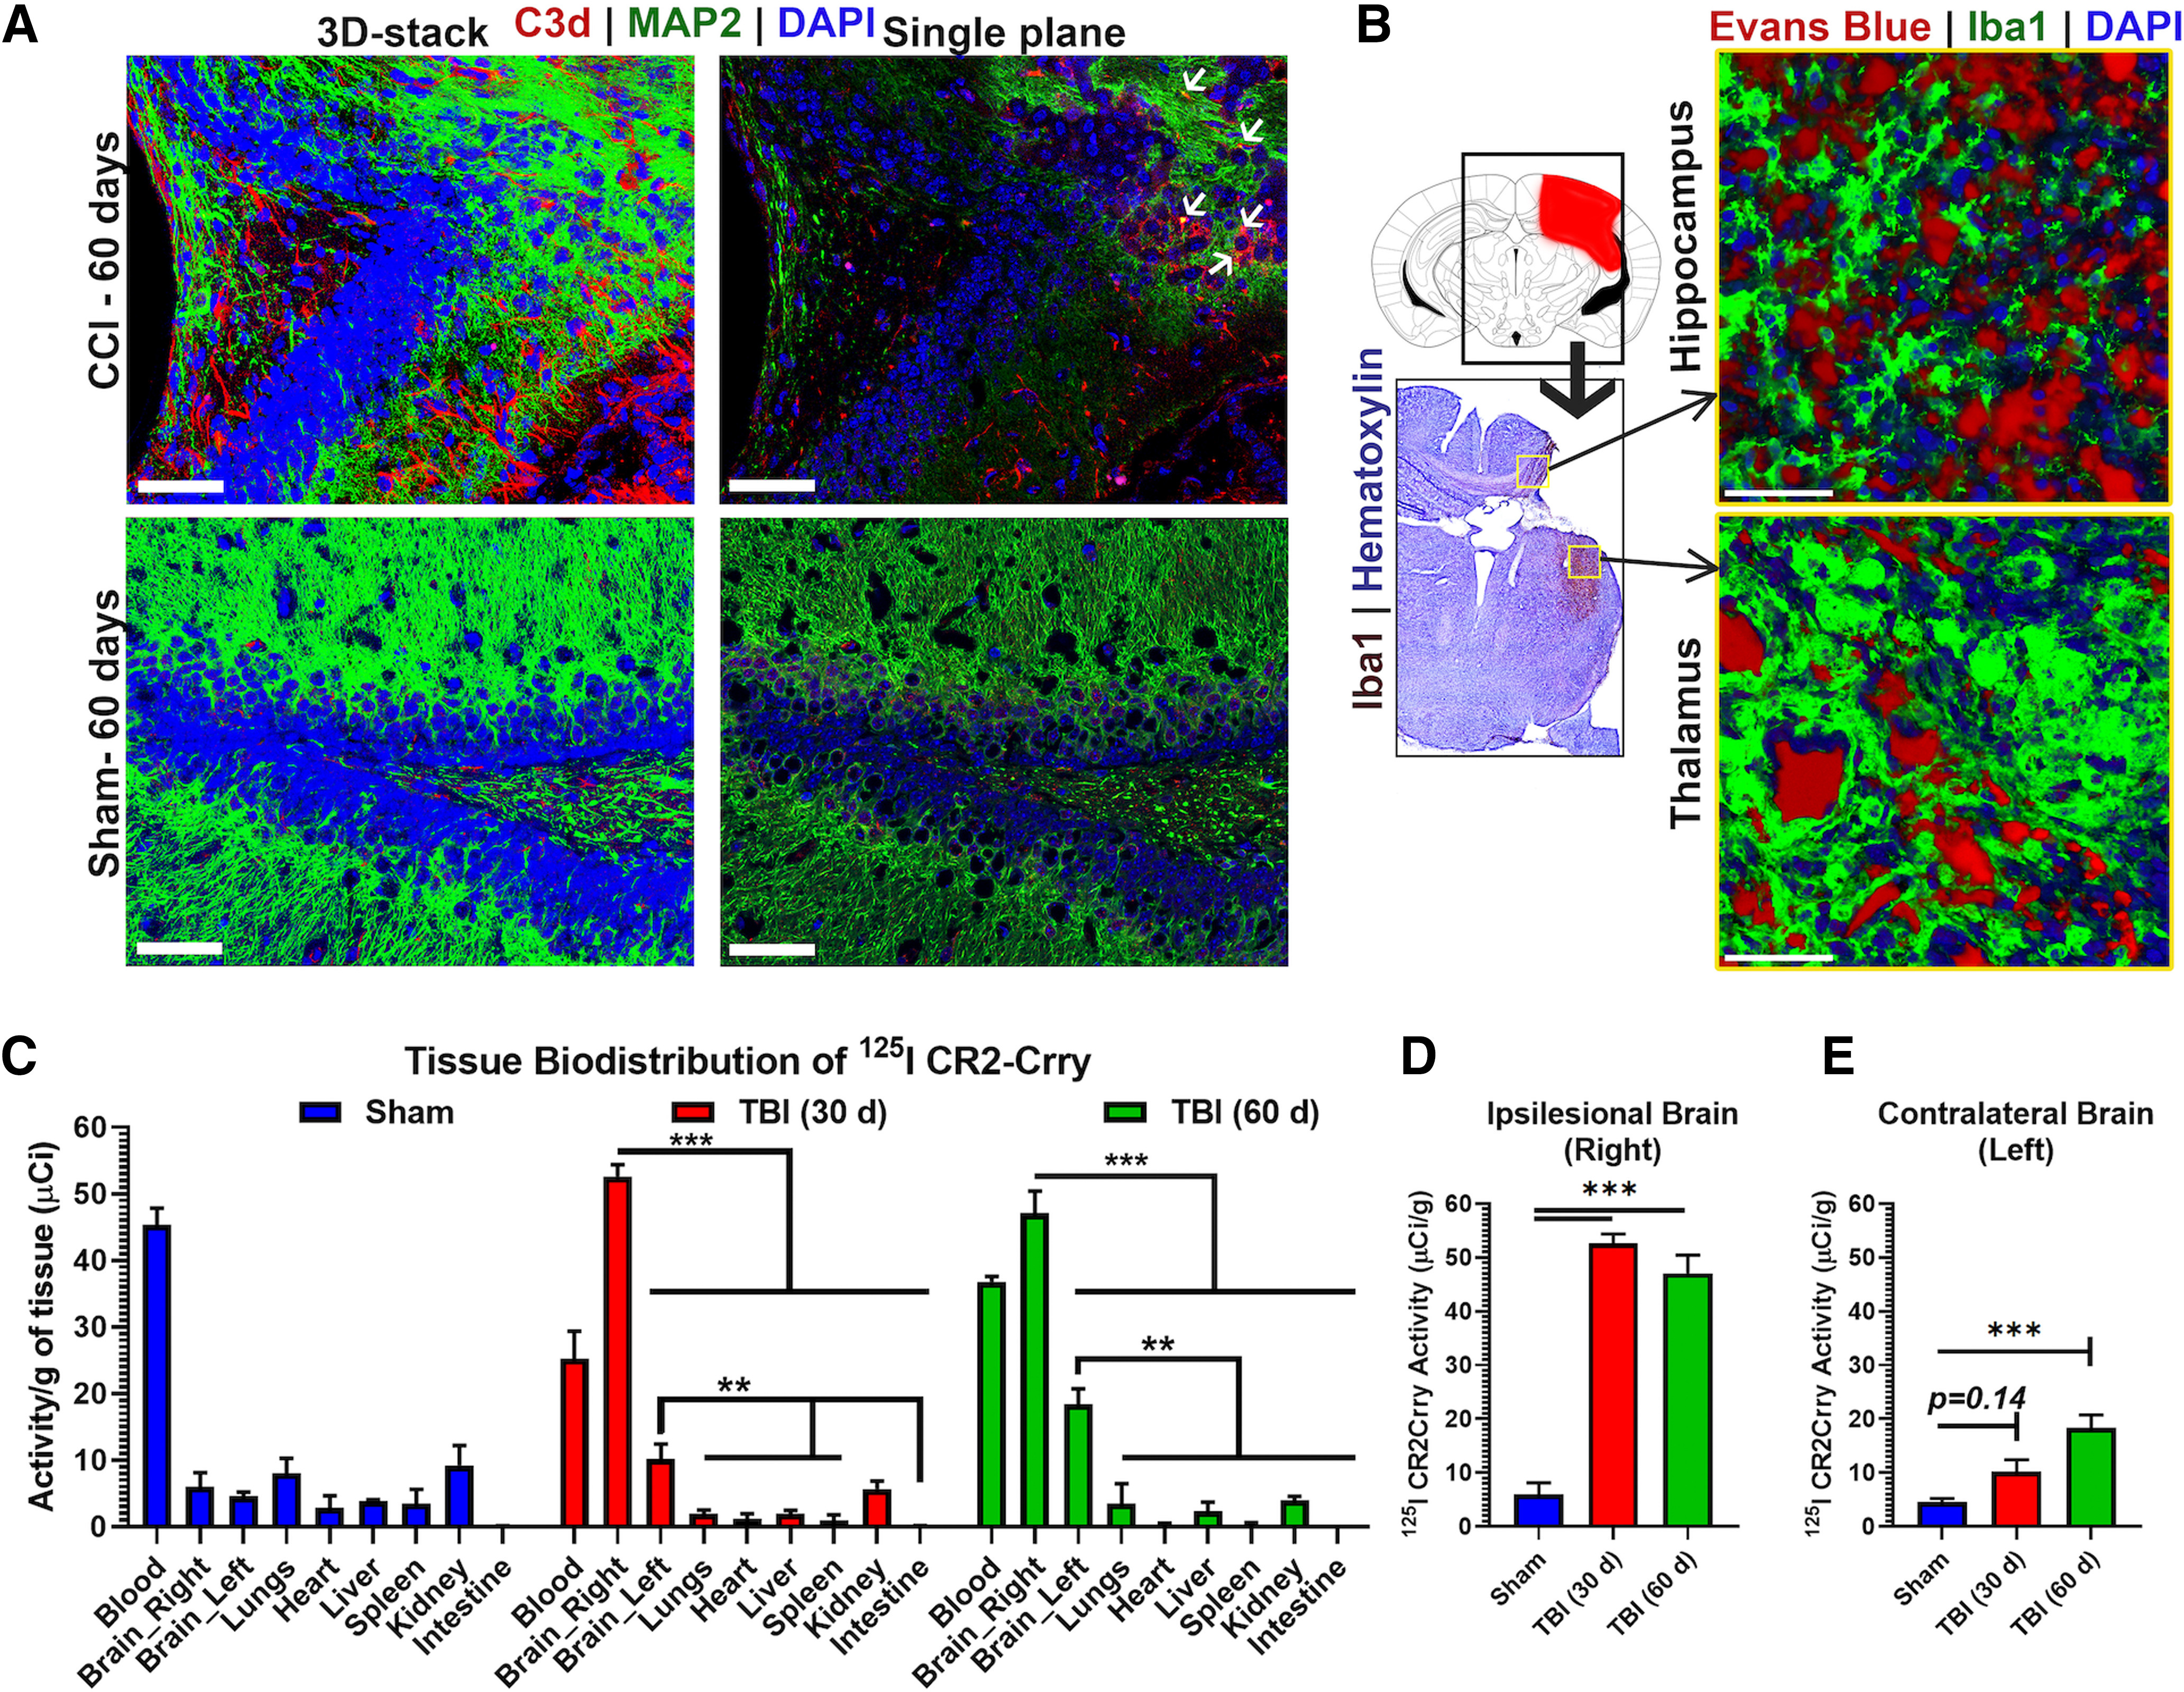
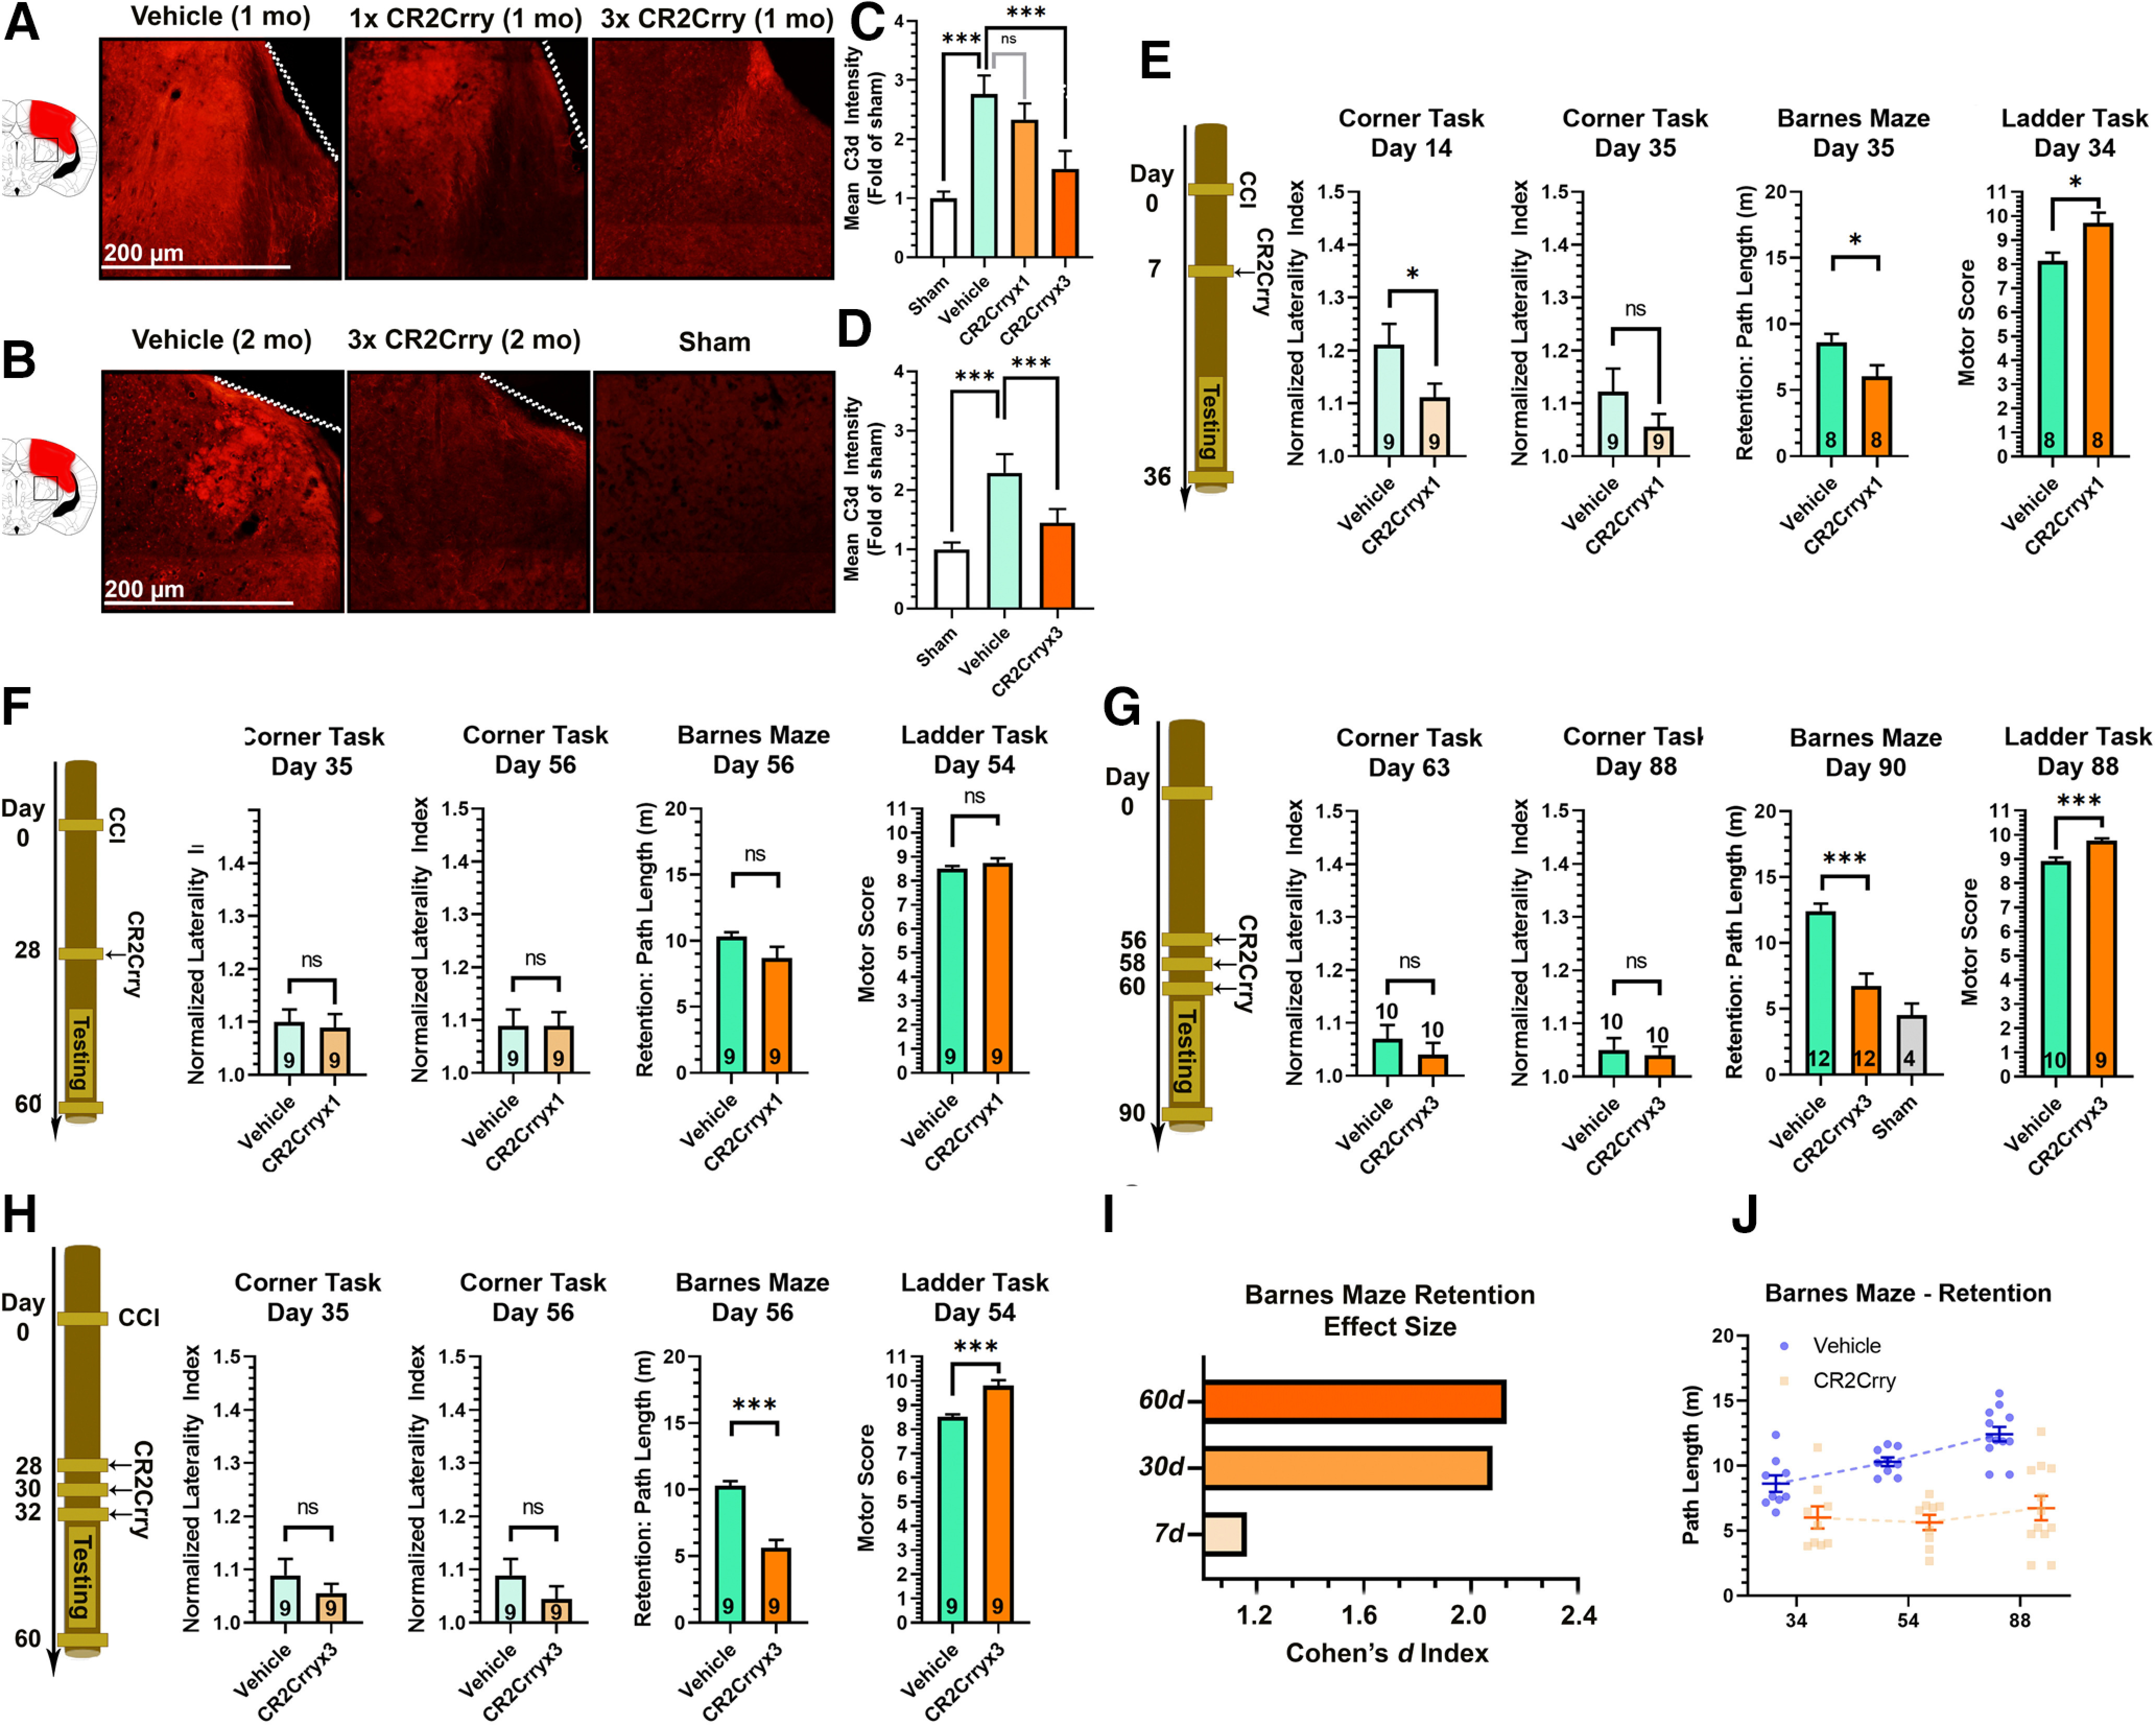
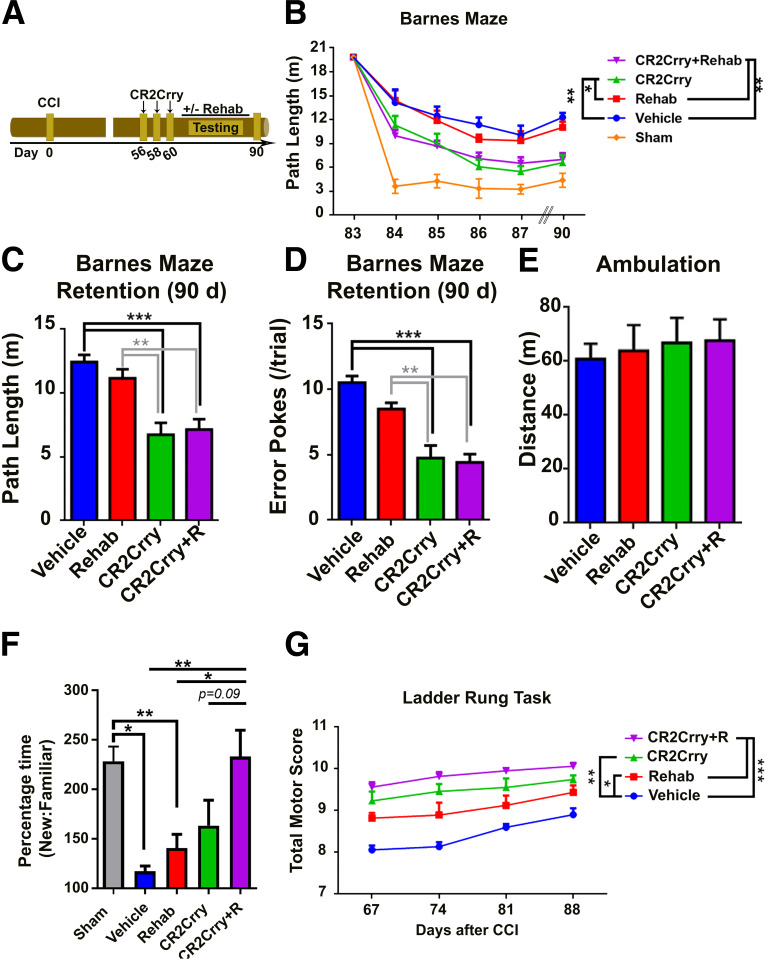
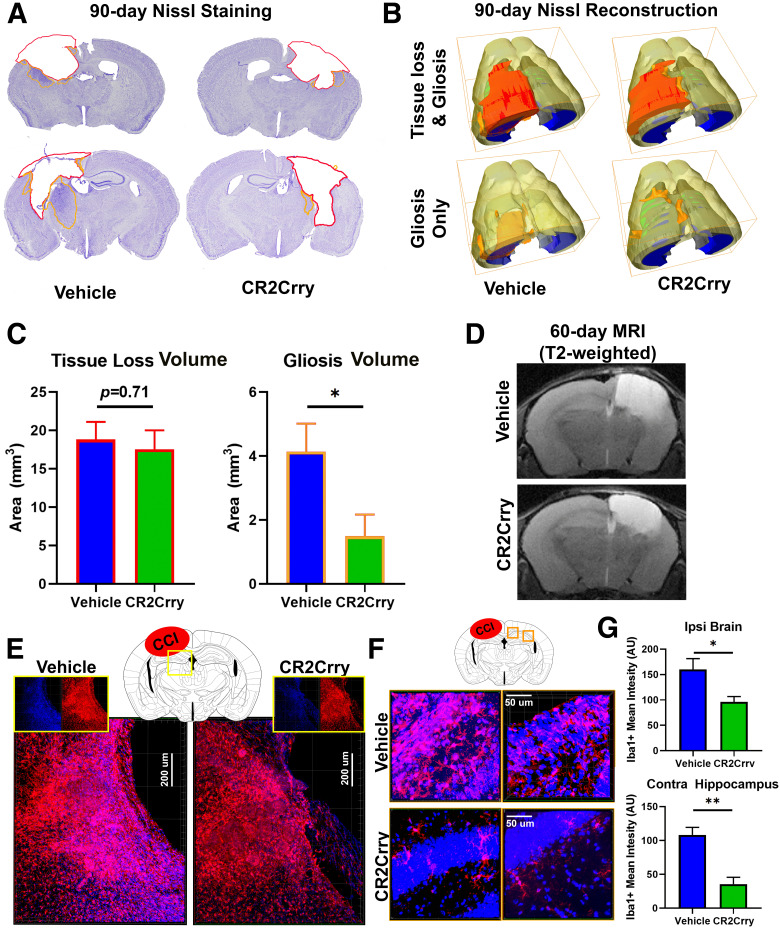
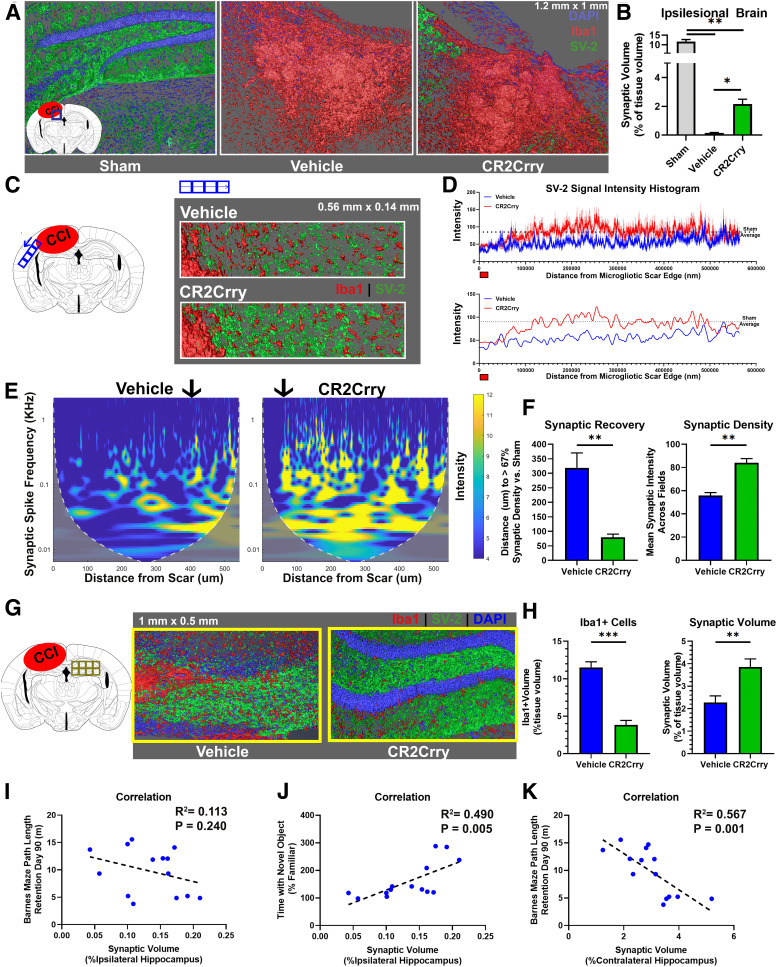
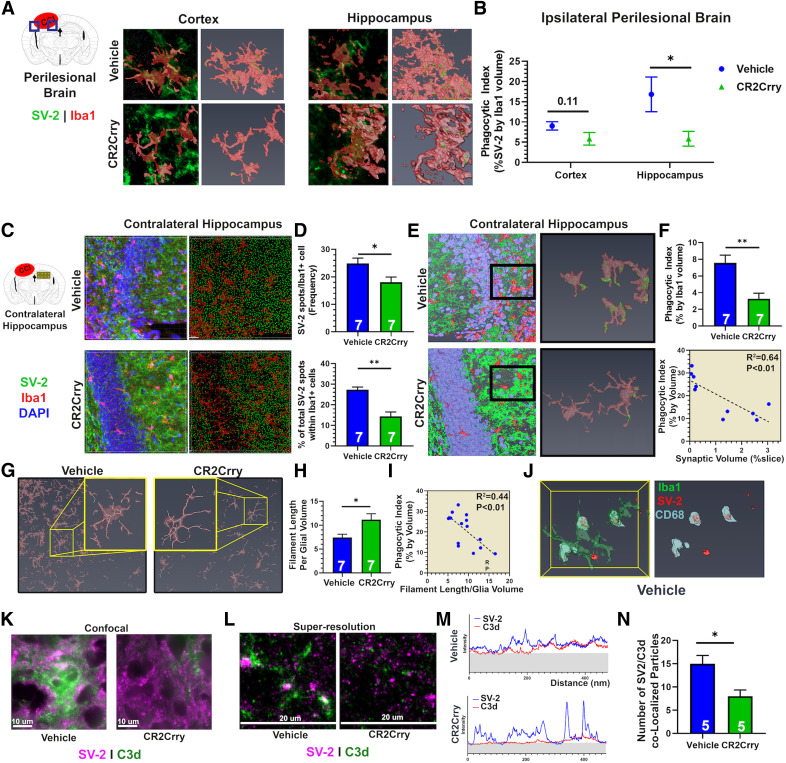
Cognitive deficits following traumatic brain injury (TBI) remain a major cause of disability and early-onset dementia, and there is increasing evidence that chronic neuroinflammation occurring after TBI plays an important role in this process. However, little is known about the molecular mechanisms responsible for triggering and maintaining chronic inflammation after TBI. Here, we identify complement, and specifically complement-mediated microglial phagocytosis of synapses, as a pathophysiological link between acute insult and a chronic neurodegenerative response that is associated with cognitive decline. Three months after an initial insult, there is ongoing complement activation in the injured brain of male C57BL/6 mice, which drives a robust chronic neuroinflammatory response extending to both hemispheres. This chronic neuroinflammatory response promotes synaptic degeneration and predicts progressive cognitive decline. Synaptic degeneration was driven by microglial phagocytosis of complement-opsonized synapses in both the ipsilateral and contralateral brain, and complement inhibition interrupted the degenerative neuroinflammatory response and reversed cognitive decline, even when therapy was delayed until 2 months after TBI. These findings provide new insight into our understanding of TBI pathology and its management; and whereas previous therapeutic investigations have focused almost exclusively on acute treatments, we show that all phases of TBI, including at chronic time points after TBI, may be amenable to therapeutic interventions, and specifically to complement inhibition.SIGNIFICANCE STATEMENT There is increasing evidence of a chronic neuroinflammatory response after traumatic brain injury (TBI), but little is known about the molecular mechanisms responsible for triggering and maintaining chronic inflammation. We identify complement, and specifically complement-mediated microglial phagocytosis of synapses, as a pathophysiological link between acute insult and a chronic neurodegenerative response, and further that this response is associated with cognitive decline. Complement inhibition interrupted this response and reversed cognitive decline, even when therapy was delayed until 2 months after injury. The data further support the concept that TBI should be considered a chronic rather than an acute disease condition, and have implications for the management of TBI in the chronic phase of injury, specifically with regard to the therapeutic application of complement inhibition.

Keywords: cognitive recovery; complement; neuroinflammation; therapy; traumatic brain injury.


Figures

Figure 1.
Figure 1.
Post-traumatic neuroinflammation persists and evolves during the chronic phase of TBI and predicts cognitive decline despite sustained motor recovery. A, Illustration of the location of brain impact in our TBI model. Red highlighted area represents area of primary impact. B, Extent of microgliosis (Galectin-3 IF) and astrocytosis (GFAP IF) in full coronal brain slices at 30 and 60 d after TBI showing evolution of the inflammatory response. C, Graphical illustration of the progression of astrocytosis in the murine brain after TBI over 60 d. Heat map reflects density of astrocytes normalized to density in sham brain. D,E,F, Quantification of (B) showing GFAP+ and Galectin-3+ cell density at different intervals after TBI. N = 4/group (6 sections each). **p < 0.01; ***p < 0.001; ANOVA. G,H, Performance on corner task (forearm laterality, N = 9-16/group) and ladder rung task (overall motor score, N = 8-10/group) at different time points after TBI in vehicle controls and sham controls. *p < 0.05 (ANOVA with Bonferroni). I, Avoidance learning was assessed using passive avoidance task by measuring the latency to enter a dark chamber associated with a shock in independent cohorts of animals at different time points after TBI or sham surgery. J, K, Barnes maze testing for spatial learning and memory performed by training the animals for 5 d to find escape hole on elevated maze, followed by assessing the retention of memory after 48 h of last session (day 7 of the task). We computed the path length (distance needed to find the escape hole) on each of the 5 training days and on the testing day (retention day). Two measures were obtained from the task: the path length on the retention day that reflects the retention of learned spatial memory, and the slope of improvement in path length during the 5 training days that reflects the difference in temporal dynamics of learning. The slope is a negative measure as it reflects the expected reduction of path length with additional training days. I, Path length to find escape hole on retention day, and (J) slope of path length during the 5 d of training, as assessed in an independent cohort of animals trained starting 27, 47, or 81 d after TBI. N = 9-12/group. *p < 0.05; **p < 0.01; ANOVA with Bonferroni. N = 6/group. *p < 0.05 (ANOVA with Bonferroni). L, To evaluate whether the performance of behavioral tasks correlated with the histologic extent of neuroinflammation, we analyzed the correlation matrix between the different behavioral tasks and the density of Galectin-3 deposition in the brain on day 60 after TBI. R2 for each correlation is shown on heat map. All correlations with Galectin-3 area were significant with p < 0.001 and |R2|>0.5.
Figure 2.
Figure 2.
Ongoing complement deposition and BBB leakage 60 d after murine TBI. A, IF staining in the perilesional brain 60 d after TBI showing robust complement deposition (red) in injured but not sham brains. Scale bars, 50 µm. Left, Rendered 3D-stack covering 40 μm volume. Right, Single-slice view showing colocalization of C3d with MAP2+ neurons (green). B, Coimmunostaining for Iba1 (microglial marker, green) and Evans blue (red) administered intravenously before brain harvest showing BBB leakage and Evans blue extravasation in areas of microgliosis in the perilesional hippocampus and thalamus in TBI mice but not in sham controls. Scale bars, 50 µm. C, Biodistribution study for localization of CR2Crry in sham animals and animals subjected to TBI. 125I CR2Crry injected in sham animals or TBI animals at 30 or 60 d after injury, followed by tissue analysis for 125I activity at 6 h after administration. N = 3/group. **p < 0.01; ***p < 0.001; ANOVA with Bonferroni. D, E, Comparison of CR2Crry localization to the ipsilateral and contralateral hemisphere in TBI animals at 30 and 60 d after TBI compared with sham. ANOVA with Bonferroni. N = 3/group. ***p < 0.001.
Figure 3.
Figure 3.
Chronically administered CR2Crry suppresses C3d deposition in the brain after TBI. A, B, IF staining for C3d deposition in the perilesional brain following TBI and administration of CR2Crry or vehicle. A, Mice were treated at 30 d after TBI with a single dose of PBS vehicle of CR2Crry, or with 3 doses of CR2Crry every 48 h. C3d deposition was measured 1 week after initiation of treatment. B, Mice were treated at 2 months after TBI with 3 doses of PBS or CR2Crry every 48 h. C3d deposition was measured 1 week after initiation of treatment. Fields are 250 µm × 250 µm, representative images. C, D, Quantification of C3d deposition in A, B, using mean IF intensity compared with sham using unbiased stereology. N = 5 animals/group (2 or 3 slices per mouse). ***p < 0.001 (ANOVA with Bonferroni). E–H, Motor and cognitive outcomes measures, as indicated, after vehicle or CR2Crry treatment. E, Single-dose CR2Crry treatment at 7 d after TBI. F, Single-dose CR2Crry treatment at 28 d after TBI. G, Three doses of CR2Crry treatment every 48 h starting 28 d after TBI. H, Three doses of CR2Crry treatment every 48 h starting 56 d after TBI. Student's t test. N values shown on bars. *p < 0.05. ***p < 0.001. I, Effect size of CR2Crry treatment on Barnes maze performance compared with vehicle at different time points of administration measured via the Cohen's d index. J, Change in path length on retention day at different time points after TBI between vehicle and CR2Crry-treated animals. N = 8-12/group. ns = p > 0.05.
Figure 4.
Figure 4.
Rehabilitation therapy does not reverse cognitive decline after TBI. A, Schematic of treatment and testing paradigm. Following TBI, mice were treated with 3 doses of CR2Crry or vehicle and exposed to either 30 d of enriched environment (motor and cognitive enrichment, rehabilitation) or standard housing, with assessment for performance on motor and cognitive tasks at 90 d. Dashed line indicates border of injury site. B, Spatial learning and retention of spatial memory on Barnes maze among mice treated with different combinations of CR2Crry, vehicle, and rehabilitation. N = 12/group. *p < 0.05; **p < 0.01; repeated-measures ANOVA with Bonferroni. C, D, Comparison of path length and number of error pokes (not in target hole) on retention day between the different groups. N = 12/group. **p < 0.01; ***p < 0.001; ANOVA with Bonferroni. E, Comparison of total ambulation distance on open field testing of animals from the different groups. ANOVA with Bonferroni. N = 12/group. F, Performance on NOR task between the different treatment groups compared with sham. Percentage time spent near novel versus familiar object. N = 7/group. *p < 0.05; **p < 0.01; ANOVA with Bonferroni. G, Motor score on ladder rung task at different time points following TBI. Repeated-measures ANOVA with Bonferroni. N = 9/group.
Figure 5.
Figure 5.
CR2Crry inhibits gliosis but not lesion volume after TBI. A, Representative Nissl immunostaining of animals treated with vehicle or CR2Crry starting day 56 (3 doses every 48 h). Brains were extracted on day 90 after TBI for analysis. Red contour represents area of tissue loss. Orange contour represents area of gliosis. B, 3D reconstruction of lesion volume from Nissl-stained serial sections (40 µm thick, 200 µm apart) using Amira to show volumes of tissue loss and gliosis. C, Quantification of volume of tissue loss and gliosis shown in B. N = 8/group. *p < 0.05 (Student's t test). D, Representative T2-weighted MRI images of animals treated as in A showing similar area of tissue loss (T2 Bright) between vehicle and CR2-Crry treated mice at 1 week after treatment. E, F, High-resolution IF staining for perilesional ipsilateral (E) and contralateral (F) cortex and hippocampus showing density of Iba1+ cells (red). G, Quantification of IF staining in E and F. N = 5 animals/group (2 or 3 sections each). *p < 0.05; **p < 0.01; Student's t test.
Figure 6.
Figure 6.
Complement inhibition at 2 months after TBI prevents ongoing synaptic loss. Animals were subjected to TBI at 12 weeks of age, and treated over 1 week with 3 doses of CR2Crry or vehicle every other day starting 2 months after TBI. Analyses were performed at 3 months after TBI. A, Confocal imaging of 1.2 mm × 1 mm × 0.04 mm IF fields from the perilesional brain of sham, or vehicle and CR2-Crry treated mice stained for synaptic bodies (SV-2, green), microglia/macrophages (Iba1, red), and DAPI (blue). Shown are 3D fields reconstructed using Amira from the same stereotactic lesion. Loss of hippocampal architecture is evident in post-TBI brains. B, The total synaptic volume was quantified, using Amira 3D volume reconstruction, as a percentage of synaptic volume per tissue volume. N = 5 animals/group. *p < 0.05; **p < 0.01; Welch's ANOVA test with Dunnett's multiple comparisons. C, Synapse (SV-2, green) and microglia (Iba1, red) staining of sections selected from the perilesional brain starting from the edge of the scar over a 0.5 mm length. Representative images showing 3D stack of 40-μm-thick sections, imaged using confocal microscopy. D, Top, Histogram showing changes in synaptic signal intensity as a function of distance from gliotic scar edge (red marker), from vehicle and CR2-Crry-treated animals. Shown are mean ± SEM per distance data point. N = 5 animals/group. Bottom, Smoothed curve of the change in synaptic density over distance between groups. Dashed line indicates sham density. Curve indicates earlier normalization of synaptic intensity in CR2Crry-treated mice compared with vehicle. E, Magnitude scalogram for data from D, showing the intensity (power) of synaptic signal over distance from gliotic scar in terms of different frequencies of peaks (spikes in histogram denoting individual synapses). Scalograms represent a clearly higher intensity in CR2Crry-treated animals across higher frequencies compared with vehicle. Black arrow indicates distance at which synaptic density recovers 67% intensity compared with that in sham animals. F, Quantification of synaptic recovery measured as the distance to recover 67% of synaptic density, and the overall synaptic density across the two groups. N = 5 animals/group. **p < 0.01 (Student's t test). G, High-resolution 3D reconstruction of the contralateral hippocampus from confocal imaging of SV-2 and Iba1-stained slices at 90 d after TBI. H, Quantification of Iba1 cell density and synaptic volume from vehicle and CR2-Crry-treated mice. N = 5 animals/group. **p < 0.01; ***p < 0.001; Student's t test. I–K, Correlation of ipsilateral synaptic volume with performance on Barnes maze on day 90 (I) and performance on NOR task on day 90 (J). K, Correlation of synaptic volume in contralateral hippocampus with Barnes maze performance. Shown on graph are R2, p value, and N for Pearson's coefficient for linear correlation. Error bars indicate mean ± SEM. Blue circles represent vehicle. Green circles represent CR2Crry.
Figure 7.
Figure 7.
Complement guides microglial phagocytosis of synapses chronically after TBI. Animals were subjected to TBI at 12 weeks of age, and treated over 1 week with 3 doses of CR2Crry or vehicle every other day starting 2 months after TBI. Analyses were performed at 3 months after TBI. A, Super-resolution IF staining of SV-2 and Iba1 in the perilesional brain showing colocalization of synaptic material to microglial cell bodies. Shown are the 2D snapshots of the Iba1 volume (red) and SV-2 (green) signal (left) and the 3D volume of microglia showing synaptic material within the Iba1 volume (right) from both cortex and hippocampus. B, Quantification of the phagocytic index (volume of SV-2 signal within Iba1 cells to volume of Iba1 cells) from the cortex and hippocampus of both groups. N = 5 animals/group. *p < 0.05 (Student's t test). C, Confocal IF imaging of the contralateral hippocampus stained for SV-2 and Iba1 (left column) followed by automated 3D reconstruction and spot analysis by Imaris representing synapses as spots in 3D space (right column; see Materials and Methods). D, Quantification of synaptic puncta or spots within microglia cells from C. N = 7 animals/group. *p < 0.05; **p < 0.01; Student's t test. E, Representative 3D reconstruction of high-power fields from contralateral hippocampus followed by selection and reconstruction of individual microglia with internalized synaptic material: green represents SV-2; red represents Iba1; blue represents DAPI. Fields are 212 × 212 × 40 μm. F, Quantification of phagocytic index in contralateral hippocampus. N = 7 animals/group. **p < 0.01 (Student's t test). G, Representative high-power fields from the contralateral hippocampus stained for Iba1 followed by filament analysis in Imaris to assess for extent and length of branching per microglia. H, Quantification of the length of microglial branching in G, normalized to the microglial volume. N = 7 animals/group. *p < 0.05 (Student's t test). I, Correlation of length of microglial branching and phagocytic index. Pearson's correlation, R2 = 0.44, p < 0.01. J, IF staining for Iba1 (red), CD68 (yellow), and SV-2 (green) followed by reconstruction of individual microglia in Amira showing colocalization of CD68 and SV-2 signal. Clusters of CD68-SV-2 colocalization were observed in vehicle controls and not in CR2Crry-treated mice. K, L, Confocal and super-resolution imaging of SV-2 and C3d colocalization using Vutara 352 super-resolution microscopy. M, Quantification of intensity histogram for both SV-2 and C3d signals. Shaded region represents background signal. N, Quantification of colocalization of peaks in M between the two experimental groups. N = 5 animals/group. **p < 0.05 (Student's t test). Error bars indicate mean ± SEM.

References

    1. Alawieh A, Elvington A, Tomlinson S (2015) Complement in the homeostatic and ischemic brain. Front Immunol 6:417. 10.3389/fimmu.2015.00417 - DOI - PMC - PubMed
    1. Alawieh A, Langley EF, Tomlinson S (2018a) Targeted complement inhibition salvages stressed neurons and inhibits neuroinflammation after stroke in mice. Sci Transl Med 10:eaao6459. - PMC - PubMed
    1. Alawieh A, Andersen M, Adkins DL, Tomlinson S (2018b) Acute complement inhibition potentiates neurorehabilitation and enhances tPA-mediated neuroprotection. J Neurosci 38:6527–6545. 10.1523/JNEUROSCI.0111-18.2018 - DOI - PMC - PubMed
    1. Alawieh A, Langley EF, Weber S, Adkins D, Tomlinson S (2018c) Identifying the role of complement in triggering neuroinflammation after traumatic brain injury. J Neurosci 38:2519–2532. 10.1523/JNEUROSCI.2197-17.2018 - DOI - PMC - PubMed
    1. Atkinson C, Song H, Lu B, Qiao F, Burns TA, Holers VM, Tsokos GC, Tomlinson S (2005) Targeted complement inhibition by C3d recognition ameliorates tissue injury without apparent increase in susceptibility to infection. J Clin Invest 115:2444–2453. 10.1172/JCI25208 - DOI - PMC - PubMed

Publication types

LinkOut - more resources