. 2021 Mar 3;41(9):1878-1891.
doi: 10.1523/JNEUROSCI.1204-20.2020. Epub 2021 Jan 14.

Premotor Ramping of Thalamic Neuronal Activity Is Modulated by Nigral Inputs and Contributes to Control the Timing of Action Release

Affiliations

Premotor Ramping of Thalamic Neuronal Activity Is Modulated by Nigral Inputs and Contributes to Control the Timing of Action Release

Julien Catanese et al. J Neurosci. .

Abstract

The ventromedial (VM)/ventro-anterior-lateral (VAL) motor thalamus is a key junction within the brain circuits sustaining normal and pathologic motor control functions and decision-making. In this area of thalamus, on one hand, the inhibitory nigro-thalamic pathway provides a main output from the basal ganglia, and, on the other hand, motor thalamo-cortical loops are involved in the maintenance of ramping preparatory activity before goal-directed movements. To better understand the nigral impact on thalamic activity, we recorded electrophysiological responses from VM/VAL neurons while male and female mice were performing a delayed right/left decision licking task. Analysis of correct (corr) and error trials revealed that thalamic ramping activity was stronger for premature licks (impulsive action) and weaker for trials with no licks [omission (omi)] compared with correct trials. Suppressing ramping activity through optogenetic activation of nigral terminals in the motor thalamus during the delay epoch of the task led to a reduced probability of impulsive action and an increased amount of omissions trials. We propose a parsimonious model explaining our data and conclude that a thalamic ramping mechanism contributes to the control of proper timing of action release and that inhibitory nigral inputs are sufficient to interrupt this mechanism and modulate the amount of motor impulsivity in this task.SIGNIFICANCE STATEMENT Coordinated neural activity in motor circuits is essential for correct movement preparation and execution, and even slight imbalances in neural processing can lead to failure in behavioral tasks or motor disorders. Here we focused on how failure to regulate the control of activity balance in the motor thalamus can be implicated in impulsive action release or omissions to act, through an activity ramping mechanism that is required for proper action release. Using optogenetic activation of inhibitory basal ganglia terminals in motor thalamus we show that basal ganglia input is well positioned to control this ramping activity and determine the timing of action initiation.

Keywords: VM thalamus; basal ganglia; behavior; electrophysiology; mouse; optogenetics.


Figures

Figure 1.
Figure 1.
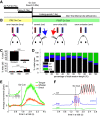
Mouse behavior in tactile cued choice delayed the response task. A, Schematic time course of a task trial. At the start of each trial, a mild puff of air (air-puff epoch) was delivered pseudorandomly on the left or on the right whiskers of the head-fixed mouse for 75 s. Once the air puff stopped, the mouse had to continue to withhold licking during the delay epoch (750 ms). The end of the delay was indicated by a Go signal (sound) after which the mouse could initiate the decision lick denoting the choice of side (licking epoch). If the decision lick was for the correct side spout during the licking epoch, a water reward was delivered. Trials were separated by a 3 s minimum ITI. Any licks during the ITI led to a restart of the counter and to starting the next trial at 2 s, ensuring that at the onset of each trial the mice had completely stopped licking from the previous trial. B, Schematic of the four possible trial outcomes: (1) error impulsive lick (before Go cue); (2) correct lick; (3) error lick on the wrong side; and (4) error because of no licking during the licking epoch (omission). C, Bar graph (mean and SEM) of the behavioral results (n = 15 sessions, five mice, 2060 trials) obtained after training periods, during electrophysiological recording. Top, Percentage over the total amount of correct and eSi trials. We found significantly more correct trials (cor = 87.4 ± 10.4%; mean ± SD) Two-sample t test (n = 15; ***p < 0.0001). Bottom, Percentage among all trials. Errors because of choice of side (eSi) were less frequent than errors related to timing (imp+omi). D, Distribution of trial outcomes across sessions. Averaged across 15 sessions, five mice. eSi trials were not included. E, Average DeepLabCut tracks from the video analysis of tongue, snout, and whisker movements during correct trials (six sessions from four mice). Data are shown as absolute values of changes in tracked position in pixels relative to baseline along the y-axis (top-to-bottom movement in Movies 1, 2, 3, 4) for tongue and snout movement and along the x-axis (right-to-left movement in Movies 1, 2, 3, 4) for whisker motion. For each trial, 100 frames were taken at 25 Hz. The inset shows that tongue movement can be detected up to 200 ms before the Go cue in some trials. F, Examples of DeepLabCut tongue tracking (raw data) for cor, imp, and omi single trials. Note that a typical correct lick sequence starts by one decision lick followed by a bout of several retrieval licks (black trace). The lick sensor TTL activation is represented by vertical red lines. Scale bar (vertical blue), 2.6 mm (the distance between the spout and the mouth). Note that when the lick did not reach or miss the spout, the lick sensor did not activate, as shown by the first tongue movement in the impulsive trial. Note that our 25 Hz (40 ms/frame) video acquisition was not fast enough to determine the exact onset of tongue protrusion with respect to lick sensor detection, but that the approximate timing of the tongue trajectory is fully consistent with the timing of tongue protrusion starting 33 ms before spout contact for cue-evoked licks seen with videos taken at 1 kHz (Bollu et al., 2019).
Figure 2.
Figure 2.
Histologic reconstruction and single-unit quality metrics. A, Nissl stain from a representative coronal brain slice revealing the position of an electrode track within the VM thalamus (red circle). Scale bar, 2 mm. B, Immunohistochemical image from a representative coronal brain slice using anti-GFP antibody revealed GFP expression because of AAV vector injection into SNr (see Materials and Methods) with horseradish peroxidase (darker area). The location of GFP confirms the presence of GABAergic SNr terminals in VM thalamus (red circle) where the electrode track is located. C, Example of electrode track reconstruction, and registration to the Allen Brain Atlas. Sagittal schematic representation of a mouse brain with each brain area delimited by black lines. The VM and VAL thalamus (colored red and blue, respectively) contained three electrode shanks (green lines) and their channels (green circles). Channels were spaced by 100 µm. Shanks were spaced by 200 µm. D, ISI distribution for six VM/VAL single units. For each unit, a % rpv of 3 ms is indicated. The average spike wave is also depicted (red traces). Each spike trace is 2 ms. Calibration: 100 µV. E, Distribution of % rpv for all 462 VM/VAL thalamic neurons recorded. The inset shows only 3 units with >2.5% rpv, which should not be considered as an isolated single unit.
Figure 3.
Figure 3.
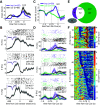
VM/VAL thalamic neuronal responses during correct trials reveal the ramping pattern during the delay of the task at both single-unit and population levels. A, Venn diagram representing different types of single-unit firing rate modulation during the task. Red, Task-excited cells (firing increase only); green, task inhibited (firing rate decreased only); orange, cells with complex task modulation (both increases and decreases firing rate); and gray, cells not significantly modulated (462 VM/VAL neurons from 15 sessions, five mice). B, Raster plots and spike rate functions for six VM/VAL single units, providing representative examples of the six types of dynamic neuronal responses observed during the correct trials of the task. The orange horizontal bar represents the time of air-puff delivery, violet and red dashed lines represent the onset of the delay and Go cue, respectively. ISI distribution and % rpv of these units are given Figure 2D. C, Venn diagram representing the different dynamic response types (of the 338 VM/VAL neurons excited during the task; red in A). We found units with significant modulation (z > 3) only during a single epoch: air puff (type 1), delay (type 2), or licking (type 3), or single units showing significant modulation in multiple epochs (double or triple response types). D, Average firing rate normalized to baseline (z score) as a function of time for neuronal groups defined in A based on their firing rate properties. E, Trial-averaged heat map of baseline normalized firing rates for all units sorted by the first occurrence of z > 3 during the delay. This map shows the broad distribution of ramping activity initiation between different units. F, Trial-averaged heat map of the peak (maximum) normalized firing rate for all units sorted by peak time. This map shows that a large proportion of units had their spike rate maximum shortly after the onset of the air puff or during the licking epoch. Note that this timing of maximal firing rates does not preclude ramping activity during the delay epoch or the presence of additional distinct (but smaller) peaks in spike rate.
Figure 4.
Figure 4.
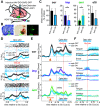
Thalamic ramping activity during the delay is increased before impulsive licking and reduced during omission trials. A, Lick-centered population averaged (60 neurons) z score as a function of time for correct and impulsive trials. Note that both trial outcomes show ramping with a similar dynamic up to 600 ms before the first lick. Shading represents 2 SEMs. B, Lick-centered raster and spike rate function from three representative VM/VAL neurons recorded from different mice during correct trials. Violet traces, Average spike wave forms. Each trace is 2 ms in total duration. Calibration: 100 µV. C, Go cue-centered population-normalized spike rates during imp and omi trials relative to correct trials (dZ; see Materials and Methods). The horizontal dashed lines at 0 dZ indicate no difference from correct trials. Note that during the delay the two populations diverge from 0 in opposite directions, indicating that during the delay impulsive selective neurons tend to overactivate while omi-selective neurons underactivate relative to correct trials. Shading represents 2 SEMs. D, Examples of single-unit activity separated by trial type, imp (violet), omi (green), and cor (black). Each panel represents a raster and spike rate function for each type of trial outcome for a representative VM/VAL neuron. Shading in the trial averages represents 2 SEMs. E, Venn diagram of 234 VM/VAL neurons with a significant firing rate difference compared with cor trials during the delay epoch (dZ > 3) for omi trials (green), imp trials (violet), or both (white). No difference (gray). Obtained form 11 sessions, four mice. F, Heat map representing z scored activity difference between impulsive and correct trials for all selective units during impulsive trials (top) and for the difference between omission and correct trials (bottom).
Figure 5.
Figure 5.
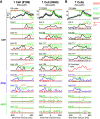
Single-trial analysis of motor thalamic neuronal activity in relation to body movements. A, Examples of single-trial firing rate changes for two representative VM/VAL neurons (one neuron per column). Spike rate functions (smoothed with a 40 ms Gaussian kernel) and the corresponding DeepLabCut traces are aligned to the Go cue. The first row shows the average for all correctly executed trials (black trace). The other rows display representative single trials (corresponding to Movies 2, 3), with five cor, two imp, and two omi trials per neuron. Red ticks represent single spikes. Colored traces represent spike rate functions (smoothed with a 40 ms Gaussian kernel) and the corresponding DeepLabCut traces (video frames were obtained every 40 ms). B, Same as A, but for a group of seven neurons recorded simultaneously (including cell #489 from A). Note that the ramping pattern tends to be clearer at the single-trial level for a group of cells compared with a single cell (e.g., trials #117 and #147, in A and B). Vertical ticks denoting spikes emitted by different neurons are identified by color. The sixth row represents the trial average (red) over the five correct trials shown above (trials #4, #65, #117, #147, and #196). The seven neurons were recorded simultaneously from seven different channels (#474, #476, #479, #480, #489, #492, and #494; %rpv: 0.5%, 1%, 0.9%, 0.9%, 0.7%, 0.9%, and 0.4%, respectively).
Figure 6.
Figure 6.
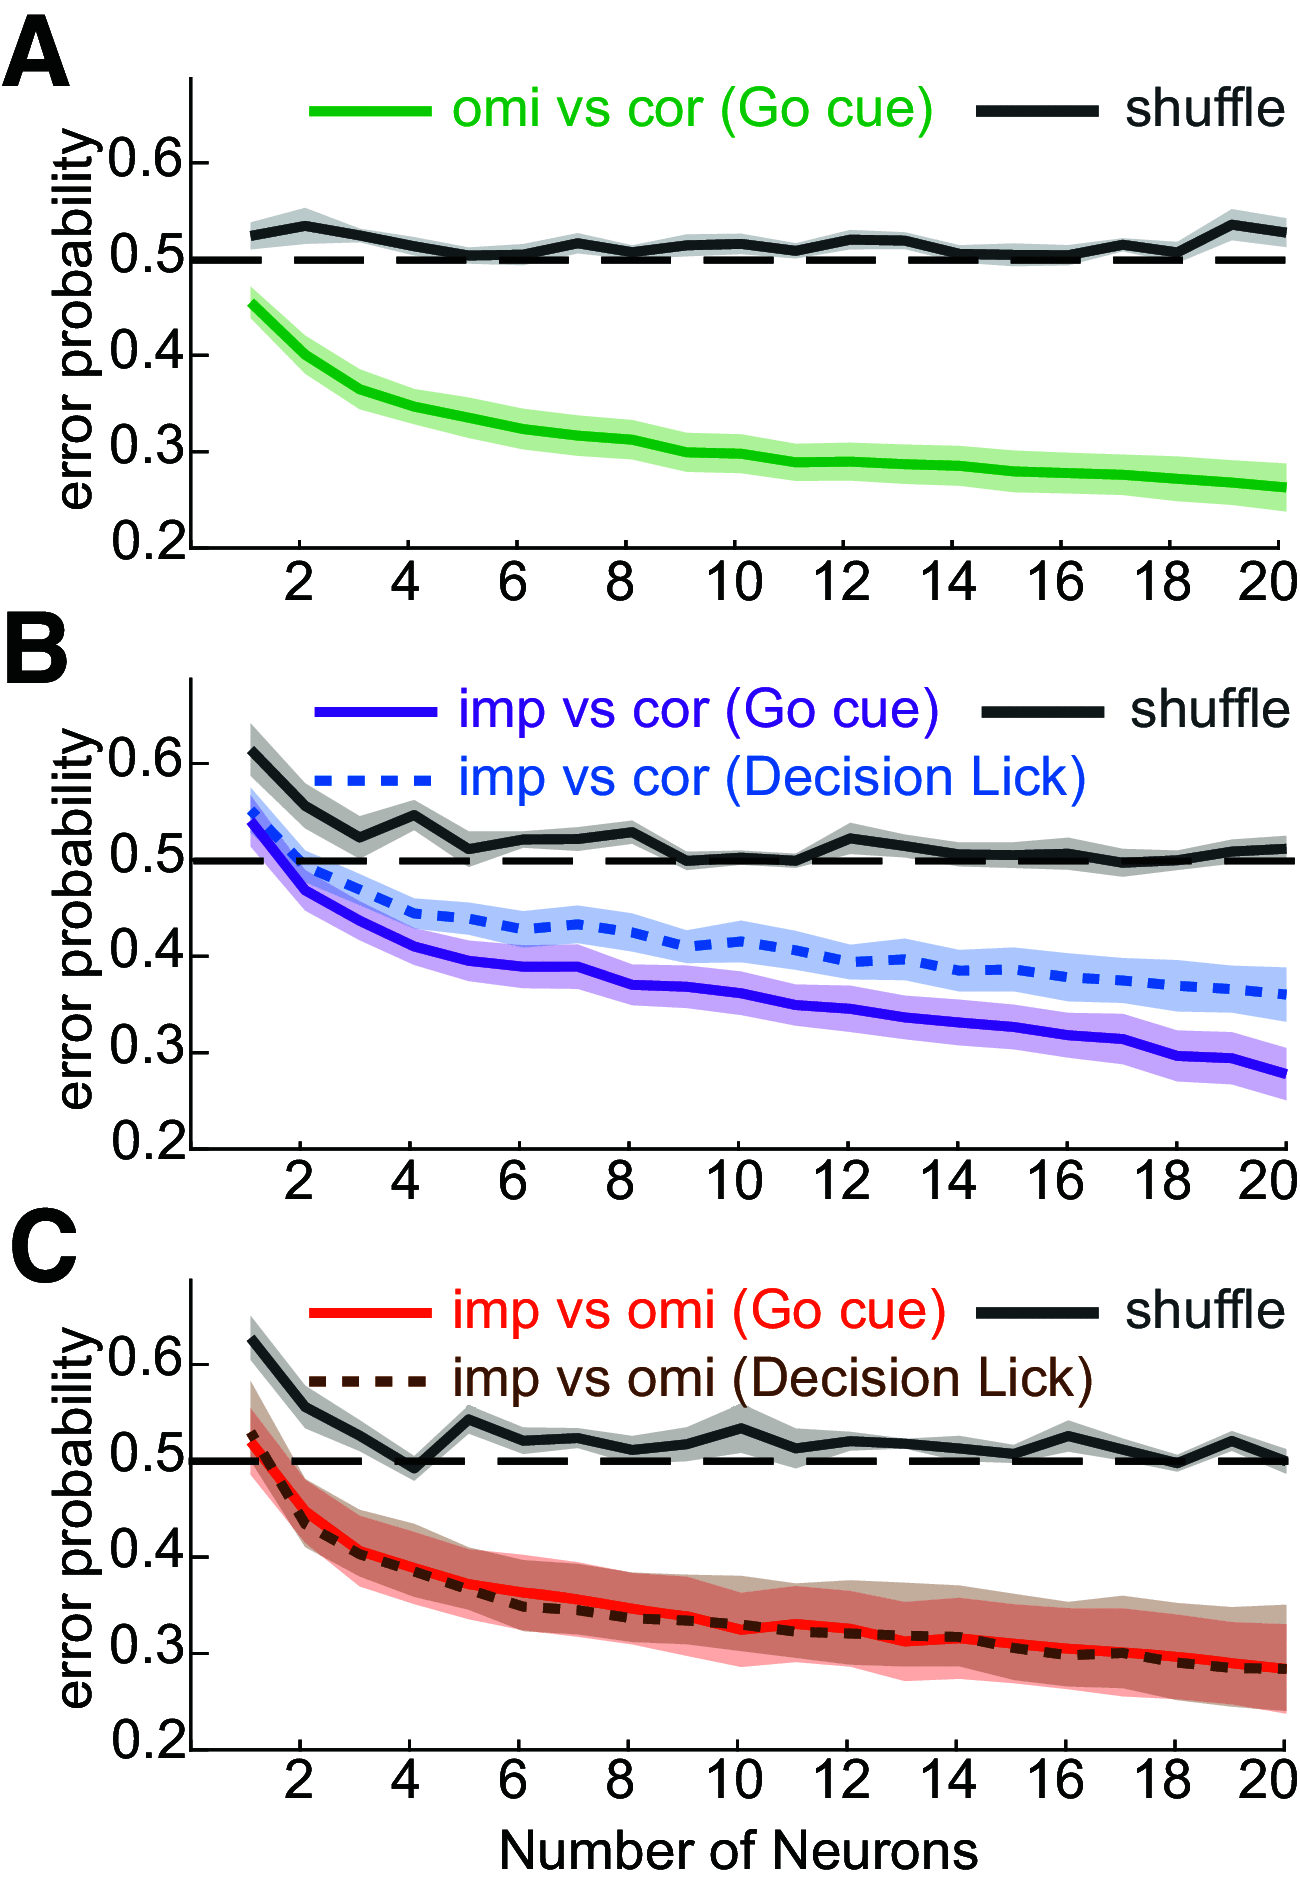
Thalamic population activity during the delay predicts the type of lick timing-related error trials. A, Average performance of logistic classifier on discriminating omission versus correct trials based on the firing rate of VM/VAL neuronal assemblies of different sizes during the 750 ms delay. One hundred iterations for each group size each with a 10-fold cross-validation. Neurons were randomly selected at each iteration. For a shuffle control, trial outcomes were randomly assigned to each trial spike train. The horizontal dashed lines at 50% indicate the chance level for a binary classification. B, Same as A but comparing impulsive and correct trials (solid trace). Because during impulsive trials the mouse licks during the delay, we trained a second classifier that only used the neuronal activity of the 750 ms before the first lick (dotted trace) to exclude the idea that lick-related activity during the delay for imp trials determines the classification. C, Same as B but comparing impulsive and omission trials.
Figure 7.
Figure 7.
Optogenetically stimulating the nigro-thalamic pathway reduced impulsivity and increased omissions. A, Schematic of the experimental paradigm. Slc32a transgenic mice were injected with AAV-DIO-ChR2-EYFP in the SNr to express ChR2. SNr terminals were optogenetically activated by blue light illumination through an optic fiber attached to the NeuroNexus silicon probe located in VM/VAL while the mice performed the task. B, Histology and microscopy confirmed the injection site in the SNr using Nissl staining (left column), immunohistochemistry with anti-GFP revealed with horseradish peroxidase (middle column), and confocal microscopy (right column). Confocal microscopy revealed green fluorescence confirming GFP expression in the somatic membrane of SNr neurons (bottom right). Scale bars: black, 2 mm; red, 20 µm. C, Behavioral effect of photostimulation. Bar plots representing the probability of occurrence for cor, eSi, imp, and omi trials with laser OFF (black) versus trials with laser ON (cyan; average and SD). D, Raster plots and trial-averaged spike rate functions of three example neurons (rpv 0.5%, 1%, 0.7% from top to bottom) recorded during control correct trials (black) and during optogenetic stimulation trials (cyan). Horizontal blue bars indicate the time of the laser stimulation in trials with optogenetic stimulation. E, Averaged z scored firing rate across correct trials with or without photostimulation (Opto stim). Only sessions with at least seven correct opto trials and at least three opto impulsive trials were used (89 neurons, five sessions, three mice). The neuronal activity was strongly suppressed by the laser stimulation during the delay epoch (blue) compared with when the laser was OFF (black). Shading represents 2 SEMs. F, Video analysis of averaged absolute deviation from baseline for tongue, whisker, and snout movements (DeepLabCut, four sessions, three mice; shading represents 2 SEMs). For each type of trial outcome (cor, imp, omi), the body movements were compared between trials with laser ON versus trials with laser OFF. Note that there was no difference in tracked movements between opto trials and non-opto trials during the delay epoch.
Figure 8.
Figure 8.
A threshold model for the timing of action release. During correct trials (left column), proper ramping in VM/VAL activity is initiated during the delay and peaks after the Go cue. When a threshold is reached (red), action release within a proper timing window (∼400 ms after the Go cue) will be triggered. If the ramping is optogenetically silenced (cyan), the threshold is not reached and the action is not released, resulting in omission trials. During impulsive trials (middle column), the thalamic activity ramps too early and reaches the threshold before the Go cue, leading to an early action release. If the ramping is optogenetically silenced (cyan), the threshold is not reached and the action could be either released post-Go cue, as in a correct trial, or not released at all, as in an omission trial. During omission trials (right column), the thalamic activity will not reach threshold and the action will not be released.

Similar articles

Cited by

References

    1. Alexander G, Crutcher M (1990) Functional architecture of basal ganglia circuits: neural substrates of parallel processing. Trends Neurosci 13:266–271. 10.1016/0166-2236(90)90107-L - DOI - PubMed
    1. Anderson ME, Horak FB (1985) Influence of the globus pallidus on arm movements in monkeys. III. Timing of movement-related information. J Neurophysiol 54:433–448. 10.1152/jn.1985.54.2.433 - DOI - PubMed
    1. Bodor AL, Giber K, Rovó Z, Ulbert I, Acsády L (2008) Structural correlates of efficient GABAergic transmission in the basal ganglia-thalamus pathway. J Neurosci 28:3090–3102. 10.1523/JNEUROSCI.5266-07.2008 - DOI - PMC - PubMed
    1. Bogacz R, Larsen T (2011) Integration of reinforcement learning and optimal decision-making theories of the basal ganglia. Neural Comput 23:817–851. 10.1162/NECO_a_00103 - DOI - PubMed
    1. Bollu TP, Whitehead S, Kardon B, Redd J, Liu MH, Goldberg J (2019) Tongue kinematics. Cortex-dependent corrections as the mouse tongue reaches for, and misses, targets. bioRxiv. doi: 10.1101/655852. - DOI - PMC - PubMed

Publication types

LinkOut - more resources