. 2021 Mar 3;41(9):1941-1951.
doi: 10.1523/JNEUROSCI.0753-20.2020. Epub 2021 Jan 14.

Orbitofrontal State Representations Are Related to Choice Adaptations and Reward Predictions

Affiliations

Orbitofrontal State Representations Are Related to Choice Adaptations and Reward Predictions

Thomas A Stalnaker et al. J Neurosci. .

Abstract

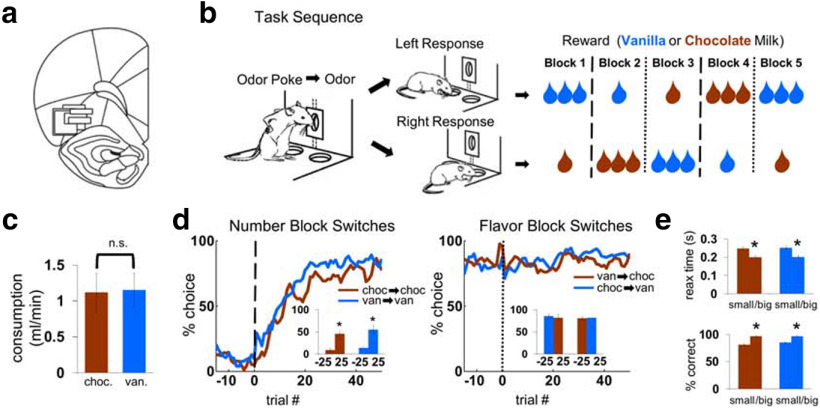
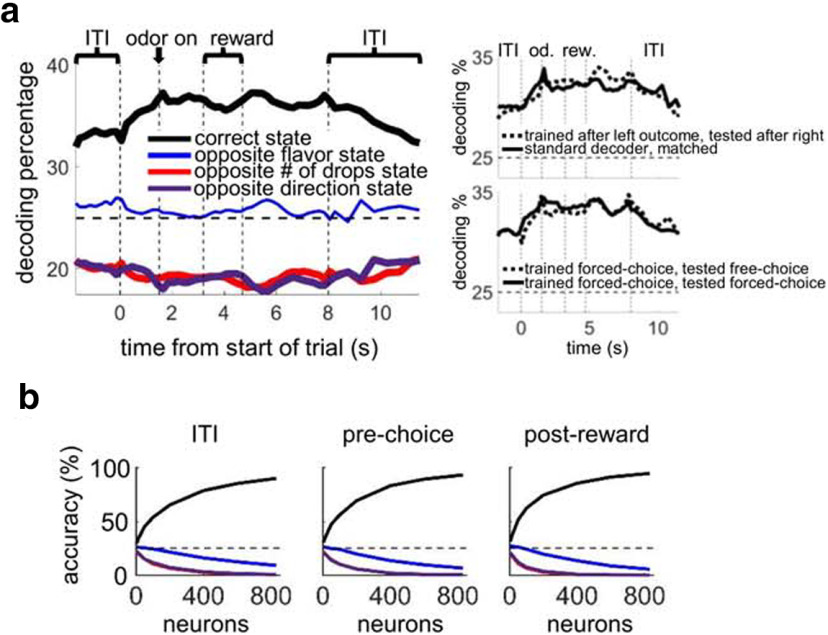
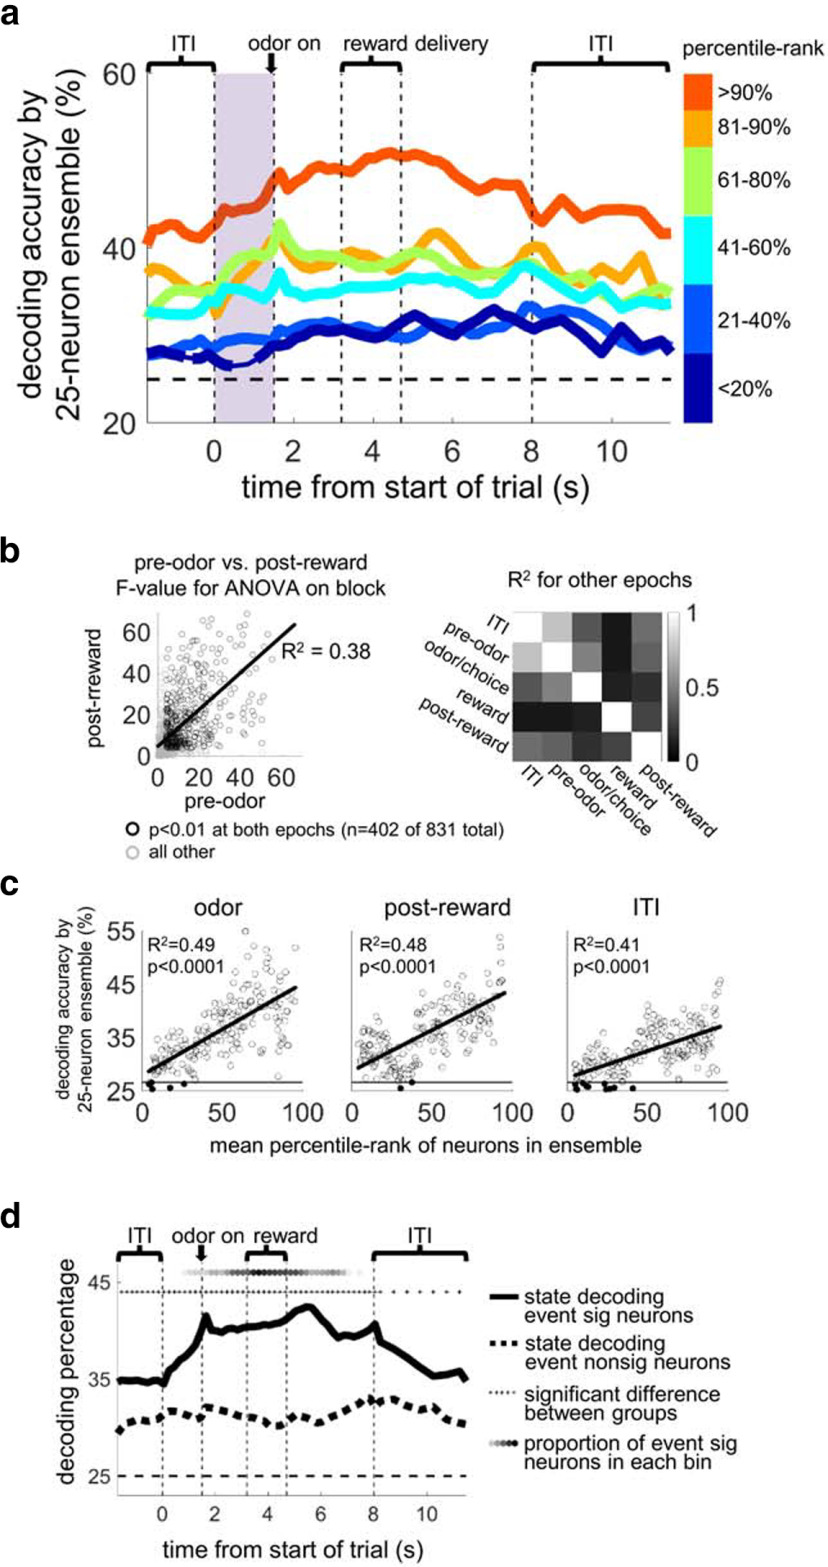
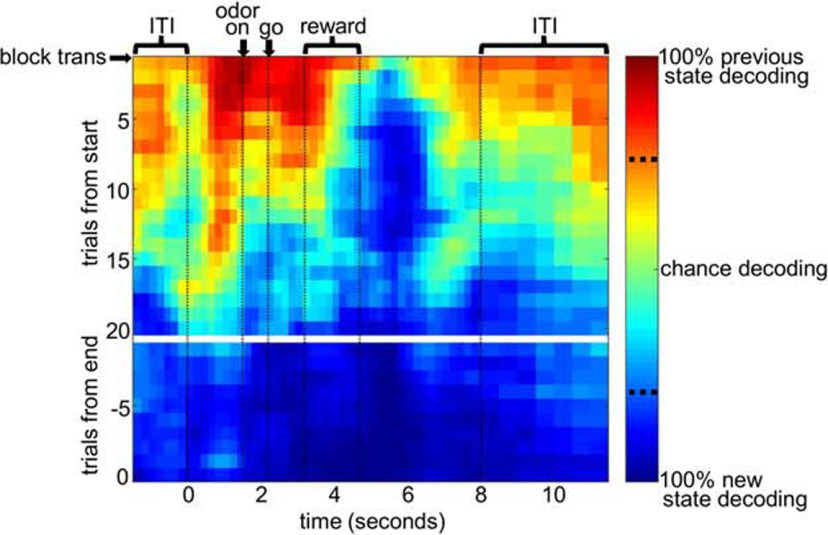
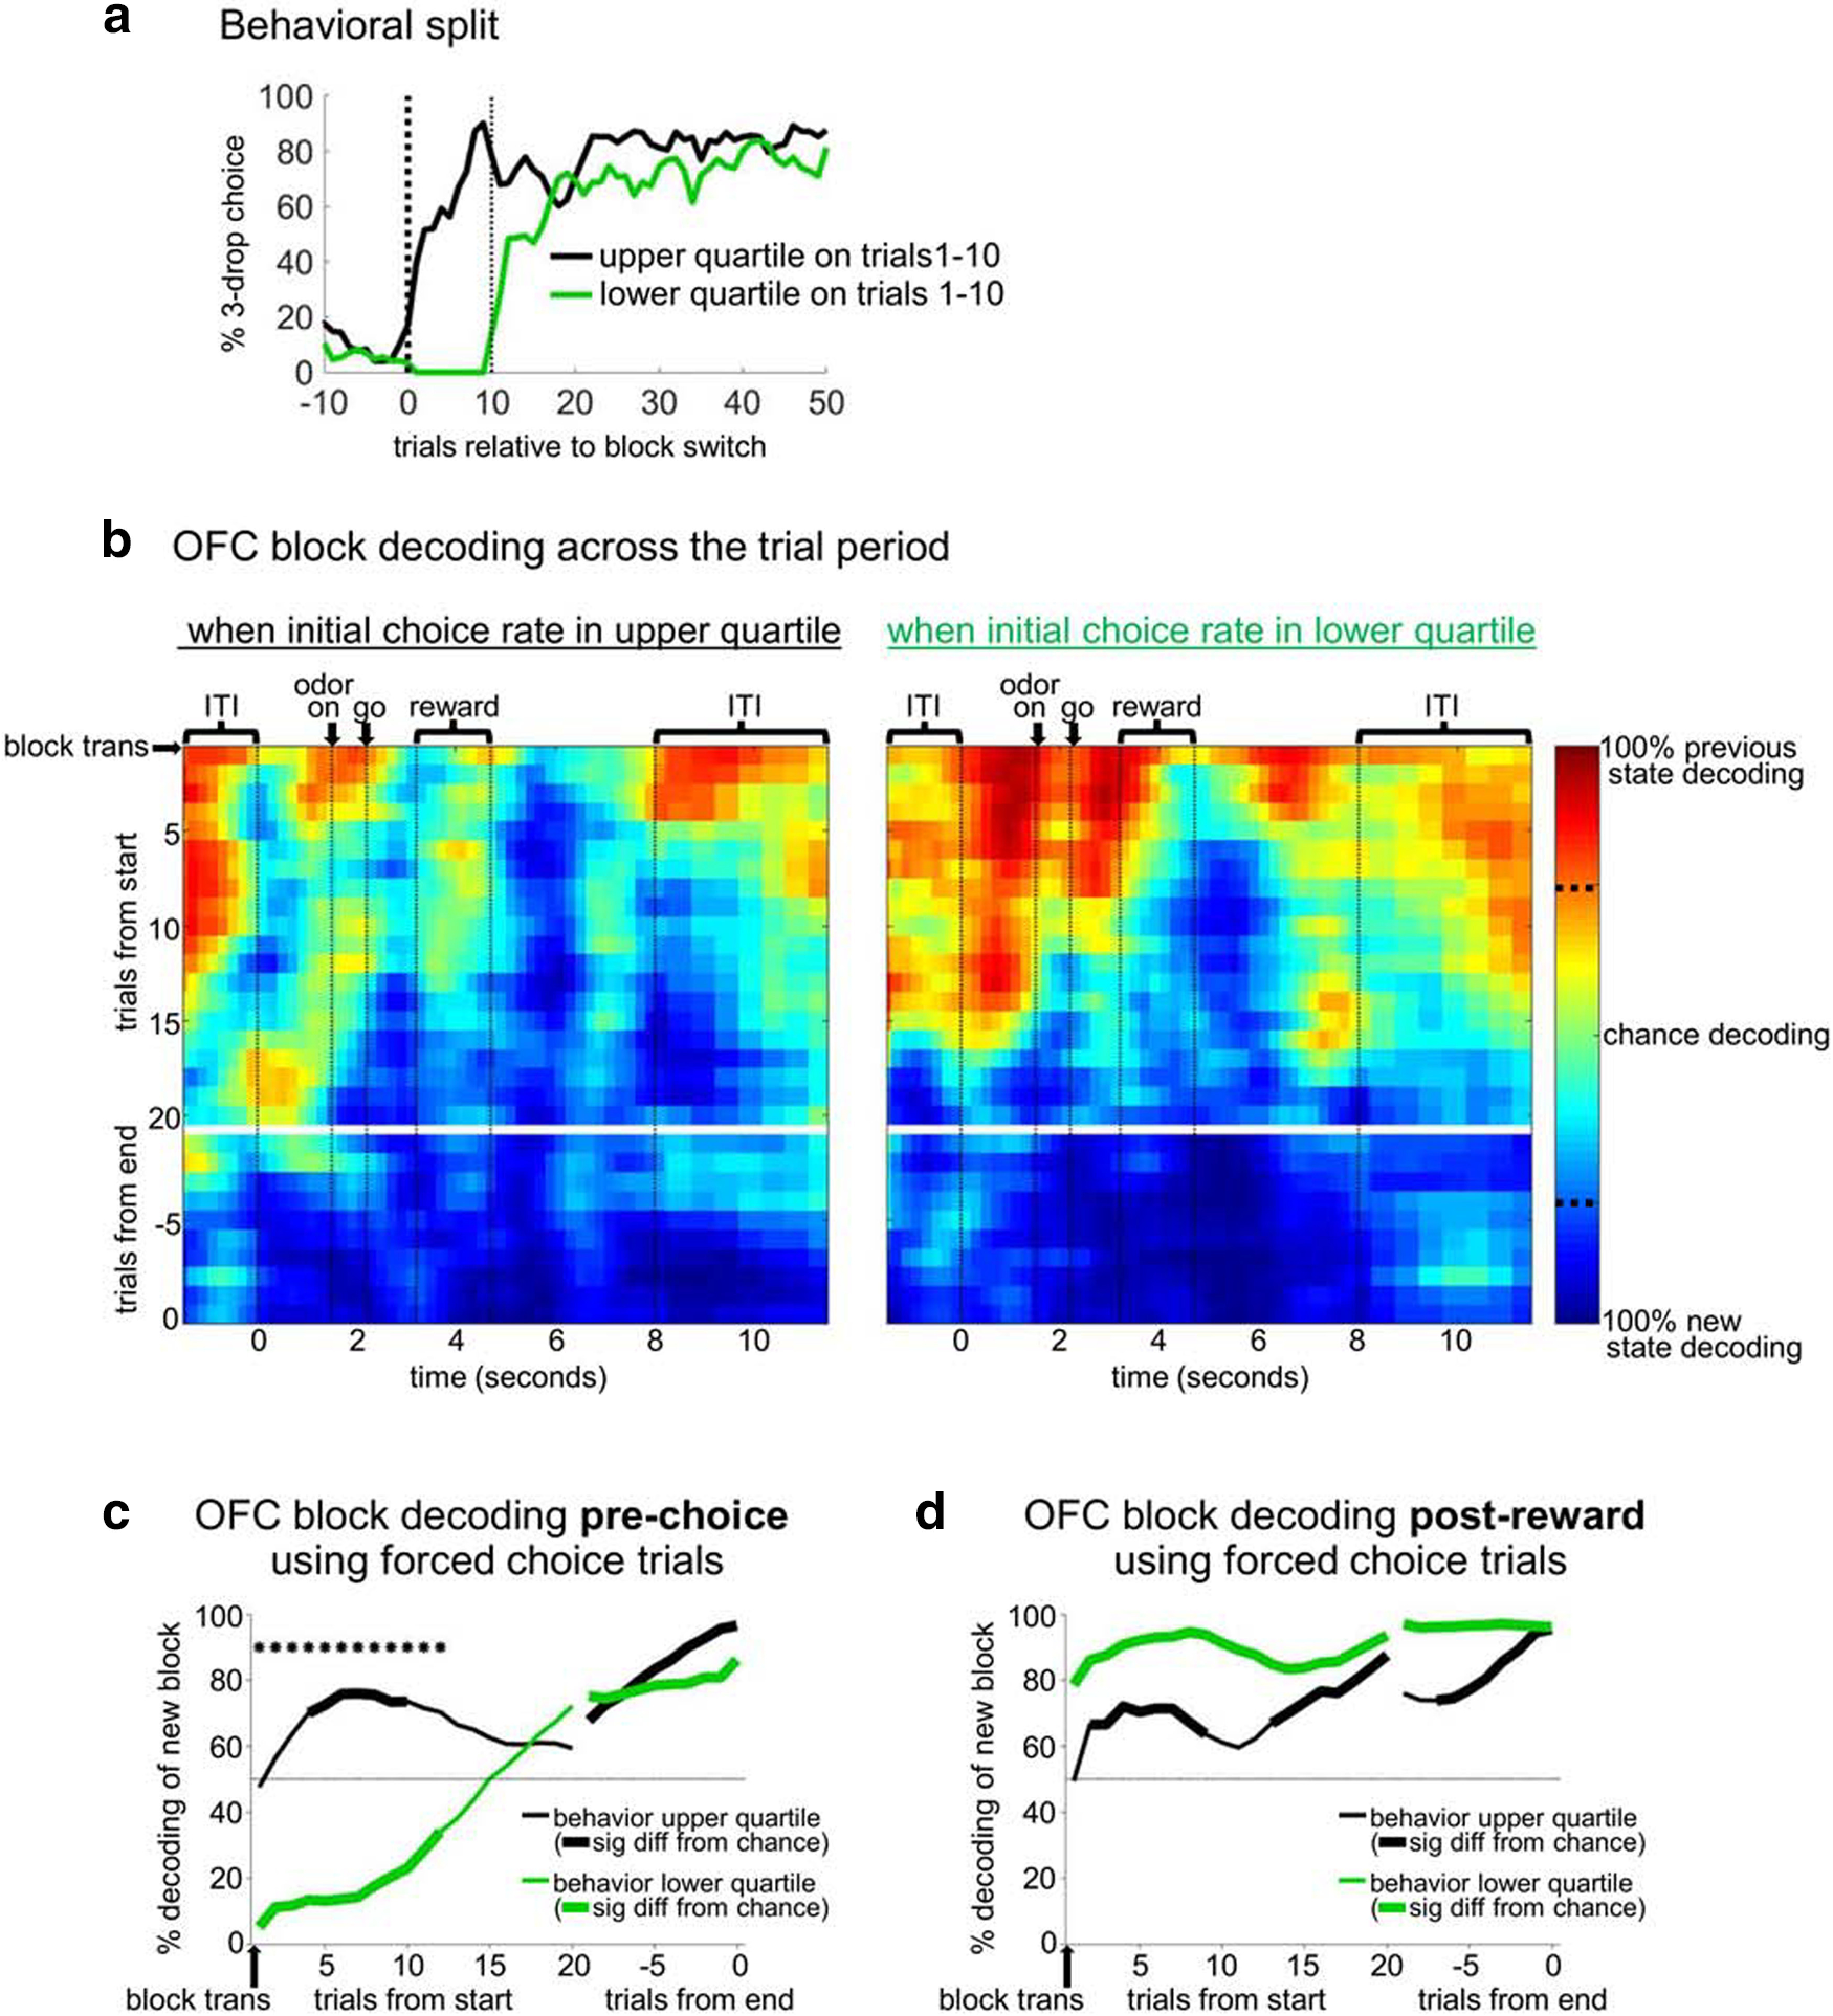
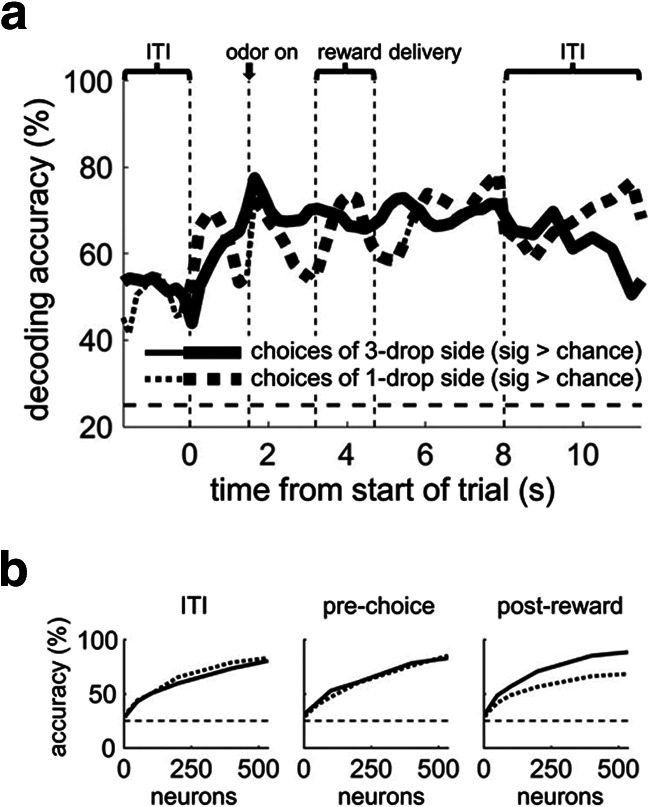
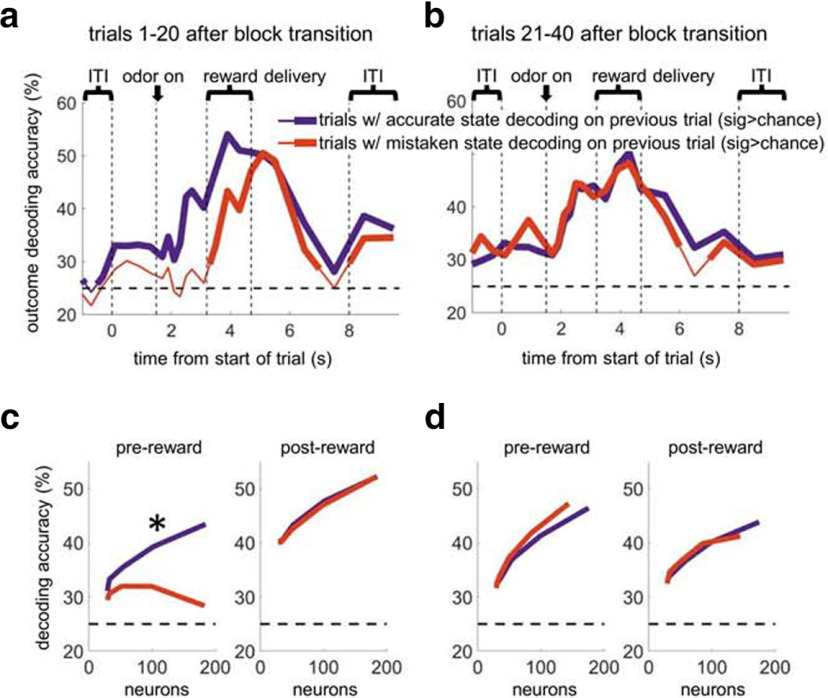
Animals can categorize the environment into "states," defined by unique sets of available action-outcome contingencies in different contexts. Doing so helps them choose appropriate actions and make accurate outcome predictions when in each given state. State maps have been hypothesized to be held in the orbitofrontal cortex (OFC), an area implicated in decision-making and encoding information about outcome predictions. Here we recorded neural activity in OFC in 6 male rats to test state representations. Rats were trained on an odor-guided choice task consisting of five trial blocks containing distinct sets of action-outcome contingencies, constituting states, with unsignaled transitions between them. OFC neural ensembles were analyzed using decoding algorithms. Results indicate that the vast majority of OFC neurons contributed to representations of the current state at any point in time, independent of odor cues and reward delivery, even at the level of individual neurons. Across state transitions, these representations gradually integrated evidence for the new state; the rate at which this integration happened in the prechoice part of the trial was related to how quickly the rats' choices adapted to the new state. Finally, OFC representations of outcome predictions, often thought to be the primary function of OFC, were dependent on the accuracy of OFC state representations.SIGNIFICANCE STATEMENT A prominent hypothesis proposes that orbitofrontal cortex (OFC) tracks current location in a "cognitive map" of state space. Here we tested this idea in detail by analyzing neural activity recorded in OFC of rats performing a task consisting of a series of states, each defined by a set of available action-outcome contingencies. Results show that most OFC neurons contribute to state representations and that these representations are related to the rats' decision-making and OFC reward predictions. These findings suggest new interpretations of emotional dysregulation in pathologies, such as addiction, which have long been known to be related to OFC dysfunction.

Keywords: cognitive map; odor; orbitofrontal; rat; single unit.


Figures

Figure 1.
Figure 1.
Recordings in OFC, odor-guided choice task, and behavioral results. a, Recording sites in lateral OFC. Black boxes represent the approximate location from which recordings were made in each rat (in the left hemisphere). The width represents the estimated span of the electrode bundle (∼1 mm), and the height represents the approximate extent of recording across all sessions. Bregma 2.8-3.6 mm. b, Trial events and reward schedule. Trials started with odor delivery followed by choice for 1 or 3 drops of chocolate or vanilla milk. Two odors indicated forced choices, left or right; a third odor indicated free choice. Reward contingencies were stable across blocks of ∼60 trials but switched in number of drops (dashed lines) or flavor (dotted lines) in four unsignaled transitions. The last four blocks always had the same four sets of action-outcome contingencies, but the order differed from day to day. c, Results of a 10 min consumption test run in a separate group of rats (t(10) = 0.1, p = 0.93). d, Average trial-by-trial choice rates across number block switches (left), separately for 1 drop chocolate→3 drops chocolate compared with 1 drop vanilla→3 drops vanilla, and flavor block switches (right). Inset, Bar graphs compare choice rate in 25 trials before block switches versus 25 trials after block switches. ANOVA on difference in choice rates across transitions, with factors transition type and initial flavor; main effect of transition type (F(1,92) = 195.7, p < 0.001), driven by significant changes across number transitions (planned contrast, F(1,92) = 445.9, p < 0.0001), and insignificant changes across flavor transitions (planned contrast, F(1,92) = 1.3, p = 0.27); no effect of initial flavor (F(1,92) = 0.0, p = 0.93); no differences between vanilla-to-chocolate and chocolate-to-vanilla (planned contrast, F(1,92) = 2.3, p = 0.13). e, Average response latencies and accuracy on forced-choice trials. Within-subjects ANOVAs on reaction time and accuracy: main effects of reward number (F(1,93) = 62.2, p < 0.001; F(1,93) = 182.3, p < 0.001) but not flavor (F(1,93) = 0.3, p = 0.57; F(1,93) = 5.3, p = 0.024), nor interactions (F(1,93) = 0.1, p = 0.73; F(1,93) = 5.1, p = 0.027). *p < 0.001 vs. 1 drop condition.
Figure 2.
Figure 2.
OFC pseudo-ensembles decode the current state accurately across all parts of trials. a, Left, Black line indicates the percentage of trials classified to the correct state, using a 25 neuron pseudo-ensemble and a sliding 500 ms epoch aligned to different trial events and concatenated (the end of the ITI indicates the time the house light was turned on). Other lines indicate misclassification to the other possible states: blue represents the state with opposite flavor but the same number of drops (at both wells) as the correct state; red represents the state with the opposite number of drops but same flavor (at both wells) as the correct state; purple represents the state with the same two outcomes as the correct state, but at the opposite wells. Thick lines indicate significant difference from chance using a bootstrap distribution with shuffled labels (p < 0.01 for at least 5 consecutive bins). All rewarded trials were included in the decoder. Smaller panels on right of a represent two control analyses: Top, Training on trials immediately after outcome at left well, testing on trials immediately after outcome at right well. This shows that state representations do not reflect memory traces of the outcome delivered on the previous trial. Bottom, Training on forced-choice and testing on free-choice trials, showing that state representations generalize across trial type. Significant differences in control analyses were assessed at p < 0.01 by comparing decoding percentages as a function of ensembles sizes as described in Materials and Methods (nonsignificant for both). b, State-decoding accuracy as a function of ensemble size using three 1000 ms epochs, with misclassification shown as in a. Across all epochs, decoding accuracy approached 100%, with states differing only in the flavor of outcomes being the most likely to be misclassified. Dotted lines in all plots indicate chance level of accuracy (25%).
Figure 3.
Figure 3.
Individual OFC units maintain information about state across the trial, and state information is widely distributed across the OFC population. a, The average accuracy of block decoding of 25 neuron OFC ensembles taken from ranked subpopulations. Neurons were ranked by the F values from an ANOVA using factor “state” run on each neuron's firing rate during the preodor period (shaded in purple). Ensembles from across the entire OFC population decoded state above chance across the whole trial, although they were ranked using firing rate only in the preodor epoch. Thick lines indicate significance versus chance at p < 0.01 by bootstrap for at least five consecutive bins. This suggests that individual units tended to maintain state information across the whole trial and that the majority of OFC neurons contributed to the state information observed in ensembles. b, Scatter plot represents the correlation between the F values for block ANOVAs run on the prechoice epoch versus the postreward epoch across all OFC neurons. b, Right, R2 values for other pairs of epochs. c, The linear correlation between mean percentile rank of the neurons in 200 25 neuron ensembles randomly selected from a segment of 10% of all the neurons sliding across the population from the top-ranked to the bottom-ranked neurons, versus their state-decoding accuracy for three 500 ms epochs across the trial. Horizontal line indicates the significance level for decoding accuracy at p < 0.001. Filled circles represent ensembles below the significance line, of which there were 9 of 200 for the odor epoch, 3 of 200 for the postreward epoch, and 14 of 200 for the ITI epoch. d, Lines indicate state-decoding by 25 neuron ensembles selected from event-significant neurons (defined by ANOVA for factors odor, direction, or outcome in any bin) versus event-nonsignificant neurons. Both groups decoded state better than chance and were significantly different from each other across all bins. Top, Shaded circles represent proportion of neurons significant for event ANOVAs in each bin, ranging from 0% (white) to 10% (black) of all possible significance tests across all neurons.
Figure 4.
Figure 4.
After a state transition, new state representations first emerge in OFC ensembles in the postreward epoch, after which it propagates to the other parts of the trial. Shown are results from a binary block decoder that tests how well OFC ensembles matched the old block pattern versus the new block pattern using sliding sets of 5 trials after a number block transition (see Materials and Methods). Spike trains were aligned to various events in the trial (shown with vertical dotted lines) and then concatenated and binned. Decoding percentages at each bin and set of trials were smoothed and converted into the color scale as shown for the heat plot. Red represents previous state-decoding. Blue represents new state-decoding. Vertical dotted lines on the color scale bar indicate significance levels for previous state or new state-decoding, based on a permutation test (p < 0.05, two-tailed).
Figure 5.
Figure 5.
Faster behavioral adaptation to a state transition is associated with better OFC state-decoding during the prechoice part of the trial. a, Number block transitions were split into the top and bottom quartiles of all transitions based on the free-choice rate in the first 10 trials after the transition. In bottom quartile switches, rats perseverated, choosing what was previously the 3-drop side, even though it had switched to deliver a single drop. Conversely, in upper quartile switches, rats immediately began switching to choose the new 3-drop side. We then ran the binary state decoder using only OFC neurons recorded across either the top or bottom quartile switches (b-d). b, The resulting heat plots show that, in the prechoice part of the trial, neurons recorded during upper quartile switches adapted quickly to the new state code, whereas those recorded in lower quartile switches strongly encoded the old state for 10-15 trials after the transition. Line figures illustrated this effect for a prechoice epoch (c) or a postreward epoch (d). These latter analyses only included correct forced-choice trials, meaning that rewards received were not different in the two conditions. Thick lines indicate significance relative to chance. c, *Significant differences between the conditions, both by permutation tests (p < 0.05 for five consecutive bins).
Figure 6.
Figure 6.
The accuracy of state-decoding is not related to whether rats accurately chose the side with the preferred outcome. a, State-decoding accuracy across the trial divided into appropriate choices (free-choices of the 3-drop reward; solid line) or inappropriate choices (free-choices of the 1-drop reward; dotted line), excluding the first 10 trials after changes in drop number. All neurons on which enough inappropriate choices were made were included (n = 535). b, Line plots represent decoding accuracy as a function of ensemble size in both conditions during the ITI, prechoice, and postreward epochs.
Figure 7.
Figure 7.
After transitions, OFC ensembles can only predict the outcome to be delivered when a matched OFC ensemble had decoded the state accurately after reward delivery on the previous trial. a, Outcome-decoding accuracy of OFC ensembles when a matched ensemble recorded in the same sessions accurately (blue) or inaccurately (red) decoded the state on the previous trial, using the first 20 trials after block transitions. b, A parallel analysis using trials 21-40 after block transitions. The state-decoding epoch was always a 1500 ms epoch beginning 1500 ms after the initial reward delivery time stamp on the previous trial. c, d, Same analysis as a function of outcome-decoding ensemble size. All rewarded trials were included, except those in which the previous trial was itself not rewarded. *p < 0.01 comparing the estimated parameter values for the best fit of the two functions.

Similar articles

Cited by

References

    1. Behrens TE, Muller TH, Whittington JC, Mark S, Baram AB, Stachenfeld KL, Kurth-Nelson Z (2018) What is a cognitive map? Organizing knowledge for flexible behavior. Neuron 100:490–509. 10.1016/j.neuron.2018.10.002 - DOI - PubMed
    1. Bernardi S, Salzman CD (2019) The contribution of nonhuman primate research to the understanding of emotion and cognition and its clinical relevance. Proc Natl Acad Sci USA 116:26305–26312. - PMC - PubMed
    1. Bradfield LA, Balleine BW (2017) Thalamic control of dorsomedial striatum regulates internal state to guide goal-directed action selection. J Neurosci 37:3721–3733. 10.1523/JNEUROSCI.3860-16.2017 - DOI - PMC - PubMed
    1. Bradfield LA, Hart G (2020) Rodent medial and lateral orbitofrontal cortices represent unique components of cognitive maps of task space. Neurosci Biobehav Rev 108:287–294. 10.1016/j.neubiorev.2019.11.009 - DOI - PubMed
    1. Bradfield LA, Dezfouli A, van Holstein M, Chieng B, Balleine BW (2015) Medial orbitofrontal cortex mediates outcome retrieval in partially observable task situations. Neuron 88:1268–1280. 10.1016/j.neuron.2015.10.044 - DOI - PubMed

Publication types

LinkOut - more resources