. 2021 Feb 1;35(3-4):250-260.
doi: 10.1101/gad.339903.120. Epub 2021 Jan 14.

An interplay of NOX1-derived ROS and oxygen determines the spermatogonial stem cell self-renewal efficiency under hypoxia

Affiliations

An interplay of NOX1-derived ROS and oxygen determines the spermatogonial stem cell self-renewal efficiency under hypoxia

Hiroko Morimoto et al. Genes Dev. .

Abstract

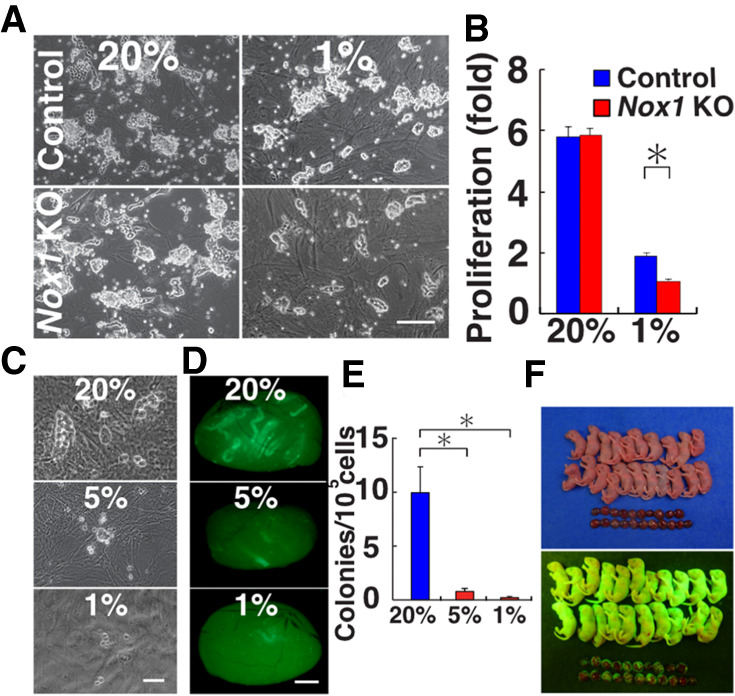
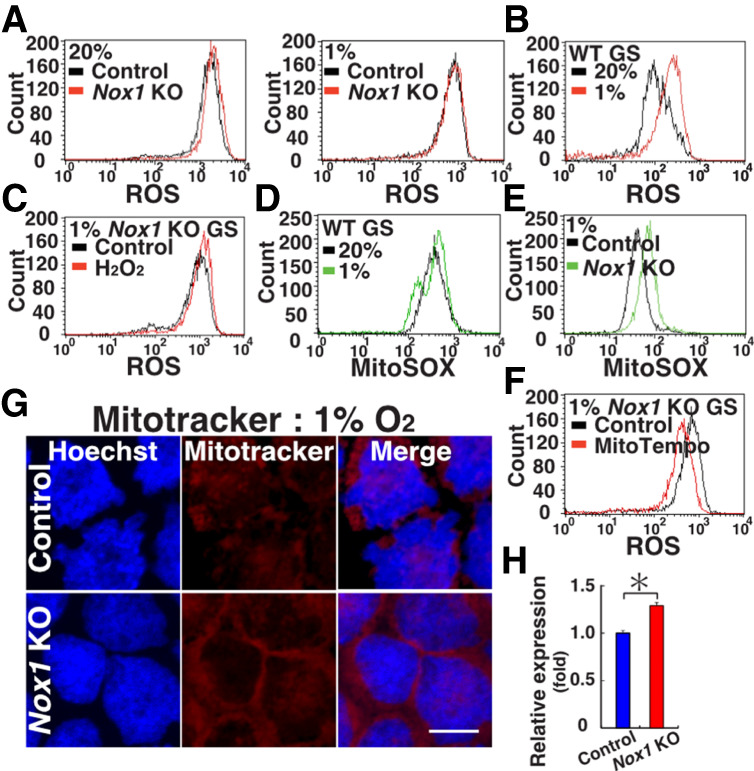
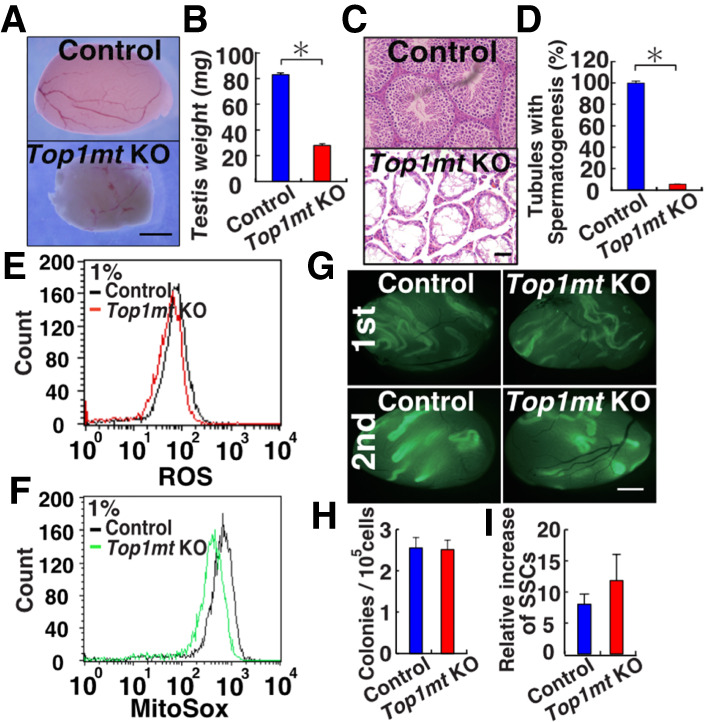
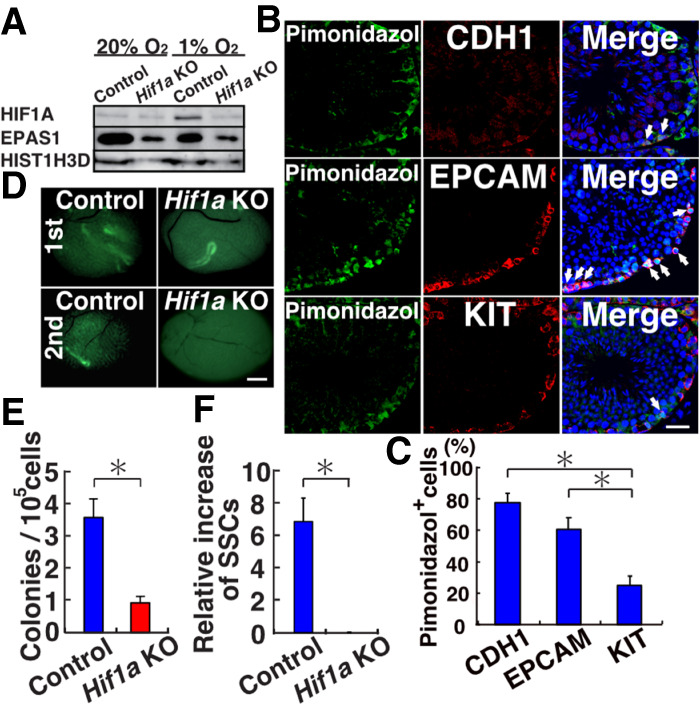
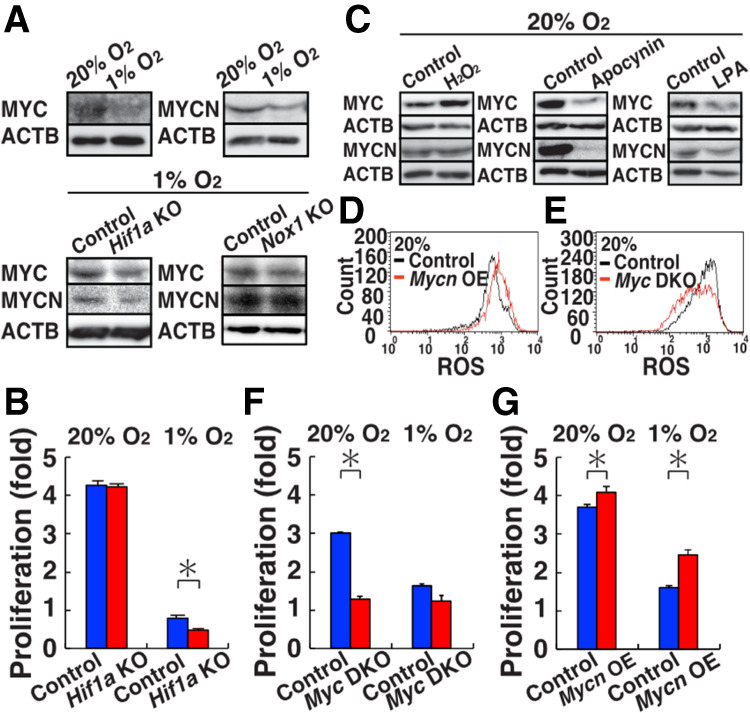
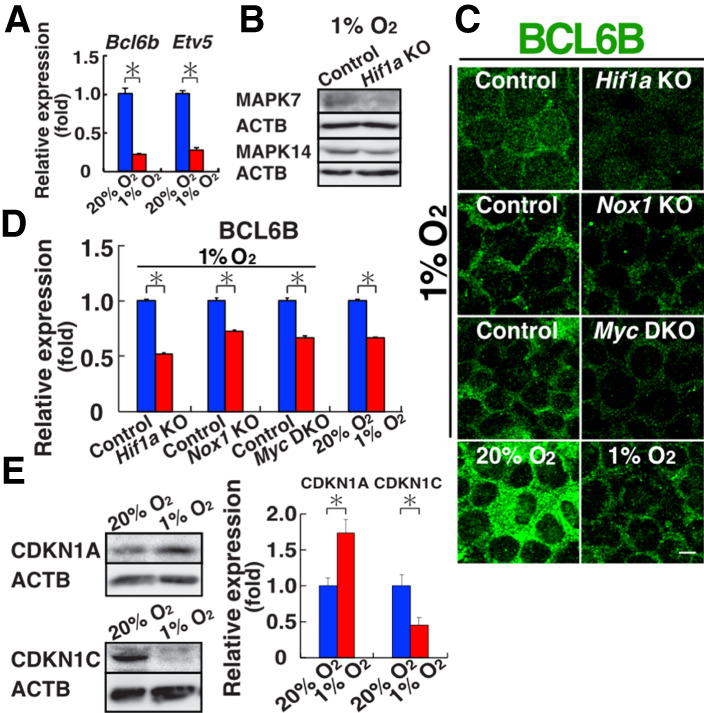
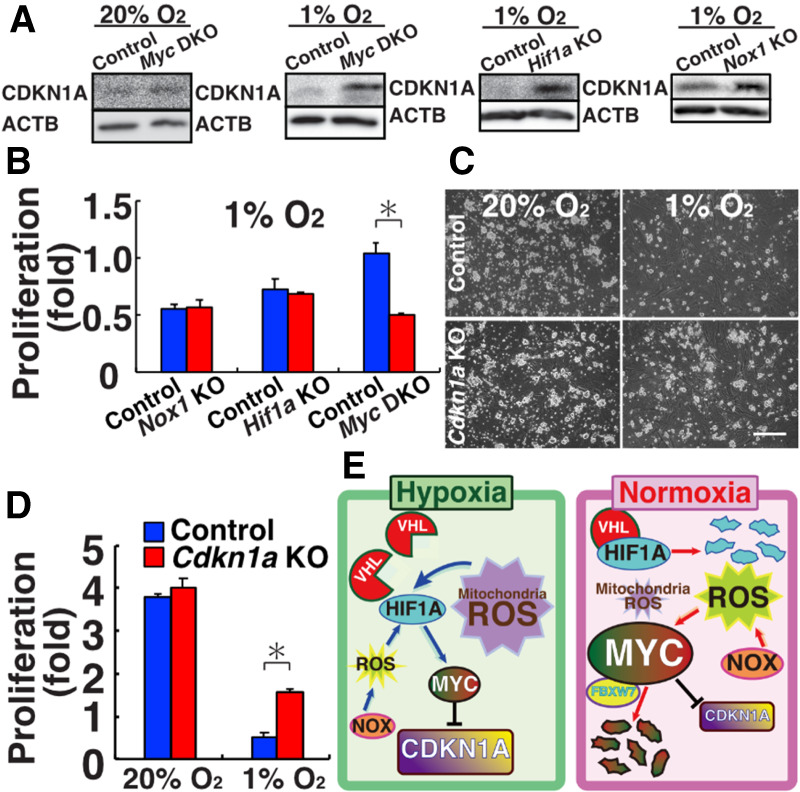
Reactive oxygen species (ROS) produced by NADPH1 oxidase 1 (NOX1) are thought to drive spermatogonial stem cell (SSC) self-renewal through feed-forward production of ROS by the ROS-BCL6B-NOX1 pathway. Here we report the critical role of oxygen on ROS-induced self-renewal. Cultured SSCs proliferated poorly and lacked BCL6B expression under hypoxia despite increase in mitochondria-derived ROS. Due to lack of ROS amplification under hypoxia, NOX1-derived ROS were significantly reduced, and Nox1-deficient SSCs proliferated poorly under hypoxia but normally under normoxia. NOX1-derived ROS also influenced hypoxic response in vivo because Nox1-deficient undifferentiated spermatogonia showed significantly reduced expression of HIF1A, a master transcription factor for hypoxic response. Hypoxia-induced poor proliferation occurred despite activation of MYC and suppression of CDKN1A by HIF1A, whose deficiency exacerbated self-renewal efficiency. Impaired proliferation of Nox1- or Hif1a-deficient SSCs under hypoxia was rescued by Cdkn1a depletion. Consistent with these observations, Cdkn1a-deficient SSCs proliferated actively only under hypoxia but not under normoxia. On the other hand, chemical suppression of mitochondria-derived ROS or Top1mt mitochondria-specific topoisomerase deficiency did not influence SSC fate, suggesting that NOX1-derived ROS play a more important role in SSCs than mitochondria-derived ROS. These results underscore the importance of ROS origin and oxygen tension on SSC self-renewal.

Keywords: Hif1; reactive oxygen species; spermatogonia.


Figures

Figure 1.
Figure 1.
Proliferation of Nox1 KO GS cells. (A) Appearance of Nox1 KO GS cells. (B) Proliferation of Nox1 KO GS cells (n = 3). Cells were cultured under 1% or 20% O2 for 8 d. Relative increase of cell recovery after culture initiation is shown. (C) Culture of green pup testis cells under 1%, 5%, and 20% O2 for 7 d on MEFs. (D) Appearance of recipient testes after transplantation of pup testis cells under hypoxia. (E) Colony counts (n = 12). (F) Offspring born after microinsemination using sperm derived from GS cells cultured under hypoxia. Scale bars: A,C, 200 µm; D, 1 mm. Asterisk indicates statistical significance (P < 0.05).
Figure 2.
Figure 2.
Oxygen-dependent changes in ROS levels. (A) Flow cytometric analysis of ROS levels in Nox1 KO GS cells under hypoxic and normoxic conditions by CellROX Deep Red. (B) Flow cytometric analysis of ROS levels in WT GS cells under hypoxic and normoxic conditions by CellROX Deep Red. (C) Flow cytometric analysis of ROS levels in Nox1 KO GS cells by CellROX Deep Red 2 d after H2O2 supplementation under hypoxia. (D,E) Flow cytometric analysis of mitochondria-derived ROS levels in WT (D) or Nox1 KO (E) GS cells using MitoSox. (F) Flow cytometric analysis of ROS levels in Nox1 KO GS cells by CellROX Deep Red 2 d after H2O2 treatment. (G,H) Mitotracker staining (G) and quantification (H) of its staining intensity in GS cells (n = 10). Scale bar in G, 20 µm. Stain in G is Hoechst 33342. Asterisk indicates statistical significance (P < 0.05).
Figure 3.
Figure 3.
Functional analysis of SSCs in Top1mt KO mice. (A) Appearance of Top1mt KO mouse testis. (B) Testis weight (n = 6). (C) Histological appearance of Top1mt KO mouse testis. (D) Number of seminiferous tubules with spermatogenesis. At least 504 tubules were counted. (E,F) Flow cytometric analysis of ROS levels in Top1mt KO GS cells by CellROX Deep Red (E) and MitoSox (F). (G) Appearance of recipient testes. (H) Colony counts in primary recipients (n = 10). (I) Total increase in colony number (total regenerated colony number × 10)/(primary colony number used for serial transplantation) (n = 6). Scale bars: A,G, 1 mm; C, 50 µm. Stain in C is hematoxylin and eosin. Asterisk indicates statistical significance (P < 0.05).
Figure 4.
Figure 4.
Functional analysis of Hif1a in SSCs. (A) Western blot analysis of HIF1A and EPAS1 in WT GS cells. (B,C) Immunostaining (B) and quantification (C) of WT testis with pimonidazole and spermatogonia markers. At least 10 tubules were counted. (D) Appearance of recipient testes. (E) Colony counts in primary recipients (n = 16). (F) Total increase in colony numbers (total regenerated colony number × 10)/(primary colony number used for serial transplantation) (n = 7 for Hif1a KO; n = 11 for control). Scale bars: B, 20 µm; D, 1 mm. Stain in B is Hoechst 33342. Asterisk indicates statistical significance (P < 0.05).
Figure 5.
Figure 5.
Induction of MYC/MYCN by ROS. (A) Western blot analysis of MYC/MYCN in WT (20% and 1% O2), Hif1a KO (1% O2), and Nox1 KO (1% O2) GS cells (n = 3). (B) Proliferation of Hif1a KO GS cells (n = 3). Cell recovery was determined after culturing under hypoxia for 3 d. (C) Western blot analysis of MYC/MYCN in WT GS cells after exposure to H2O2, apocynin or LPA (n = 3). (D) Flow cytometric analysis of ROS levels by CellROX Deep Red after Mycn overexpression in WT GS cells 11 d after transfection (n = 3). (E) Flow cytometric analysis of ROS levels in Myc DKO GS cells by CellROX Deep Red. (F) Proliferation of Myc DKO GS cells (n = 3). Cells were recovered after 4 d. (G) Proliferation of Myc DKO GS cells transfected with Mycn (n = 3). Cells were recovered 8 d after transfection. Asterisk indicates statistical significance (P < 0.05).
Figure 6.
Figure 6.
Lack of ROS amplification and increased CDKN1A expression under hypoxia. (A) Real-time PCR analysis of Etv5 and Bcl6b expression (n = 3). (B) Western blot analysis of MAPK7 and MAPK14 in WT GS cells (n = 3). (C,D) Immunostaining (C) and quantification (D) of BCL6B in WT, Hif1a, Nox1, and Myc DKO KO GS cells. Relative staining intensity in the nucleus was quantified (n = 10). (E) Western blot analysis of CDKN1A and CDKN1C in WT GS cells (n = 3). Scale bar in C, 10 µm. Stain in C is Hoechst 33342. Asterisk indicates statistical significance (P < 0.05).
Figure 7.
Figure 7.
Improvement of GS cell proliferation by Cdkn1a deficiency under hypoxia. (A) Western blot analysis of CDKN1A in Myc DKO, Hif1a KO, and Nox1 KO GS cells (n = 3). (B) Rescue of proliferative defect of KO GS cells after Cdkn1a KD. Cells were counted 6 d (Nox1 KO and Myc DKO) or 8 d (Hif1a KO) after transfection. (C) Appearance of Cdkn1a KO GS cells. (D) Proliferation of Cdkn1a KO GS cells (n = 6). Cells were cultured for 6 d. (E) Summary of experiments. Under hypoxic conditions, NOX1-derived ROS and mitochondria-derived ROS enhance expression of HIF1A, which induces MYC to inhibit CDKN1A expression, thereby promoting self-renewal. Under normoxia, however, VHL degrades HIF1A, and the contribution of mitochondria-derived ROS is decreased under normoxia. Because ROS induce MYC expression (Fig. 5C), GS cells can proliferate actively. How ROS stabilize MYC is still unknown, but FBXW7 may be involved. Scale bar in C, 200 µm. Asterisk indicates statistical significance (P < 0.05).

Similar articles

Cited by

References

    1. Bigarella CL, Liang R, Ghaffari S. 2014. Stem cells and the impact of ROS signaling. Development 141: 4206–4218. 10.1242/dev.107086 - DOI - PMC - PubMed
    1. Brinster RL, Zimmermann JW. 1994. Spermatogenesis following male germ-cell transplantation. Proc Natl Acad Sci 91: 11298–11302. 10.1073/pnas.91.24.11298 - DOI - PMC - PubMed
    1. Depping R, Hägele S, Wagner KF, Wiesner RJ, Camenisch G, Wnger RH, Katschinski DM. 2004. A dominant-negative isoform of hypoxia-inducible factor-1α specifically expressed in human testis. Biol Reprod 71: 331–339. 10.1095/biolreprod.104.027797 - DOI - PubMed
    1. de Rooij DG. 2017. The nature and dynamics of spermatogonial stem cells. Development 144: 3022–3030. 10.1242/dev.146571 - DOI - PubMed
    1. Dikalov S. 2011. Cross talk between mitochondria and NADPH oxidases. Free Radic Biol Med 51: 1289–1301. 10.1016/j.freeradbiomed.2011.06.033 - DOI - PMC - PubMed

Publication types

MeSH terms