. 2021 Feb 1;35(3-4):218-233.
doi: 10.1101/gad.344184.120. Epub 2021 Jan 14.

ATDC binds to KEAP1 to drive NRF2-mediated tumorigenesis and chemoresistance in pancreatic cancer

Affiliations

ATDC binds to KEAP1 to drive NRF2-mediated tumorigenesis and chemoresistance in pancreatic cancer

Vinee Purohit et al. Genes Dev. .

Abstract

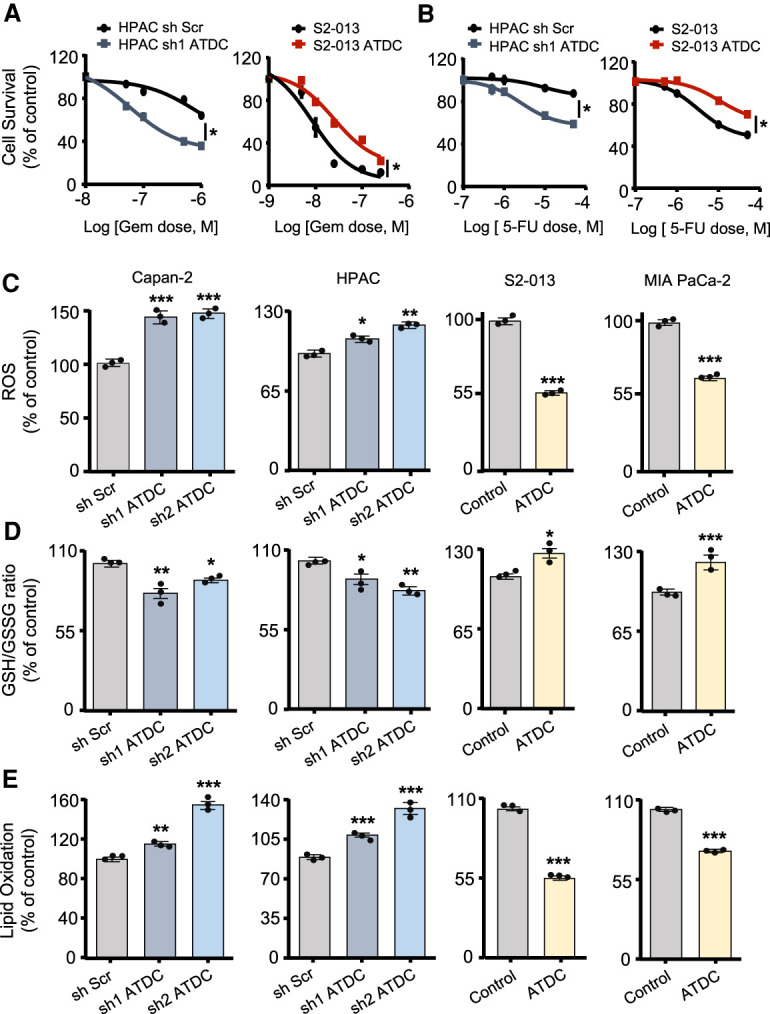
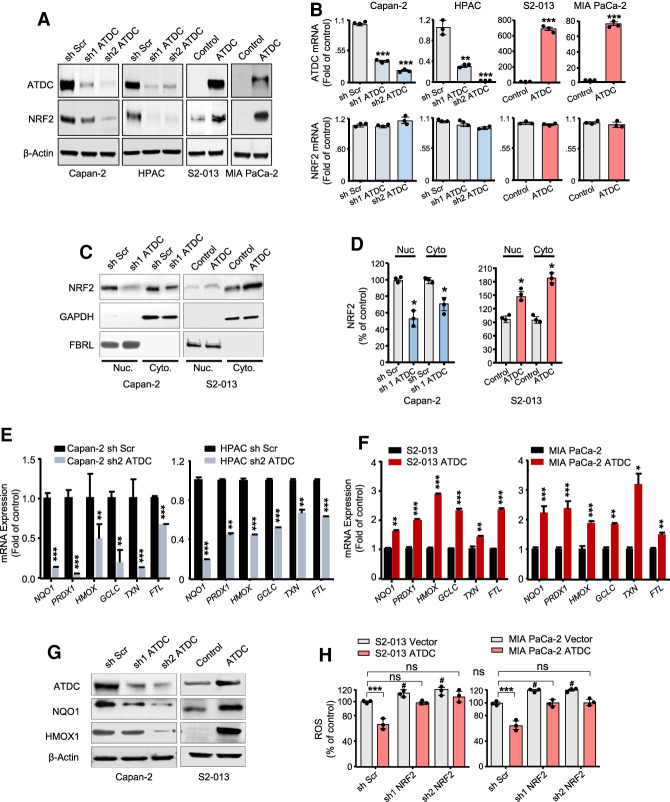
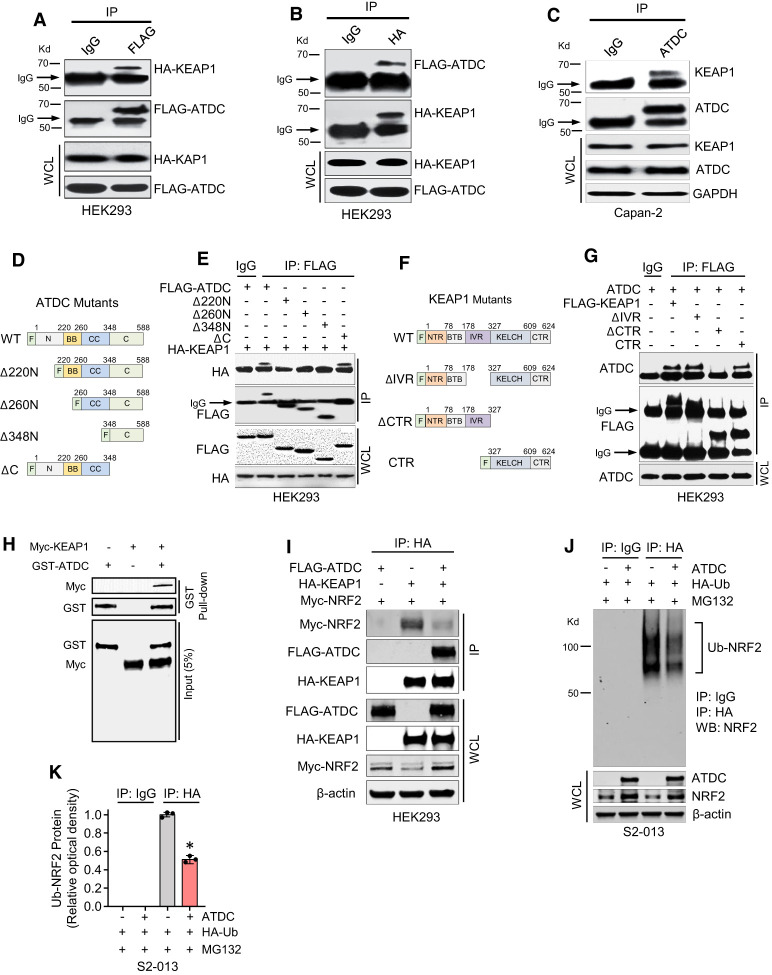
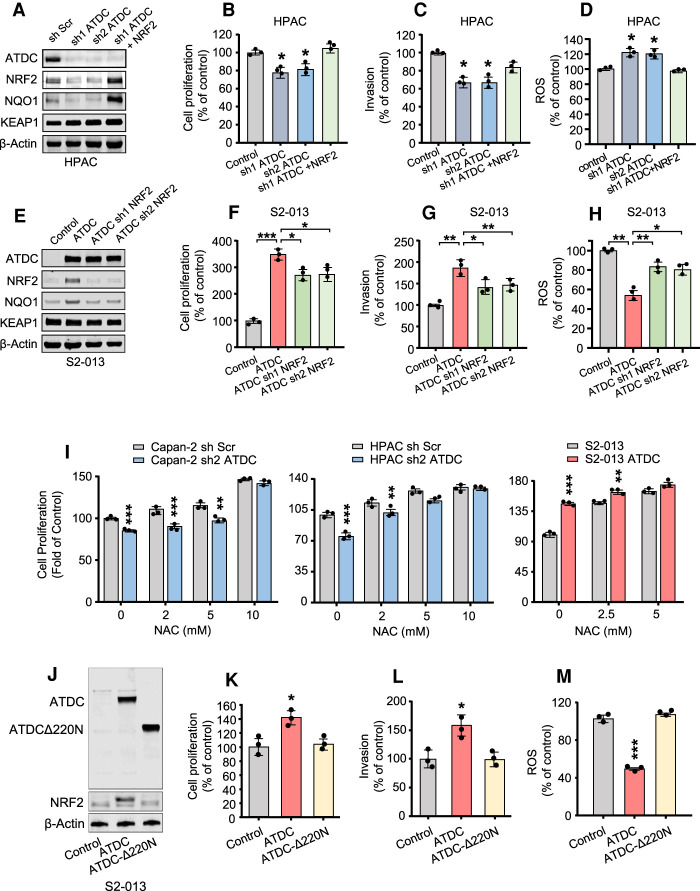
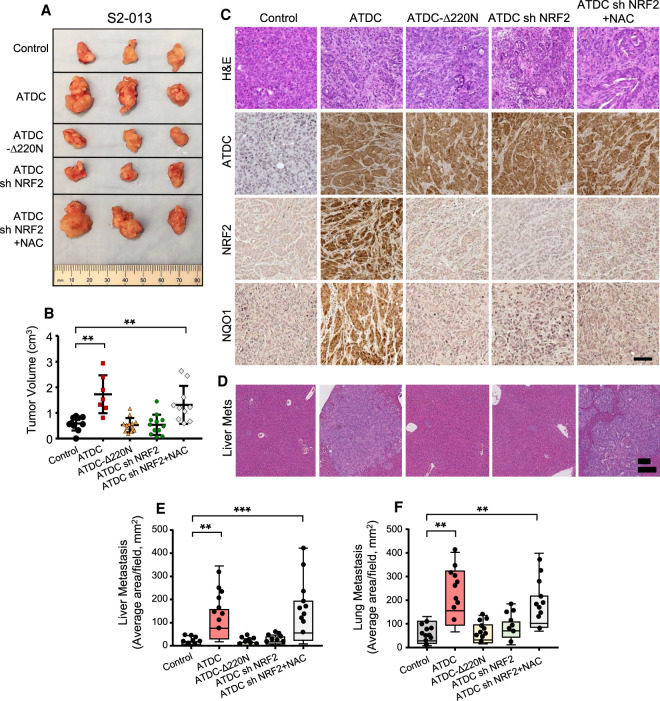
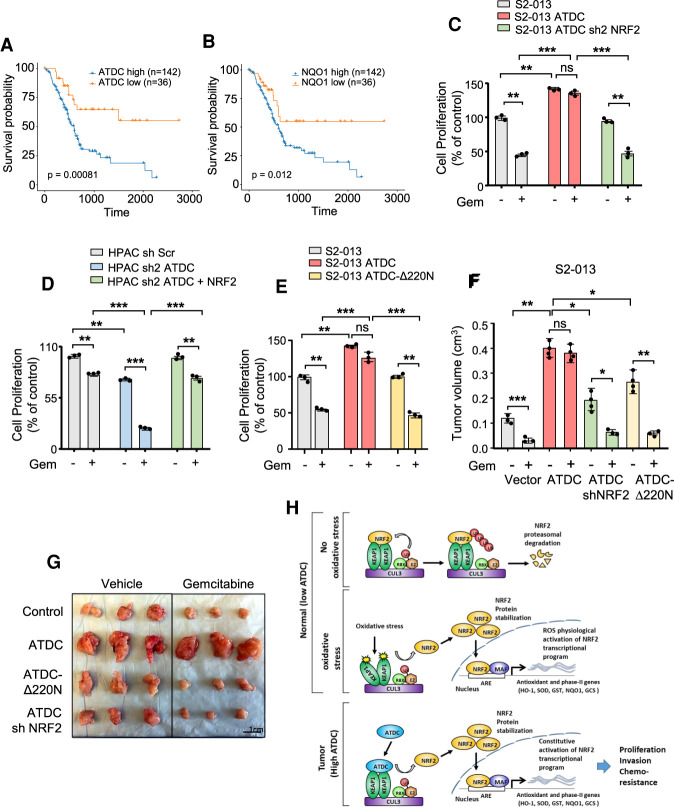
Pancreatic ductal adenocarcinoma is a lethal disease characterized by late diagnosis, propensity for early metastasis and resistance to chemotherapy. Little is known about the mechanisms that drive innate therapeutic resistance in pancreatic cancer. The ataxia-telangiectasia group D-associated gene (ATDC) is overexpressed in pancreatic cancer and promotes tumor growth and metastasis. Our study reveals that increased ATDC levels protect cancer cells from reactive oxygen species (ROS) via stabilization of nuclear factor erythroid 2-related factor 2 (NRF2). Mechanistically, ATDC binds to Kelch-like ECH-associated protein 1 (KEAP1), the principal regulator of NRF2 degradation, and thereby prevents degradation of NRF2 resulting in activation of a NRF2-dependent transcriptional program, reduced intracellular ROS and enhanced chemoresistance. Our findings define a novel role of ATDC in regulating redox balance and chemotherapeutic resistance by modulating NRF2 activity.

Keywords: ATDC (Trim29); chemotherapeutic resistance; pancreatic cancer; tumor growth and invasion.


Figures

Figure 1.
Figure 1.
ATDC regulates oxidative stress and chemoresistance in pancreatic cancer cells. Dose response curves for gemcitabine (GEM) (A) and 5-fluorouracil (5-FU) (B) treatment in S2-013 or HPAC cells with either ATDC overexpression (S2-013) or ATDC shRNA expression (HPAC). (C) Steady state ROS levels in control (Scramble, Scr) and sh ATDC Capan-2 and HPAC cells, and control (vector [Vec]) and ATDC-overexpressing S2-013 and MIA Paca-2 cells. (D) Ratio of reduced (GSH) to oxidized (GSSG) glutathione in the PDA cell lines listed in C. (E) Lipid peroxidation levels in the same isogenic PDA cell lines listed in C. Data are representative of three independent experiments. (*) P < 0.05, (**) P < 0.01, (***) P < 0.005. Mean ± SEM.
Figure 2.
Figure 2.
ATDC-induced alterations in ROS levels are mediated by NRF2. (A) Western blot assays of NRF2 levels in PDA cells with stable knockdown (Capan-2 and HPAC) or overexpression (S2-013 and MIA PaCa-2) of ATDC ([Scr] Scramble, [control] vector). (B) Expression of ATDC and NRF2 mRNA levels in response to modulation of ATDC expression. (C) After cell fractionation, nuclear and cytoplasmic levels of NRF2 in Capan2 or S2-013 cells with altered levels of ATDC were determined by Western blotting. (D) Quantification of nuclear and cytoplasmic levels of NRF2 in C. (E,F) Effect of ATDC knockdown (Capan-2 and HPAC cells) (E) or overexpression (S2-013 and MIA PaCa-2 cells) (F) on the mRNA expression of the NRF2-regulated genes. (NOQ1) NAD(P)H quinone dehydrogenase 1, (PRDX1) peroxiredoxin 1, (HMOX1) hemoxygenase 1, (GCLC) glutamate-cysteine ligase catalytic subunit, (TXN) thioredoxin, (GSTM1) glutathione S-transferase µ1, (GSTM3) glutathione S-transferase µ3, (FTL) ferritin light chain. (G) Expression of NRF2 target proteins HMOX1 and NQO1 in PDA cells with ATDC knockdown (Capan-2) and overexpression (S2-013). (H) Effect of NRF2 knockdown on intracellular ROS levels in control (vector) and ATDC-overexpressing S2-013 and MIA PaCa-2 cells. (#) P < 0.05 versus sh Scr, (ns) not significant. All experiments were repeated three times. (*) P < 0.05, (**) P < 0.01, (***) P < 0.005. Mean ± SEM
Figure 3.
Figure 3.
ATDC stabilizes NRF2 through binding with KEAP1. (AC) Cell lysates from HEK293 cells transfected with FLAG-ATDC and HA-KEAP1, or Capan2 cells transfected with KEAP1 antibody were subjected to immunoprecipitation (IP) with FLAG (A), HA (B), or ATDC (C) antibodies. Immunocomplexes were resolved by SDS-PAGE and subjected to Western analysis with HA (A), FLAG (B), or KEAP1 (C) antibodies. Whole-cell lysates (WCL) were probed with HA, FLAG (A,B), or ATDC (C) antibodies in Western blot assays. IP with IgG served as a negative control. (D) Schematic of FLAG-ATDC mutants used to determine KEAP1-binding region in ATDC. (E) Cell lysates from HEK293 cells transfected with FLAG-tagged ATDC, ATDC mutants or HA-KEAP1 were subjected to IP with FLAG antibody. Immunocomplexes and WCL were resolved by SDS-PAGE and subjected to Western analysis with HA and FLAG antibodies. IP with IgG served as a negative control. The ATDC N-terminal is required for binding with KEAP1. (F) Schematic of KEAP1 deletion mutants used to determine the ATDC-binding domain of KEAP1. (G) Cell lysates from HEK293 cells transfected with FLAG-tagged KEAP1 or FLAG-tagged KEAP1 mutants were subjected to IP with FLAG antibody. Immunocomplexes and WCL were resolved by SDS-PAGE and subjected to Western analysis with ATDC and FLAG antibodies. IP with IgG served as a negative control. Immunoblot results confirm KEAP1 interacts with ATDC through its KELCH domain. (H) In vitro binding assay for GST-ATDC with Myc-KEAP1. (I) Cell lysates from HEK293 cells transfected with FLAG-ATDC, HA-KEAP1, and Myc-NRF2 were subjected to IP with HA antibody. Immunocomplexes and WCL were resolved by SDS-PAGE and subjected to Western analysis with FLAG, HA, Myc, or β-actin antibodies. (J) Cell lysates from S2-013 cells transfected with ATDC and HA-ubiquitin (HA-Ub) were subjected to IP with HA antibody. Immunocomplexes and WCL were resolved by SDS-PAGE and subjected to Western analysis with NRF2, ATDC, or β-actin antibodies. IP with IgG served as a negative control. (K) Densitometric quantification of Ub-NRF2 from J. All experiments were repeated three times. (*) P < 0.05. Mean ± SEM.
Figure 4.
Figure 4.
ATDC-mediated increase in NRF2 regulates growth and invasion in PDA cells in vitro. (A,E) Immunoblotting showing levels of ATDC, NRF2, KEAP1, and NRF2 target NQO1 in HPAC cells with ATDC knockdown with or without subsequent NRF2 overexpression (A) and S2-013 cells overexpressing ATDC with or without subsequent knockdown of NRF2 (E). (B–D) Cell proliferation (B), invasion (C), and ROS formation (D) in HPAC cells with or without sh ATDC and NRF2 rescue. (FH) Cell proliferation (F), invasion (G), and ROS formation (H) in S2-013 cells with or without ATDC overexpression and sh NRF2 rescue. (I) Cell proliferation in ATDC overexpressing S2-013 or Capan2 or HPAC cells with ATDC knockdown treated with increasing concentrations of NAC (0–10 mM). (J) Western blot analysis of ATDC and NRF2 expression in S2-013 cells expressing full-length ATDC or the ATDCΔ220N deletion. β-actin was used as a loading control. (KM) Quantification of cell proliferation (K), invasion (L), and ROS levels (M) in S2-013 cells expressing ATDC or ATDCΔ220N. All experiments were repeated three times. (*) P < 0.05, (**) P < 0.01, (***) P < 0.005. Mean ± SEM.
Figure 5.
Figure 5.
ATDC-mediated increase in NRF2 regulates growth and invasion in vivo. NSG mouse pancreata (n=10/group) were implanted with S2-013 control (empty vector), ATDC, ATDCΔ220N, ATDC + shNRF2 cells. N-acetyl cysteine was provided in drinking water (1 g/L) to a cohort of mice implanted with ATDC + shNRF2 cells. (A) Representative images of tumors harvested at the end of the study. (B) Measurement of tumor volume in experimental groups depicted as scatter plots with error bars denoting SEM. (C) Hematoxylin and eosin (H&E) staining and immunohistochemical staining for NRF2, ATDC, and NQO1 in harvested tumors. (D) Hematoxylin and eosin (H&E) staining of liver metastases. Quantification of liver metastases (E) and lung metastases (F) in all groups. All experiments were performed three times. (**) P < 0.01, (***) P < 0.005. Mean ± SEM.
Figure 6.
Figure 6.
ATDC mediates chemoresistance in PDA by NRF2 signaling. Relative survival in patients with elevated ATDC (A) or NQO1 (B) expression based on the TCGA PAAD data set. (C) Cell proliferation in control S2-013 cells or S2-013 cells overexpressing ATDC in the absence or presence of shNRF2. Cells were left untreated or treated with gemcitabine (GEM; 5 nM) for 3 d. (D) Effect of NRF2 overexpression on chemoresistance in HPAC control (sh Scr) and sh ATDC cells as measured by cell proliferation. Cells were treated with GEM (5 nM) for 3 d. (E) Effect of the ATDCΔ220N mutant on chemoresistance in S2-013 cells. Cells were treated with GEM (5 nM) for 3 d. (F) Quantification of tumor volume in control (vector), ATDC, ATDC shNRF2, and Δ220N ATDC groups treated with vehicle or GEM. (G) Representative images of tumors indicating tumor sizes in the above study groups. All experiments were performed in triplicate. (*) P < 0.05, (**) P < 0.01, (***) P < 0.005. Mean + SEM. (H) Schematic representation showing the mechanism of ATDC-mediated regulation of NRF2 protein levels and antioxidant response resulting in increased growth, metastasis, and chemotherapy resistance.

Similar articles

Cited by

References

    1. Akino N, Wada-Hiraike O, Isono W, Terao H, Honjo H, Miyamoto Y, Tanikawa M, Sone K, Hirano M, Harada M, et al. 2019. Activation of Nrf2/Keap1 pathway by oral dimethylfumarate administration alleviates oxidative stress and age-associated infertility might be delayed in the mouse ovary. Reprod Biol Endocrinol 17: 23 10.1186/s12958-019-0466-y - DOI - PMC - PubMed
    1. Amrutkar M, Gladhaug IP. 2017. Pancreatic cancer chemoresistance to gemcitabine. Cancers (Basel) 9: 157 10.3390/cancers9110157 - DOI - PMC - PubMed
    1. Arora S, Bhardwaj A, Singh S, Srivastava SK, McClellan S, Nirodi CS, Piazza GA, Grizzle WE, Owen LB, Singh AP. 2013. An undesired effect of chemotherapy: gemcitabine promotes pancreatic cancer cell invasiveness through reactive oxygen species-dependent, nuclear factor κB- and hypoxia-inducible factor 1α-mediated up-regulation of CXCR4. J Biol Chem 288: 21197–21207. 10.1074/jbc.M113.484576 - DOI - PMC - PubMed
    1. Bensaad K, Cheung EC, Vousden KH. 2009. Modulation of intracellular ROS levels by TIGAR controls autophagy. EMBO J 28: 3015–3026. 10.1038/emboj.2009.242 - DOI - PMC - PubMed
    1. Berger AH, Brooks AN, Wu X, Shrestha Y, Chouinard C, Piccioni F, Bagul M, Kamburov A, Imielinski M, Hogstrom L, et al. 2016. High-throughput phenotyping of lung cancer somatic mutations. Cancer Cell 30: 214–228. 10.1016/j.ccell.2016.06.022 - DOI - PMC - PubMed

Publication types

MeSH terms