

Ultra-purification of Lipopolysaccharides reveals species-specific signalling bias of TLR4: importance in macrophage function
- PMID: 33446670
- PMCID: PMC7809447
- DOI: 10.1038/s41598-020-79145-w
Ultra-purification of Lipopolysaccharides reveals species-specific signalling bias of TLR4: importance in macrophage function
Abstract
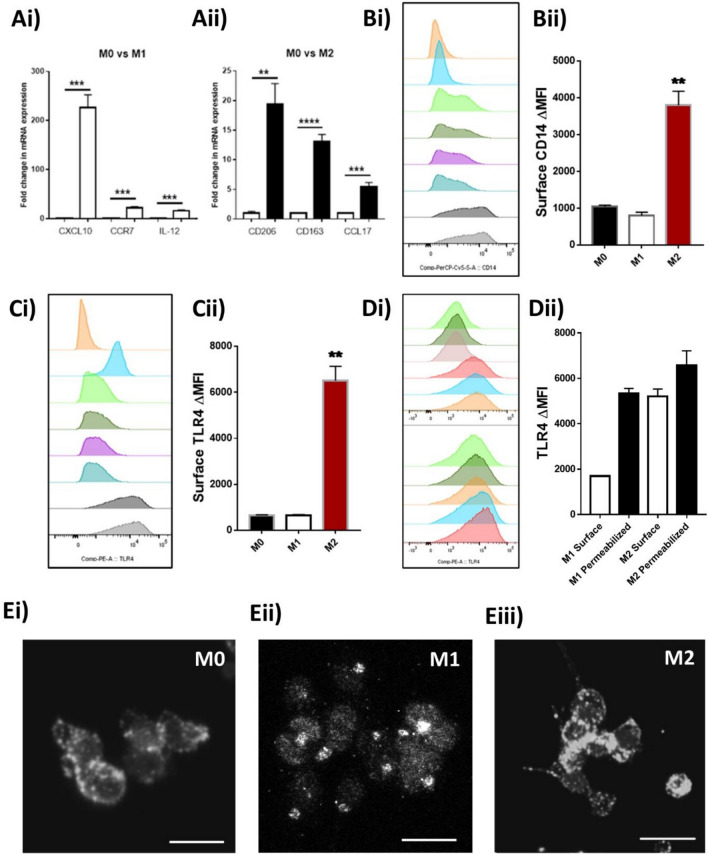
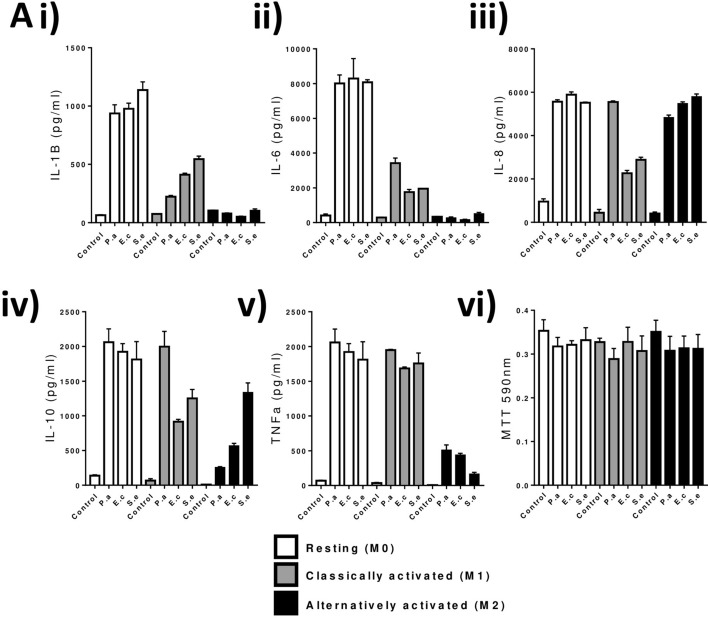
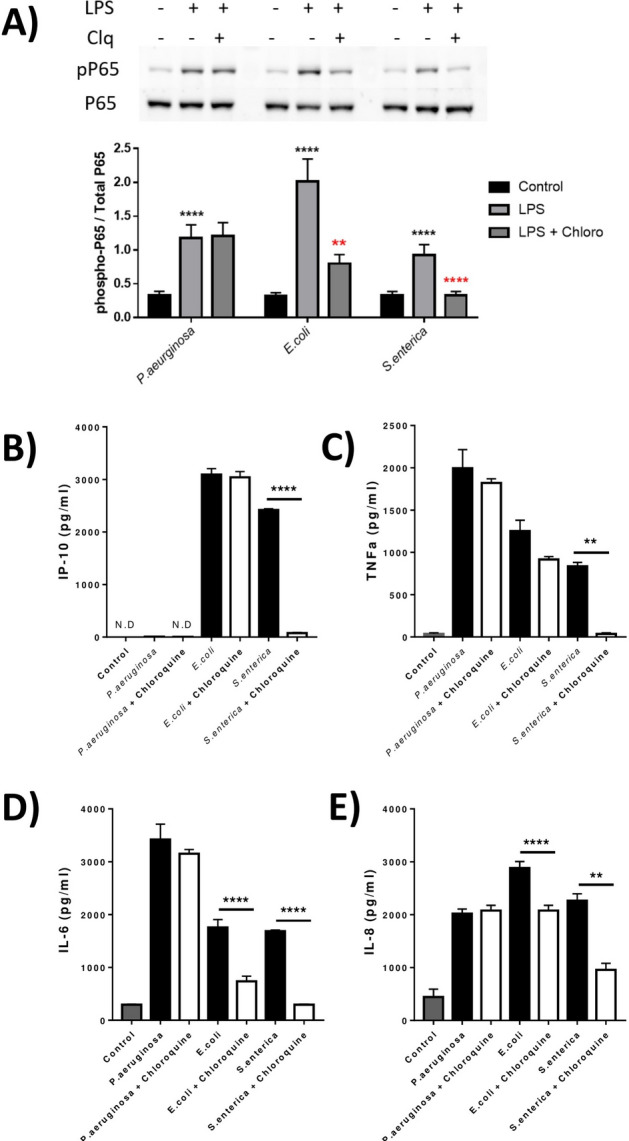
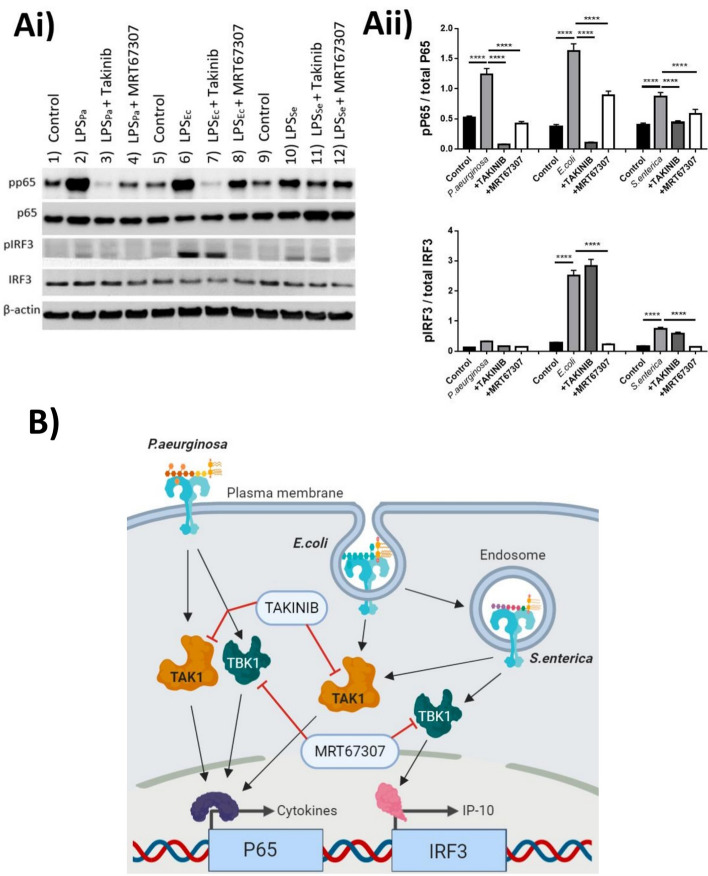
TLR4 location, and bacterial species-derived lipopolysaccharides, play a significant role in the downstream activation of transcription factors, accessory molecules, and products. Here, this is demonstrated through the use of classically-activated and alternatively-activated macrophages. We show that, when polarized, human macrophages differentially express and localize TLR4, resulting in biased recognition and subsequent signalling of LPS derived from Pseudomonas aeruginosa, Escherichia coli, and Salmonella enterica. Analysis of activation demonstrated that in classically activated macrophages, P. aeruginosa signals from the plasma membrane via TLR4 to p65 dependent on TAK1 and TBK1 signalling. E. coli signals dependent or independent of the endosome, utilizing both TAK1- and TBK1-signalling to induce P65 and IRF3 inducible genes and cytokines. S. enterica however, only induces P65 and IRF3 phosphorylation through signalling via the endosome. This finding outlines clear signalling mechanisms by which innate immune cells, such as macrophages, can distinguish between bacterial species and initiate specialized responses through TLR4.
Conflict of interest statement
The authors declare no competing interests.
Figures
Similar articles
-
MyD88-dependent and -independent signalling via TLR3 and TLR4 are differentially modulated by Δ9-tetrahydrocannabinol and cannabidiol in human macrophages.J Neuroimmunol. 2020 Jun 15;343:577217. doi: 10.1016/j.jneuroim.2020.577217. Epub 2020 Mar 20. J Neuroimmunol. 2020. PMID: 32244040
-
Biased signalling is an essential feature of TLR4 in glioma cells.Biochim Biophys Acta. 2016 Dec;1863(12):3084-3095. doi: 10.1016/j.bbamcr.2016.09.016. Epub 2016 Sep 23. Biochim Biophys Acta. 2016. PMID: 27669113
-
Pellino-1 Positively Regulates Toll-like Receptor (TLR) 2 and TLR4 Signaling and Is Suppressed upon Induction of Endotoxin Tolerance.J Biol Chem. 2015 Jul 31;290(31):19218-32. doi: 10.1074/jbc.M115.640128. Epub 2015 Jun 16. J Biol Chem. 2015. PMID: 26082489 Free PMC article.
-
Caspase-11 non-canonical inflammasome: a critical sensor of intracellular lipopolysaccharide in macrophage-mediated inflammatory responses.Immunology. 2017 Oct;152(2):207-217. doi: 10.1111/imm.12787. Epub 2017 Jul 31. Immunology. 2017. PMID: 28695629 Free PMC article. Review.
-
LPS-induced cytokine production in human monocytes and macrophages.Crit Rev Immunol. 2011;31(5):379-446. doi: 10.1615/critrevimmunol.v31.i5.20. Crit Rev Immunol. 2011. PMID: 22142165 Review.
Cited by
-
Lipopolysaccharide from Porphyromonas gingivalis, but Not from Porphyromonas endodontalis, Induces Macrophage M1 Profile.Int J Mol Sci. 2022 Sep 2;23(17):10011. doi: 10.3390/ijms231710011. Int J Mol Sci. 2022. PMID: 36077408 Free PMC article.
-
Phage-resistance alters Lipid A reactogenicity: a new strategy for LPS-based conjugate vaccines against Salmonella Rissen.Front Immunol. 2024 Dec 11;15:1450600. doi: 10.3389/fimmu.2024.1450600. eCollection 2024. Front Immunol. 2024. PMID: 39723217 Free PMC article.
-
From theory to platelets: unraveling the history and complexities of biased signaling.Blood Vessel Thromb Hemost. 2025 May 5;2(3):100073. doi: 10.1016/j.bvth.2025.100073. eCollection 2025 Aug. Blood Vessel Thromb Hemost. 2025. PMID: 40765916 Free PMC article. Review.
-
Integrin β2 regulates titanium particle‑induced inflammation in macrophages: In vitro aseptic loosening model.Mol Med Rep. 2025 Jan;31(1):25. doi: 10.3892/mmr.2024.13390. Epub 2024 Nov 14. Mol Med Rep. 2025. PMID: 39540364 Free PMC article.
-
Mincle-binding DNA aptamer demonstrates therapeutic potential in a model of inflammatory bowel disease.Mol Ther Nucleic Acids. 2022 Jun 2;28:935-947. doi: 10.1016/j.omtn.2022.05.026. eCollection 2022 Jun 14. Mol Ther Nucleic Acids. 2022. PMID: 35782912 Free PMC article.
References
Publication types
MeSH terms
Substances
LinkOut - more resources
Full Text Sources
Other Literature Sources
Miscellaneous
