. 2021 Jan 14;11(1):1276.
doi: 10.1038/s41598-020-79666-4.

A defined glycosylation regulatory network modulates total glycome dynamics during pluripotency state transition

Affiliations

A defined glycosylation regulatory network modulates total glycome dynamics during pluripotency state transition

Federico Pecori et al. Sci Rep. .

Abstract

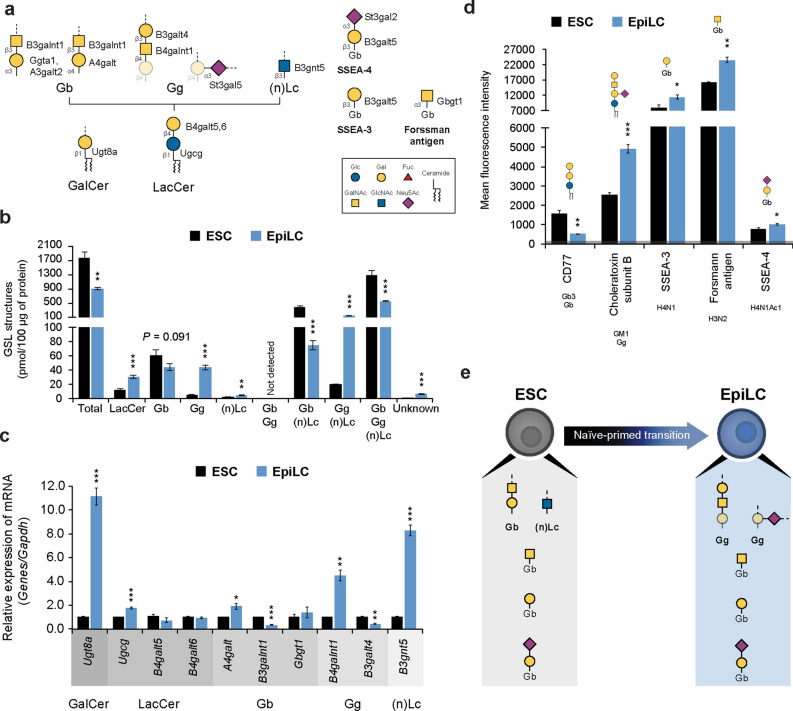
Embryonic stem cells (ESCs) and epiblast-like cells (EpiLCs) recapitulate in vitro the epiblast first cell lineage decision, allowing characterization of the molecular mechanisms underlying pluripotent state transition. Here, we performed a comprehensive and comparative analysis of total glycomes of mouse ESCs and EpiLCs, revealing that overall glycosylation undergoes dramatic changes from early stages of development. Remarkably, we showed for the first time the presence of a developmentally regulated network orchestrating glycosylation changes and identified polycomb repressive complex 2 (PRC2) as a key component involved in this process. Collectively, our findings provide novel insights into the naïve-to-primed pluripotent state transition and advance the understanding of glycosylation complex regulation during early mouse embryonic development.


Conflict of interest statement

The authors declare no competing interests.

Figures

Figure 1
Figure 1
EpiLC differentiation from ESCs. (a) Schematic representation of EpiLC differentiation protocol from ESCs. (b) Morphology of ESCs (upper panel), and EpiLCs (lower panel). Scale bar, 200 μm. (c) Real-time PCR analysis of pluripotency (red), naïve (grey), and primed (blue) markers normalized against Gapdh in ESCs and EpiLCs, and shown as a fold change relative to ESCs. (d) Representative cropped image of a western blot analysis of p-ERK1/2, ERK1/2, Oct3/4, Nanog, Otx2 and Gapdh in ESCs and EpiLCs. Arrowheads indicate the specific protein bands. Full-length blots are presented in Supplementary Fig. S15. (e) Representative image of permeabilized ESCs and EpiLCs after immunostaining using anti-Oct3/4, anti-Nanog and anti-Otx2 Abs. Nuclei were stained with Hoechst. Scale bar, 10 μm. Values are shown as means ± s.e.m. of three independent experiments. Significant values are indicated as *P < 0.05, and **P < 0.01.
Figure 2
Figure 2
ESC and EpiLC N-glycosylation structural and transcriptional analysis. (a) Schematic diagram of the N-glycosylation pathway. The asterisk denotes enzyme putative activity. (b) Absolute amount of N-glycans detected by MS in ESCs and EpiLCs. N-glycosylation subclasses: high mannose-type (HM), pauci-mannose (PM), and complex/hybrid (C/H). Fucose: Fuc; sialylation: Sia. (c) Absolute amount of FOS detected by MS in ESCs and EpiLCs (left panel) and percentage of FOS relative to total amount of N-glycans (right panel). (d) Real-time PCR analysis of N-glycosylation-specific enzymes normalized against Gapdh in ESCs and EpiLCs, and shown as a fold change relative to ESCs. (e) N-glycan structures profiling by FACS using specific lectins in ESCs and EpiLCs. Lectins specificities are stated below the labels and schematically represented above each histogram. The grey line at the bottom represents the negative control staining. (f) Model of N-glycome alterations during ESC to EpiLC transition. Values are shown as means ± s.e.m. of three independent experiments in (d,e) and four independent experiments in (b,c). Significant values are indicated as *P < 0.05, **P < 0.01, and ***P < 0.001.
Figure 3
Figure 3
ESC and EpiLC O-glycosylation structural and transcriptional analysis. (a) Schematic diagram of the O-glycosylation pathway. (b) Absolute amount of O-glycans detected by MS in ESCs and EpiLCs. HexNAc: GalNAc or GlcNAc. (c) Real-time PCR analysis of O-glycosylation-specific enzymes normalized against Gapdh in ESCs and EpiLCs, and shown as a fold change relative to ESCs. (d) O-glycan structure profiling by FACS using specific lectins/Abs in ESCs and EpiLCs. Lectin/Ab specificities are stated below the labels and schematically represented above each histogram. The grey line at the bottom represents the negative control staining. (e) Model of O-glycome changes during ESC to EpiLC transition. Values are shown as means ± s.e.m. of three independent experiments in (c,d) and four independent experiments in (b). Significant values are indicated as *P < 0.05, **P < 0.01, and ***P < 0.001.
Figure 4
Figure 4
GAG structural and transcriptional analysis in ESCs and EpiLCs. (a) Schematic diagram of the GAG synthetic pathway. Asterisks denote enzymes whose contribution to biosynthesis remains unclear. (b) Absolute amount of GAG detected by HPLC in ESCs and EpiLCs. GAG subclasses: heparan sulfate (HS), chondroitin sulfate/dermatan sulfate (CS/DS) and hyaluronan (HA). (c) Real-time PCR analysis of GAG-specific enzymes normalized against Gapdh in ESCs and EpiLCs, and shown as a fold change relative to ESCs. (d) GAG structure profiling by FACS using specific Abs in ESCs and EpiLCs. Ab specificities are stated below the labels and schematically represented above each histogram. The grey line at the bottom represents the negative control staining. (e) Model of GAG modifications during ESC to EpiLC transition. Values are shown as means ± s.e.m. of three independent experiments. Significant values are indicated as *P < 0.05, **P < 0.01, and ***P < 0.001.
Figure 5
Figure 5
GSL structural and transcriptional analysis in ESCs and EpiLCs. (a) Schematic diagram of the GSL synthetic pathway. (b) Absolute amount of GSL detected by MS in ESCs and EpiLCs. GSL subclasses: galactosylceramide (GalCer), lactosylceramide (LacCer), globo (Gb), ganglio (Gg) and neolacto/lacto ((n)Lc). The GbGg, Gb(n)Lc, Gg(n)Lc, and GbGg(n)Lc histograms represent GSL structures which, based on the deduced composition by MS, cannot be categorize in a single subclass. (c) Real-time PCR analysis of GSL-specific enzymes normalized against Gapdh in ESCs and EpiLCs, and shown as a fold change relative to ESCs. (d) GSL structure profiling by FACS using specific Abs in ESCs and EpiLCs. Ab specificities are stated below the labels and schematically represented above each histogram. The grey line at the bottom represents the negative control staining. (e) Model of GSL modifications during ESC to EpiLC transition. Values are shown as means ± s.e.m. of three independent experiments (c,d) and four independent experiments in (b). Significant values are indicated as *P < 0.05, **P < 0.01, and ***P < 0.001.
Figure 6
Figure 6
Pathway-non-specific structural and transcriptional analysis in ESCs and EpiLCs. (a) Schematic diagram of major pathway-non-specific structures. The asterisk denotes enzyme putative activity. (b) Real-time PCR analysis of elongation/branching enzymes normalized against Gapdh in ESCs and EpiLCs, and shown as a fold change relative to ESCs. (c) Real-time PCR analysis of capping/terminal modification enzymes normalized against Gapdh in ESCs and EpiLCs, and shown as a fold change relative to ESCs. (d) Total absolute amount of terminal modifications detected by MS in ESCs and EpiLCs (upper panel). Relative amount of total sialic acid in α2,3 and α2,6 configuration (lower panel). Fucose: Fuc; sialylation: Sia. (e) Pathway-non-specific structure profiling by FACS using specific lectins/Abs in ESCs and EpiLCs. Lectin/Ab specificities are stated below the labels and schematically represented above each histogram. The grey line at the bottom represents the negative control staining. (f) Model of pathway-non-specific alterations during ESC to EpiLC transition. Values are shown as means ± s.e.m. of three independent experiments in (b,c,e) and four independent experiments in (d). Significant values are indicated as *P < 0.05, **P < 0.01, and ***P < 0.001.
Figure 7
Figure 7
PRC2 contributes to glycosylation changes during ESC to EpiLC transition. (a) Analyzed ChIP-seq datasets were obtained from wild-type/untreated ESCs precipitated using: anti-Suz12 Ab (SRX1372665) (Ref.), anti-Ezh2 Ab (SRX2528911) (Ref.), anti-Mtf2 Ab (SRX2776968) (Ref.), anti-Jarid2 Ab (SRX3738839) (Ref.) and anti-Rnf2 Ab (SRX191072) (Ref.). Percentages of ChIP occupancy per glycosylation class were determined within a range of ± 5 kb and with a threshold for statistical significance set as 50 (1 < 1E−05) calculated by peak-caller MACS2. (b) Venn diagrams showing the ChIP occupancies of PRC components overlap on glycosylation genes. (c) FACS analysis of H3 (left panel) and H3K27me3 (right panel) upon EED226 treatment for 48 h and relative histogram representing the fluorescence mean intensity shown as a fold change relative to that of DMSO-treated cells. Negative control: grey; DMSO: black; EED226: blue. (d) Representative cropped image of a western blot analysis of H3K27me3, H3 and Gapdh in ESCs treated with EED226 for 48 h. Full-length blots are presented in Supplementary Fig. S16. (e) Overall glycomic profiling by FACS using specific lectins/Abs in EpiLCs and EED226-treated ESCs, and shown as a fold change relative to ESCs and DMSO-treated ESCs (control), respectively. Lectin/Ab specificities are schematically represented above each histogram. The dotted line indicates the control fold change. (f) Schematic representation of the glycosylation regulatory network during ESC to EpiLC transition: PRC2 direct regulation (1, red), PRC2 regulation together with other unidentified factor(s) (2, blue), and PRC2-independent pathway(s) (3, black) (the grey label indicates unchanged structures). Values are shown as means ± s.e.m. of three independent experiments. Significant values are indicated as *P < 0.05, **P < 0.01, and ***P < 0.001.
Figure 8
Figure 8
Schematic model of glycosylation dynamics and regulatory network during the ESC (naïve) to EpiLC (primed) transition. The overall glycosylation composition changes dramatically during the naïve to primed transition. PRC2 is a key component of the developmentally regulated network orchestrating glycosylation dynamics. The size of each pie chart reflects the absolute mean quantity of glycans (pmol/100 μg of protein). N-linked and GSL pie charts size is scaled 2 and 20 times, respectively.

References

    1. Bedzhov, I., Graham, S. J. L., Yan Leung, C. & Zernicka-Goetz, M. Correction to: ‘Developmental plasticity, cell fate specification and morphogenesis in the early mouse embryo’. Philos. Trans. R. Soc. B Biol. Sci.370: 339 (2015). - PMC - PubMed
    1. Evans MJ, Kaufman MH. Establishment in culture of pluripotential cells from mouse embryos. Nature. 1981;292:154–156. doi: 10.1038/292154a0. - DOI - PubMed
    1. Hayashi K, Ohta H, Kurimoto K, Aramaki S, Saitou M. Reconstitution of the mouse germ cell specification pathway in culture by pluripotent stem cells. Cell. 2011;146:519–532. doi: 10.1016/j.cell.2011.06.052. - DOI - PubMed
    1. Nichols J, Smith A. Naive and primed pluripotent states. Cell Stem Cell. 2009;4:487–492. doi: 10.1016/j.stem.2009.05.015. - DOI - PubMed
    1. Shahbazi MN, et al. Self-organization of the human embryo in the absence of maternal tissues. Nat. Cell Biol. 2016;18:700–708. doi: 10.1038/ncb3347. - DOI - PMC - PubMed

Publication types