

NT-PGC-1α deficiency attenuates high-fat diet-induced obesity by modulating food intake, fecal fat excretion and intestinal fat absorption
- PMID: 33446719
- PMCID: PMC7809341
- DOI: 10.1038/s41598-020-79823-9
NT-PGC-1α deficiency attenuates high-fat diet-induced obesity by modulating food intake, fecal fat excretion and intestinal fat absorption
Abstract
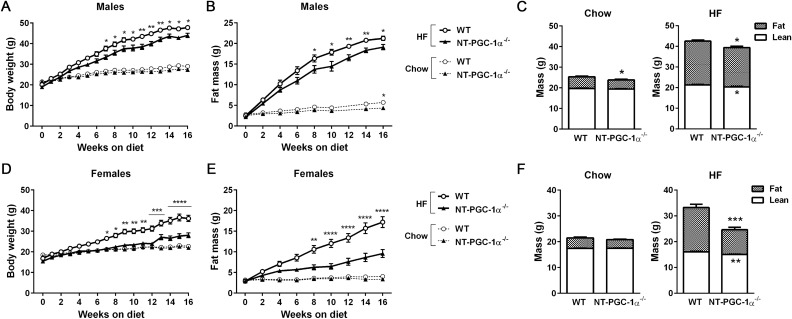
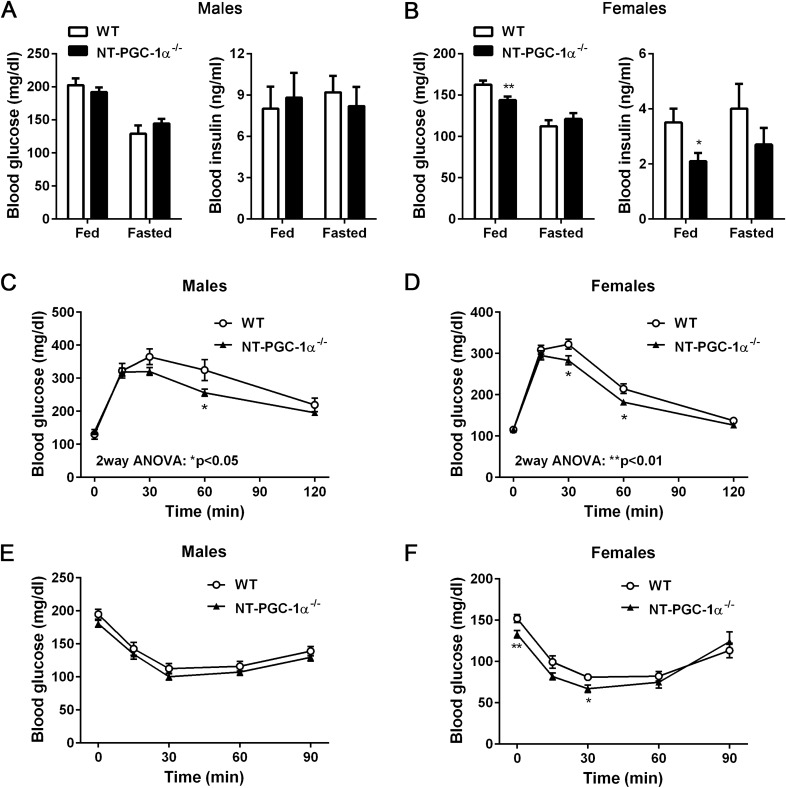
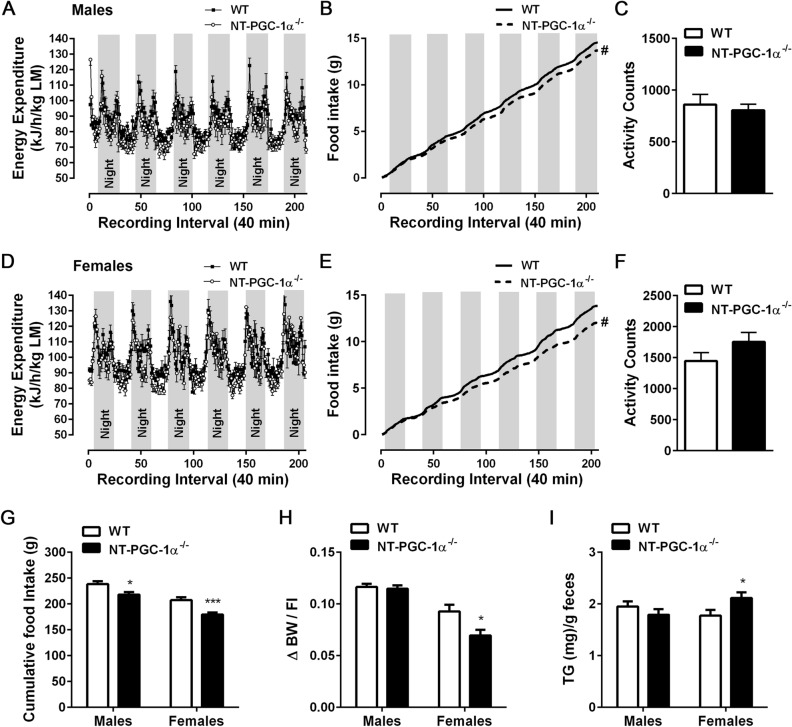
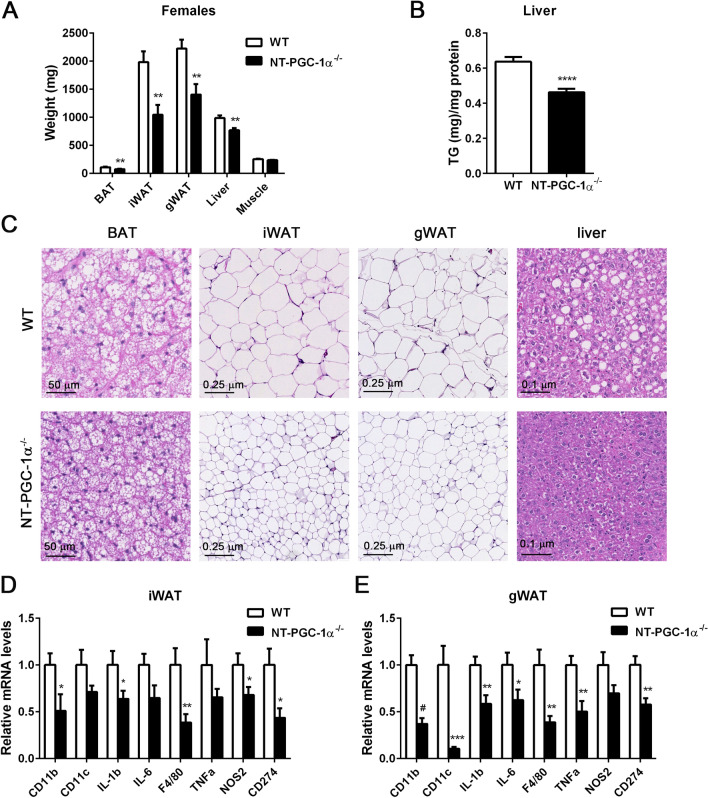
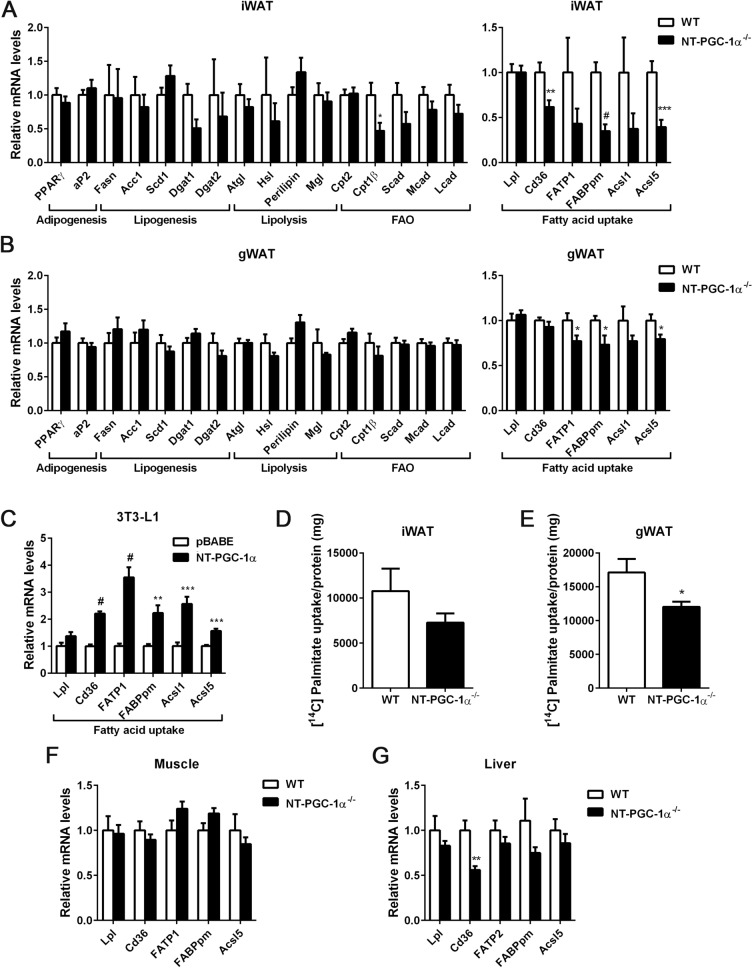
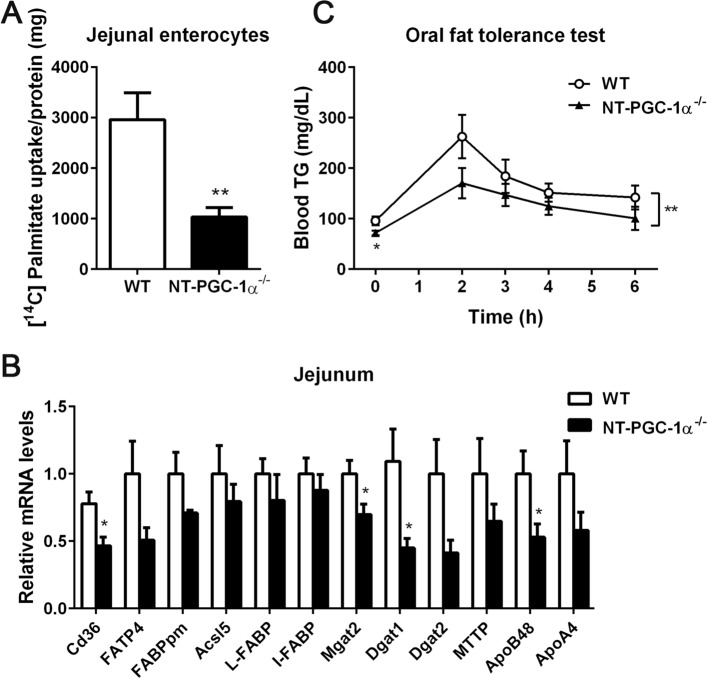
Transcriptional coactivator PGC-1α and its splice variant NT-PGC-1α regulate metabolic adaptation by modulating many gene programs. Selective ablation of PGC-1α attenuates diet-induced obesity through enhancing fatty acid oxidation and thermogenesis by upregulation of NT-PGC-1α in brown adipose tissue (BAT). Recently, we have shown that selective ablation of NT-PGC-1α reduces fatty acid oxidation in BAT. Thus, the objective of this study was to test our hypothesis that NT-PGC-1α-/- mice would be more prone to diet-induced obesity. Male and female NT-PGC-1α+/+ (WT) and NT-PGC-1α-/- mice were fed a regular chow or 60% high-fat (HF) diet for 16 weeks. Contrary to our expectations, both male and female NT-PGC-1α-/- mice fed HFD were protected from diet-induced obesity, with more pronounced effects in females. This lean phenotype was primarily driven by reduced dietary fat intake. Intriguingly, HFD-fed female, but not male, NT-PGC-1α-/- mice further exhibited decreased feed efficiency, which was closely associated with increased fecal fat excretion and decreased uptake of fatty acids by the intestinal enterocytes and adipocytes with a concomitant decrease in fatty acid transporter gene expression. Collectively, our results highlight the role for NT-PGC-1α in regulating whole body lipid homeostasis under HFD conditions.
Conflict of interest statement
The authors declare no competing interests.
Figures
Similar articles
-
NT-PGC-1α activation attenuates high-fat diet-induced obesity by enhancing brown fat thermogenesis and adipose tissue oxidative metabolism.Diabetes. 2014 Nov;63(11):3615-25. doi: 10.2337/db13-1837. Epub 2014 May 21. Diabetes. 2014. PMID: 24848065 Free PMC article.
-
Regulation of Brown and White Adipocyte Transcriptome by the Transcriptional Coactivator NT-PGC-1α.PLoS One. 2016 Jul 25;11(7):e0159990. doi: 10.1371/journal.pone.0159990. eCollection 2016. PLoS One. 2016. PMID: 27454177 Free PMC article.
-
NT-PGC-1α deficiency decreases mitochondrial FA oxidation in brown adipose tissue and alters substrate utilization in vivo.J Lipid Res. 2018 Sep;59(9):1660-1670. doi: 10.1194/jlr.M085647. Epub 2018 Jul 19. J Lipid Res. 2018. PMID: 30026188 Free PMC article.
-
An emerging role for epigenetic regulation of Pgc-1α expression in environmentally stimulated brown adipose thermogenesis.Environ Epigenet. 2017 Jun 30;3(2):dvx009. doi: 10.1093/eep/dvx009. eCollection 2017 May. Environ Epigenet. 2017. PMID: 29492311 Free PMC article. Review.
-
High-Fat Diet and Female Fertility.Endocrinology. 2017 Aug 1;158(8):2407-2419. doi: 10.1210/en.2017-00371. Endocrinology. 2017. PMID: 28586412 Free PMC article. Review.
Cited by
-
Potential of Telomerase in Age-Related Macular Degeneration-Involvement of Senescence, DNA Damage Response and Autophagy and a Key Role of PGC-1α.Int J Mol Sci. 2021 Jul 3;22(13):7194. doi: 10.3390/ijms22137194. Int J Mol Sci. 2021. PMID: 34281248 Free PMC article. Review.
-
Obesity-induced PARIS (ZNF746) accumulation in adipose progenitor cells leads to attenuated mitochondrial biogenesis and impaired adipogenesis.Sci Rep. 2023 Dec 27;13(1):22990. doi: 10.1038/s41598-023-49996-0. Sci Rep. 2023. PMID: 38151567 Free PMC article.
-
Cold-induced expression of a truncated adenylyl cyclase 3 acts as rheostat to brown fat function.Nat Metab. 2024 Jun;6(6):1053-1075. doi: 10.1038/s42255-024-01033-8. Epub 2024 Apr 29. Nat Metab. 2024. PMID: 38684889 Free PMC article.
-
Peroxisome proliferator-activated receptor gamma coactivator-1 (PGC-1) family in physiological and pathophysiological process and diseases.Signal Transduct Target Ther. 2024 Mar 1;9(1):50. doi: 10.1038/s41392-024-01756-w. Signal Transduct Target Ther. 2024. PMID: 38424050 Free PMC article. Review.
-
Inhibition of CXXC5 function reverses obesity-related metabolic diseases.Clin Transl Med. 2022 Apr;12(4):e742. doi: 10.1002/ctm2.742. Clin Transl Med. 2022. PMID: 35384342 Free PMC article.
References
Publication types
MeSH terms
Substances
Grants and funding
LinkOut - more resources
Full Text Sources
Other Literature Sources
Medical
Molecular Biology Databases
Research Materials
Miscellaneous
