

Shared and unique metabolic features of the malignant and benign thyroid lesions determined with use of 1H HR MAS NMR spectroscopy
- PMID: 33446721
- PMCID: PMC7809111
- DOI: 10.1038/s41598-020-79565-8
Shared and unique metabolic features of the malignant and benign thyroid lesions determined with use of 1H HR MAS NMR spectroscopy
Abstract
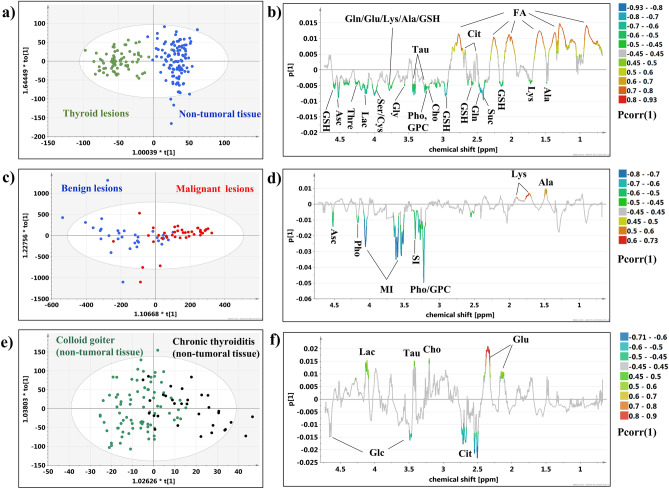
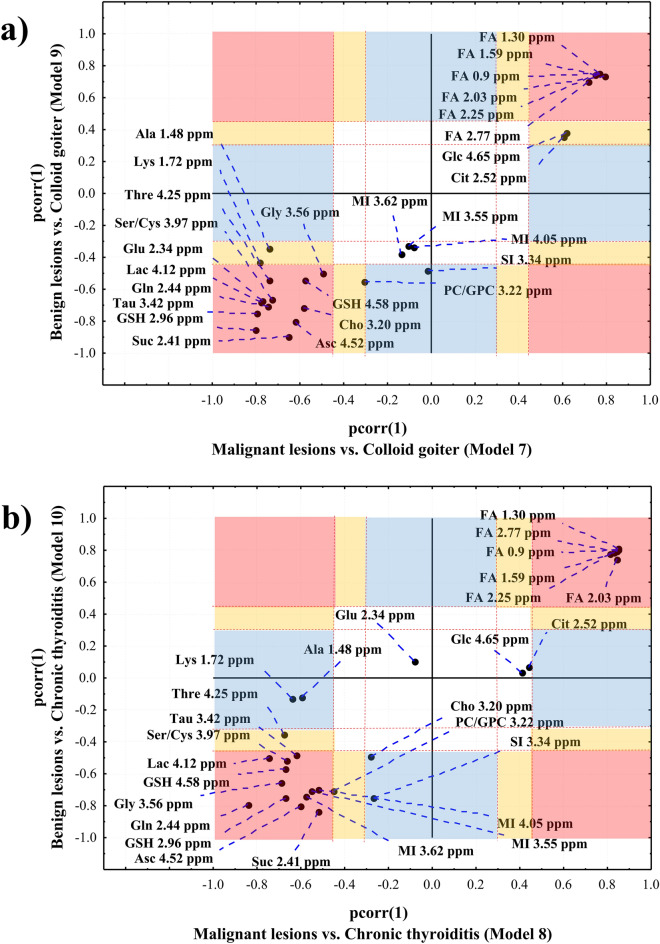
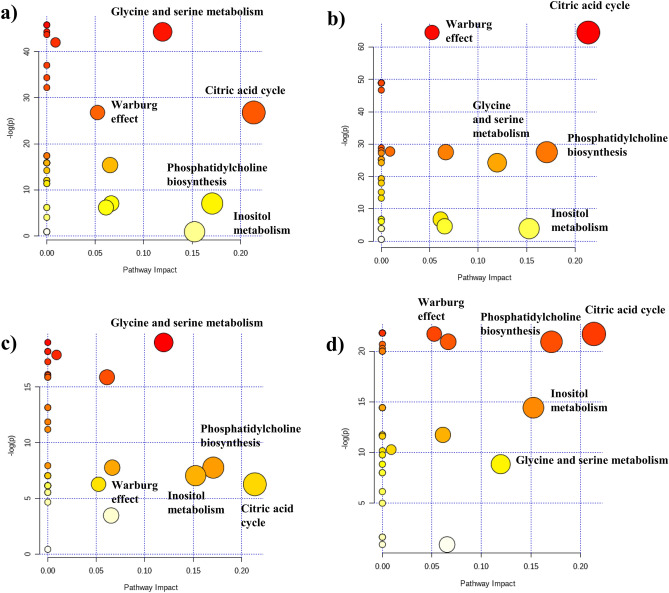
The purpose of this work was to investigate the distinct and common metabolic features of the malignant and benign thyroid lesions in reference to the non-transformed tissue from the contralateral gland (chronic thyroiditis and colloid goiter). 1H HR MAS NMR spectra of 38 malignant lesions, 32 benign lesions and 112 samples from the non-tumoral tissue (32 from chronic thyroiditis and 80 samples from colloid goiter) were subjected both to multivariate and univariate analysis. The increased succinate, glutamine, glutathione, serine/cysteine, ascorbate, lactate, taurine, threonine, glycine, phosphocholine/glycerophosphocholine and decreased lipids were found in both lesion types in comparison to either colloid goiter or chronic thyroiditis. The elevated glutamate and choline, and reduced citrate and glucose were additionally evident in these lesions in reference to goiter, while the increased myo-inositol-in comparison to thyroiditis. The malignant lesions were characterized by the higher alanine and lysine levels than colloid goiter and thyroiditis, while scyllo-inositol was uniquely increased in the benign lesions (not in cancer) in comparison to both non-tumoral tissue types. Moreover, the benign lesions presented with the unique increase of choline in reference to thyroiditis (not observed in the cancerous tissue). The metabolic heterogeneity of the non-tumoral tissue should be considered in the analysis of metabolic reprogramming in the thyroid lesions.
Conflict of interest statement
The authors declare no competing interests.
Figures


Similar articles
-
Grading of endometrial cancer using 1H HR-MAS NMR-based metabolomics.Sci Rep. 2021 Sep 13;11(1):18160. doi: 10.1038/s41598-021-97505-y. Sci Rep. 2021. PMID: 34518615 Free PMC article.
-
DNA repair proteins may differentiate papillary thyroid cancer from chronic lymphocytic thyroiditis and nodular colloidal goiter.Sci Rep. 2021 May 11;11(1):9932. doi: 10.1038/s41598-021-89403-0. Sci Rep. 2021. PMID: 33976347 Free PMC article.
-
Follicular adenomas exhibit a unique metabolic profile. ¹H NMR studies of thyroid lesions.PLoS One. 2013 Dec 23;8(12):e84637. doi: 10.1371/journal.pone.0084637. eCollection 2013. PLoS One. 2013. PMID: 24376829 Free PMC article.
-
Role of FNA in the medical management of minimally enlarged thyroid.Diagn Cytopathol. 2006 Mar;34(3):196-200. doi: 10.1002/dc.20415. Diagn Cytopathol. 2006. PMID: 16470863
-
[Serum thyroglobulin and thyroid diseases (author's transl)].Rinsho Byori. 1982 Feb;30(2):126-37. Rinsho Byori. 1982. PMID: 7045466 Review. Japanese. No abstract available.
Cited by
-
Exploring the clinical utility of DPP-IV and SGLT2 inhibitors in papillary thyroid cancer: a literature review.Front Pharmacol. 2024 Jan 16;15:1323083. doi: 10.3389/fphar.2024.1323083. eCollection 2024. Front Pharmacol. 2024. PMID: 38292938 Free PMC article. Review.
-
The potential value of LC-MS non-targeted metabonomics in the diagnosis of follicular thyroid carcinoma.Front Oncol. 2022 Dec 22;12:1076548. doi: 10.3389/fonc.2022.1076548. eCollection 2022. Front Oncol. 2022. PMID: 36620583 Free PMC article.
-
Metabolite signature of human malignant thyroid tissue: A systematic review and meta-analysis.Cancer Med. 2024 Apr;13(8):e7184. doi: 10.1002/cam4.7184. Cancer Med. 2024. PMID: 38646957 Free PMC article.
-
Experimental study on changes in metabolic mechanism of papillary thyroid carcinoma complicated with Hashimoto's thyroiditis.Heliyon. 2023 Oct 5;9(10):e20661. doi: 10.1016/j.heliyon.2023.e20661. eCollection 2023 Oct. Heliyon. 2023. PMID: 37860538 Free PMC article.
-
An Update on MR Spectroscopy in Cancer Management: Advances in Instrumentation, Acquisition, and Analysis.Radiol Imaging Cancer. 2024 May;6(3):e230101. doi: 10.1148/rycan.230101. Radiol Imaging Cancer. 2024. PMID: 38578207 Free PMC article. Review.
References
Publication types
MeSH terms
Substances
Supplementary concepts
LinkOut - more resources
Full Text Sources
Other Literature Sources
Medical
