. 2021 Jan 14;11(1):1293.
doi: 10.1038/s41598-020-80534-4.

Clinical characteristics and overall survival nomogram of second primary malignancies after prostate cancer, a SEER population-based study

Affiliations

Clinical characteristics and overall survival nomogram of second primary malignancies after prostate cancer, a SEER population-based study

Yi Liu et al. Sci Rep. .

Abstract

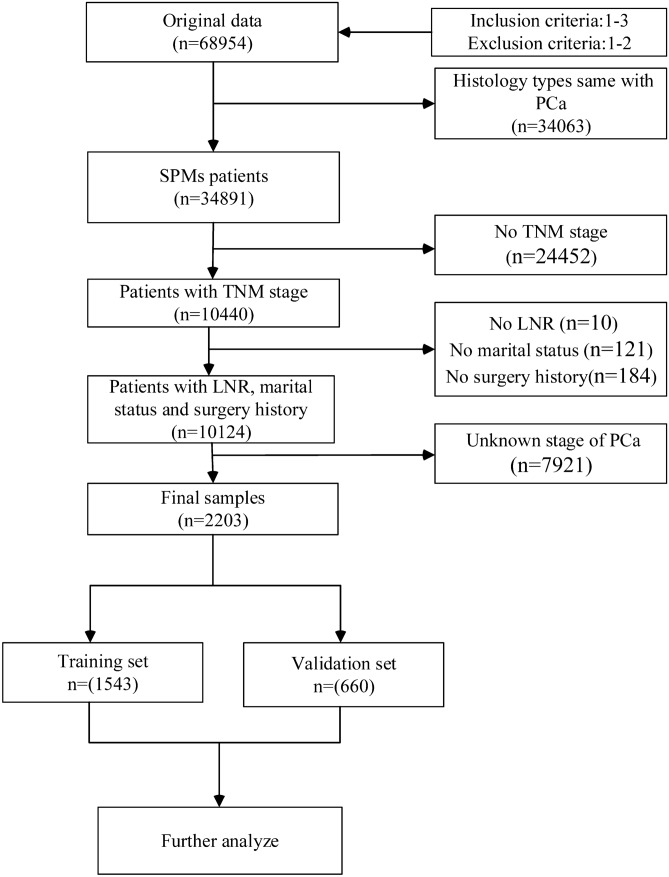
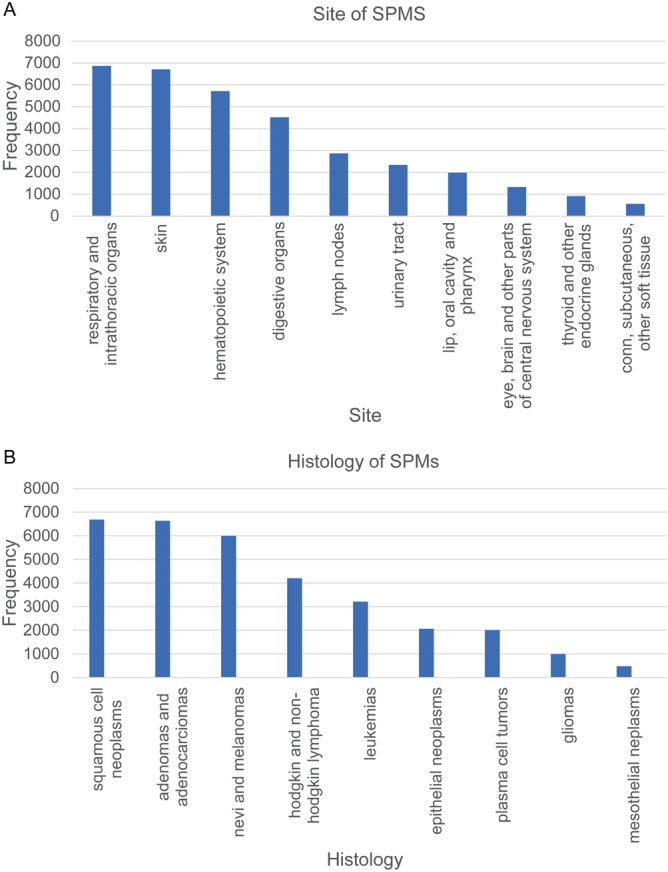
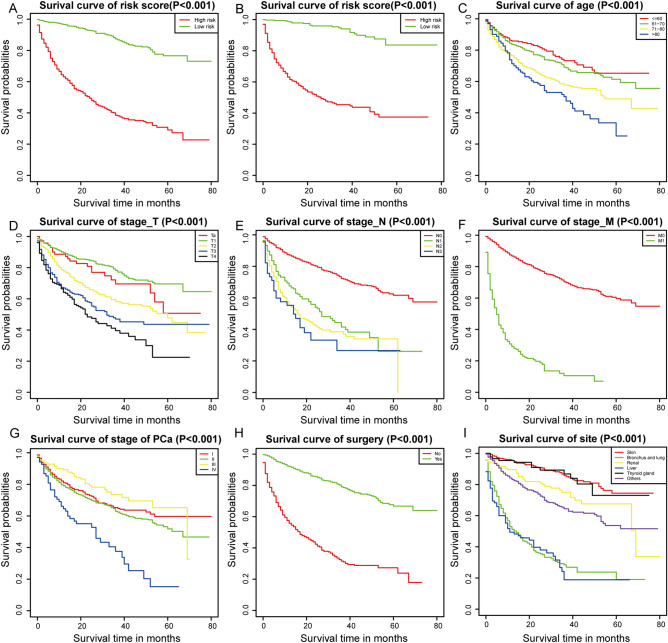
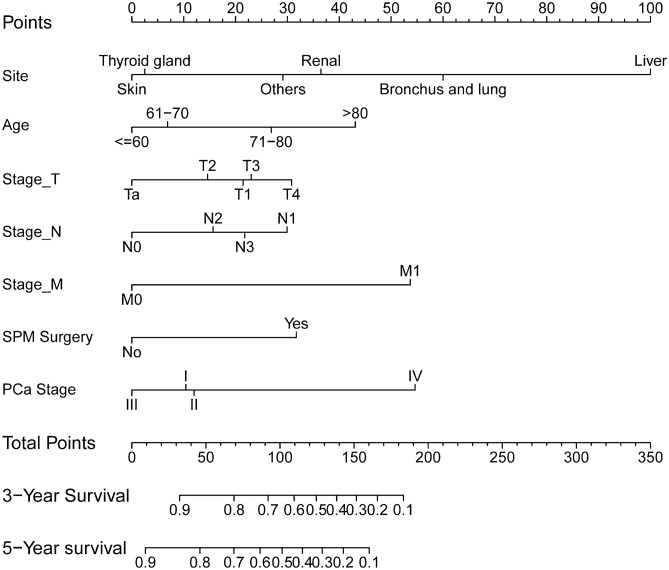
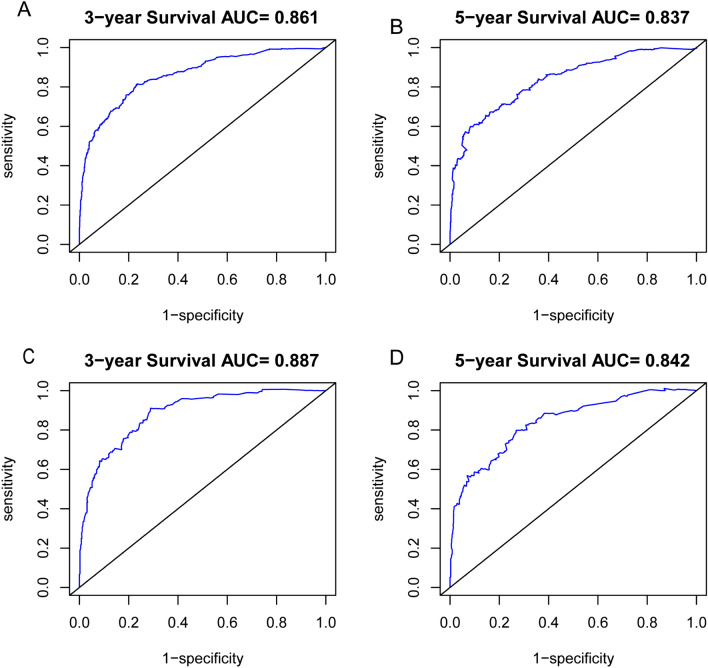
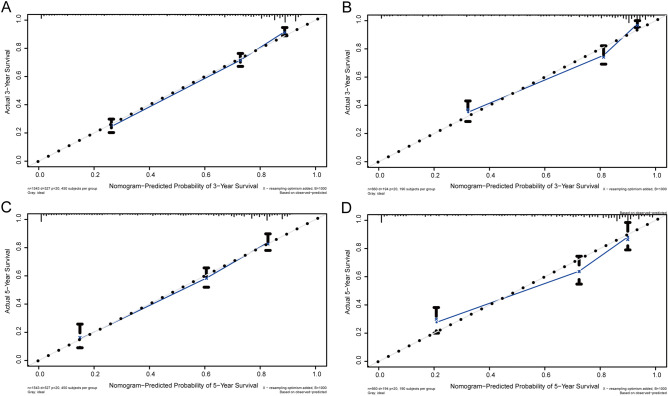
Prostate cancer (PCa) is the most prevalent cancer among males and the survival period of PCa has been significantly extended. However, the probability of suffering from second primary malignancies (SPMs) has also increased. Therefore, we downloaded SPM samples from the SEER database and then retrospectively analyzed the general characteristics of 34,891 PCa patients diagnosed between 2000 and 2016. After excluding cases with unknown clinical information, 2203 patients were used to construct and validate the overall survival (OS) nomogram of SPM patients after PCa. We found that approximately 3.69% of PCa patients were subsequently diagnosed with SPMs. In addition, the three most prevalent sites of SPM were respiratory and intrathoracic organs, skin, and hematopoietic system. The top three histological types of SPMs were squamous cell carcinoma, adenoma and adenocarcinoma, nevi and melanoma. Through univariate and multivariate Cox regression analysis, we found that the site of SPM, age, TNM stage, SPM surgery history, and PCa stage were associated with the OS of SPM. By virtue of these factors, we constructed a nomogram to predict the OS of SPM. The C-index in the training set and validation set were 0.824 (95CI, 0.806-0.842) and 0.862 (95CI, 0.840-0.884), respectively. Furthermore, we plotted the receiver operating characteristic curve (ROC) and the area under curve (AUC) which showed that our model performed well in assessing the 3-year (0.861 and 0.887) and 5-year (0.837 and 0.842) OS of SPMs in the training and validation set. In summary, we investigated the general characteristics of SPMs and constructed a nomogram to predict the prognosis of SPM following PCa.


Conflict of interest statement

The authors declare no competing interests.

Figures

Figure 1
Figure 1
Study flowchart showing the process of constructing nomogram to predict the overall survival (OS) of second primary malignancies (SPMs) after prostate cancer (PCa).
Figure 2
Figure 2
Features of second primary malignancies (SPMs) after prostate cancer (PCa). (A) Sites of SPMs that over than 1%, (B) Histology types of SPMs that more than 1%.
Figure 3
Figure 3
Kaplan–Meier analysis for overall survival (OS) of second primary malignancy (SPM) after prostate cancer (PCa) based on risk score in the training set (p < 0.001) (A) and the validation set (p < 0.001) (B), age (p < 0.001) (C), stage T (p < 0.001) (D), stage N (p < 0.001) (E), stage M (p < 0.001) (F), PCa stage (p < 0.001) (G), SPM surgery history (p < 0.001) (H), and site of SPMs (p < 0.001) (I).
Figure 4
Figure 4
Nomogram to predict 3- and 5-year survival for second primary malignancy (SPM) patients.
Figure 5
Figure 5
Receiver operating characteristic (ROC) analysis to assess 3-year (A) and 5-year (B) survival for second primary malignancy (SPM) patients in the training set; The ROC curve to assess 3-year (C) and 5-year (D) survival in the validation set.
Figure 6
Figure 6
The calibration curve to evaluate the 3-year (A) and 5-year (B) survival for second primary malignancy (SPM) patients in training set; The calibration curve to evaluate the 3-year (C) and 5-year (D) survival for SPMs patients in the validation set. Nomogram-predicted overall survival (OS) is plotted on the x-axis; actual OS is plotted on the y-axis. The imaginary line indicates a perfect calibration model in which the predicted probabilities are identical to the actual survival outcomes.

Similar articles

Cited by

References

    1. Miller KD, et al. Cancer treatment and survivorship statistics, 2019. CA Cancer J. Clin. 2019 doi: 10.3322/caac.21565. - DOI - PubMed
    1. Siegel RL, Miller KD, Jemal A. Cancer statistics, 2020. 2020;2020(70):7–30. doi: 10.3322/caac.21590. - DOI - PubMed
    1. Teo MY, Rathkopf DE, Kantoff P. Treatment of advanced prostate cancer. Annu. Rev. Med. 2019;70:479–499. doi: 10.1146/annurev-med-051517-011947. - DOI - PMC - PubMed
    1. Litwin MS, Tan HJ. The diagnosis and treatment of prostate cancer: a review. JAMA. 2017;317:2532–2542. doi: 10.1001/jama.2017.7248. - DOI - PubMed
    1. Mohiuddin JJ, Baker BR, Chen RC. Radiotherapy for high-risk prostate cancer. Nat. Rev. Urol. 2015;12:145–154. doi: 10.1038/nrurol.2015.25. - DOI - PubMed