. 2021 Jan 14;11(1):1462.
doi: 10.1038/s41598-021-81049-2.

Cannabis compounds exhibit anti-inflammatory activity in vitro in COVID-19-related inflammation in lung epithelial cells and pro-inflammatory activity in macrophages

Affiliations

Cannabis compounds exhibit anti-inflammatory activity in vitro in COVID-19-related inflammation in lung epithelial cells and pro-inflammatory activity in macrophages

Seegehalli M Anil et al. Sci Rep. .

Abstract

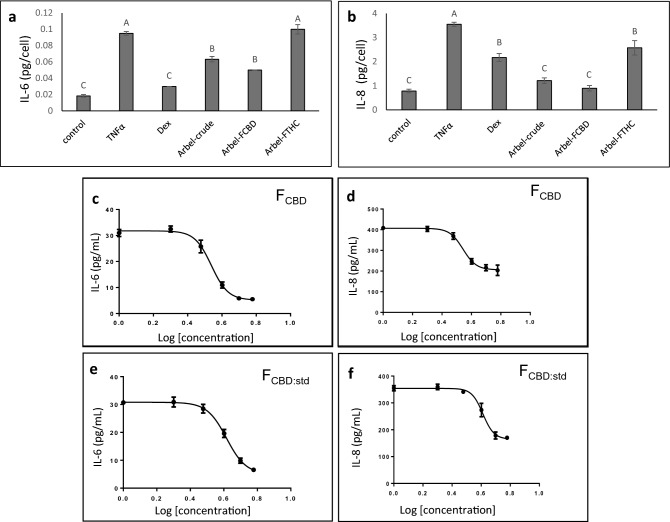
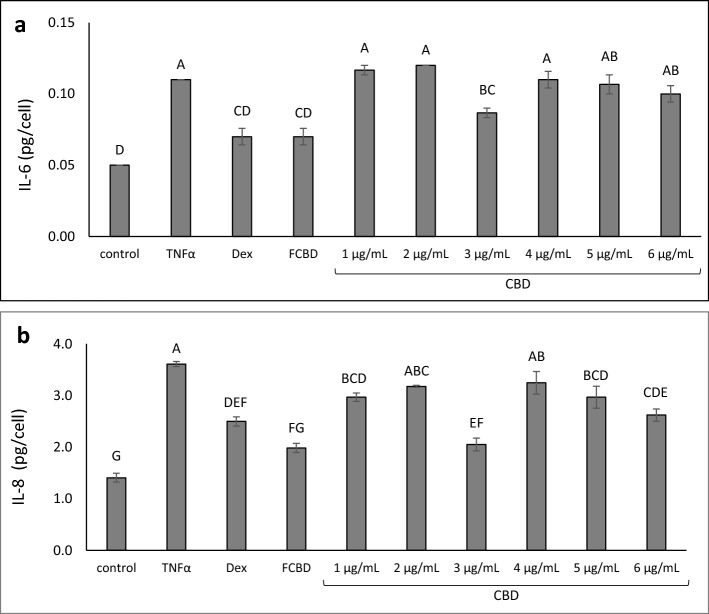
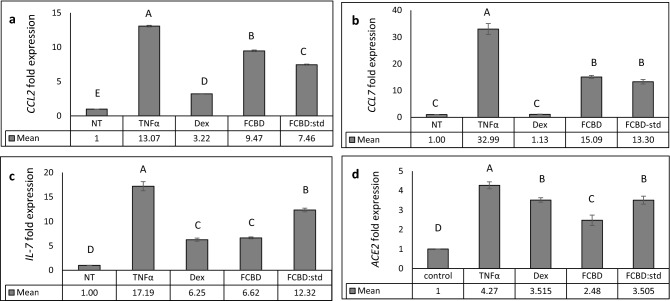
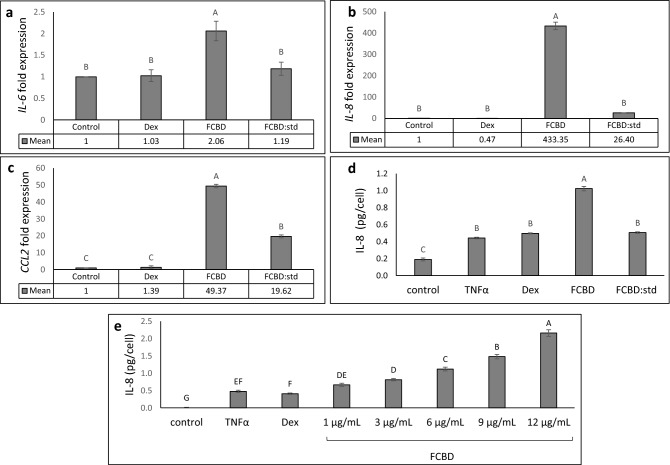
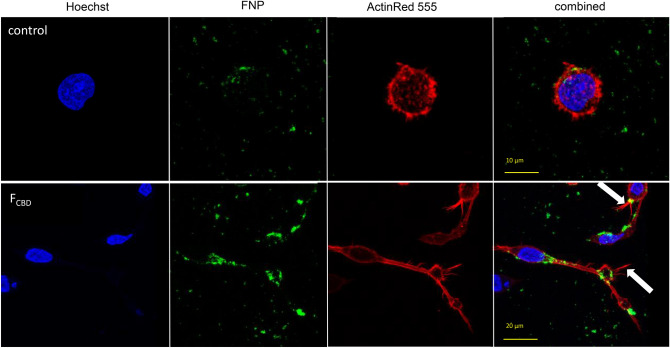
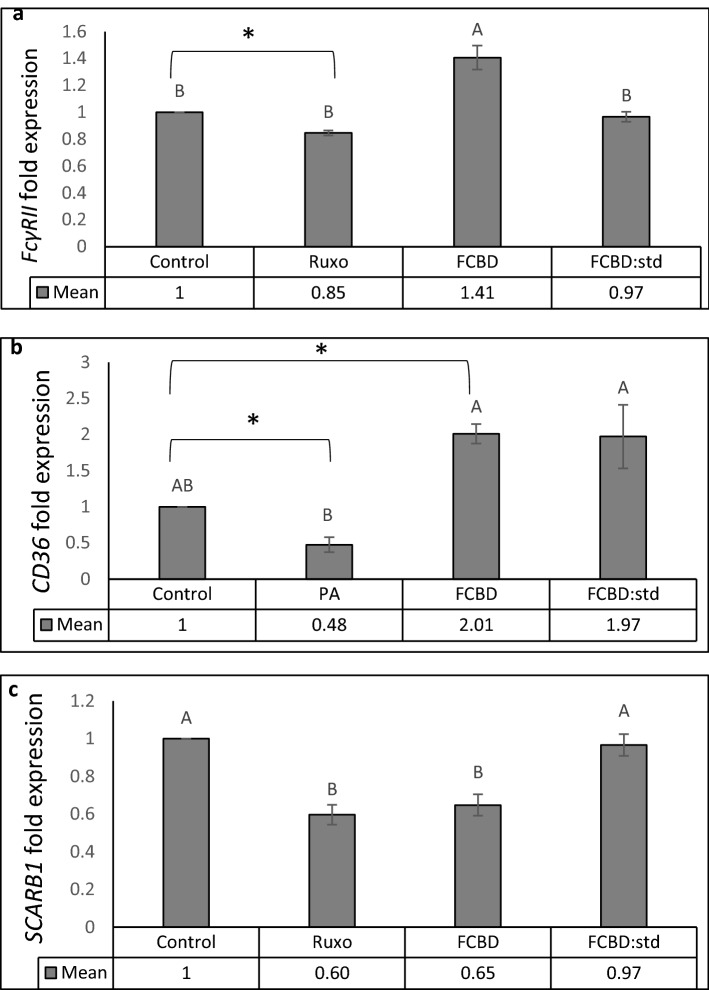
Cannabis sativa is widely used for medical purposes and has anti-inflammatory activity. This study intended to examine the anti-inflammatory activity of cannabis on immune response markers associated with coronavirus disease 2019 (COVID-19) inflammation. An extract fraction from C. sativa Arbel strain (FCBD) substantially reduced (dose dependently) interleukin (IL)-6 and -8 levels in an alveolar epithelial (A549) cell line. FCBD contained cannabidiol (CBD), cannabigerol (CBG) and tetrahydrocannabivarin (THCV), and multiple terpenes. Treatments with FCBD and a FCBD formulation using phytocannabinoid standards (FCBD:std) reduced IL-6, IL-8, C-C Motif Chemokine Ligands (CCLs) 2 and 7, and angiotensin I converting enzyme 2 (ACE2) expression in the A549 cell line. Treatment with FCBD induced macrophage (differentiated KG1 cell line) polarization and phagocytosis in vitro, and increased CD36 and type II receptor for the Fc region of IgG (FcγRII) expression. FCBD treatment also substantially increased IL-6 and IL-8 expression in macrophages. FCBD:std, while maintaining anti-inflammatory activity in alveolar epithelial cells, led to reduced phagocytosis and pro-inflammatory IL secretion in macrophages in comparison to FCBD. The phytocannabinoid formulation may show superior activity versus the cannabis-derived fraction for reduction of lung inflammation, yet there is a need of caution proposing cannabis as treatment for COVID-19.


Conflict of interest statement

The authors declare no competing interests.

Figures

Figure 1
Figure 1
The levels of (a) IL-6 and (b) IL-8 in A549 cells treated with C. sativa Arbel crude and FCBD and FTHC extract fractions. Cells were treated with 300 ng/mL TNFα and C. sativa extract and fractions at a concentration of 5 μg/mL for 4 h. Dexamethasone (Dex; 4 μg/mL) served as a positive control. Control (0.5% v/v methanol) treatment served as the solvent (vehicle) control; TNFα indicates TNFα+ solvent control treatment. Error bars indicate ± standard error (sem) (n = 3). Bars labeled with different letters are significantly different from all combinations of pairs by Tukey–Kramer honest significant difference test (HSD; P ≤ 0.05). Dose–effect curves of C. sativa FCBD on (c) IL-6 and (d) IL-8 levels in the A549 cell line. Dose–effect curves of FCBD:std (93.5% CBD+ 6.1% CBG+ 0.4% THCV) on (e) IL-6 and (f) IL-8 levels in the A549 cell line. GraphPad Prism version 6.1 was used to produce the dose–response curve and IC50 doses. Error bars indicate ± sem (n = 3).
Figure 2
Figure 2
The level of (a) IL-6 and (b) IL-8 in A549 cells treated with FCBD and CBD. Cells were treated with 300 ng/mL TNFα, 4.1 μg/mL FCBD (FCBD) and CBD at different concentrations for 4 h. Dexamethasone (Dex; 4 μg/mL) served as a positive control. Control (0.6% v/v methanol) treatment served as the solvent (vehicle) control; TNFα is TNFα+ solvent control treatment. Error bars indicate ± sem (n = 3). Bars labeled with different letters are significantly different from all combinations of pairs according to the Tukey–Kramer HSD test (P ≤ 0.05).
Figure 3
Figure 3
Levels of (a) IL-6 and (b) IL-8 in A549 cells treated with FCBD or FCBD:std with or without CB1 or CB2 inverse agonists (IA), TRPA1 blocker, or TRPV1 or TRPV2 antagonists. Cells were treated with 300 ng/mL TNFα and FCBD (FCBD) and FCBD:std (FCBD:std) at a concentration of 3.4 and 4.1 μg/mL, respectively, in the presence or absence of IA of CB1 (5 µM) or CB2 (5 and 7.5 µM for IL-6 and IL-8, respectively), a TRPA1 blocker (10 µM), or TRPV1 or TRPV2 antagonists (10 µM) for 4 h. Dexamethasone (Dex) served as a positive control at 4 µg/mL. Control (0.4% v/v methanol + 2% v/v dimethyl sulfoxide [DMSO]) treatment served as the solvent (vehicle) control; TNFα is TNFα+ solvent control treatment. Error bars indicate ± sem (n = 3). Bars labeled with different letters are significantly different from all combinations of pairs according to the Tukey–Kramer HSD test (P ≤ 0.05).
Figure 4
Figure 4
qPCR-based determination of the mRNA steady state level in A549 cell line of (a) CCL2, (b) CCL7, (c) IL-7 or (d) ACE2 genes, after treatment with TNFα (300 µg/mL), FCBD (FCBD; 7 µg/mL) or FCBD:std (FCBD:std; 7 µg/mL), or Dexamethasone (Dex; 4 µg/mL)—for 6 h relative to the control. Control (0.7% v/v methanol) treatment served as the solvent (vehicle) control; TNFα indicates TNFα+ solvent control treatment. Error bars indicate ± sem (n = 3). Bars labeled with different letters are significantly different from all combinations of pairs according to the Tukey–Kramer HSD test (HSD; P ≤ 0.05).
Figure 5
Figure 5
qPCR-based determination of the mRNA steady state level in the differentiated KG1 cell line of (a) IL-6, (b) IL-8 or (c) CCL2 after treatment with TNFα (300 µg/mL), FCBD (FCBD) at 7 µg/mL, FCBD:std (FCBD:std) at 7 µg/mL and dexamethasone (Dex) at 8 µg/mL for 6 h relative to control. Control (0.7% v/v methanol) treatment served as the solvent (vehicle) control. (d) IL-8 levels in KG1 cells treated with FCBD and FCBD-std. Cells were treated with 300 ng/mL TNFα (and not by PMA), FCBD (FCBD) or FCBD:std (FCBD:std) at 10 μg/mL for 6 h. Dexamethasone (Dex; 4 μg/mL) served as a positive control. Control (1% v/v methanol) treatment served as the solvent (vehicle) control; TNFα is TNFα+ solvent control treatment. (e) IL-8 levels in KG1 cells treated with FCBD. Cells were treated with 300 ng/mL TNFα (and not by PMA) and FCBD at different concentrations for 6 h. Dexamethasone (Dex; 4 μg/mL) served as a positive control. Control (1.2% v/v methanol) treatment served as the solvent (vehicle) control; TNFα indicates TNFα+ solvent control treatment. Error bars indicate ± sem (n = 3). Bars with different letters are significantly different from all combinations of pairs according to the Tukey–Kramer HSD test (P ≤ 0.05).
Figure 6
Figure 6
Representative examples of confocal images of macrophages following treatment with the control and FCBD (7 µg/mL). Control (0.7% v/v methanol) treatment served as the solvent (vehicle) control. Cell were stained for F-actin (EasyProbes™ ActinRed 555 Stain, red stain), and nuclei (Hoechst, blue stain); n = 5, in each biological replicate multiple cells were examined (see Table 2). Membrane filopodia-like structures are marked with white arrows. FNP, fluorescent-labeled silica 50–100 nm particles.
Figure 7
Figure 7
qPCR-based determination of the mRNA steady state level in the differentiated KG1 cell line. (a) FcγRII, (b) CD36 or (c) SCARB1 genes, after treatment with FCBD (FCBD) at 7 µg/mL, FCBD:std (FCBD:std) at 7 µg/mL, ruxolitinib (Ruxo) at 100 µg/mL or palmitic acid (PA) at 150 µM. In this experiment, controls (vehicle) for (a) and (c) were 0.7% v/v methanol + 2% v/v DMSO; for (b) 0.7% v/v methanol. Error bars indicate ± sem (n = 3). Bars labeled with different letters are significantly different from all combinations of pairs according to the Tukey–Kramer HSD test (P ≤ 0.05). *Indicates significantly different mean from the control based on the Student T-test (P ≤ 0.05).

Similar articles

Cited by

References

    1. Mehta P, et al. COVID-19: Consider cytokine storm syndromes and immunosuppression. Lancet. 2020;395:1033. doi: 10.1016/S0140-6736(20)30628-0. - DOI - PMC - PubMed
    1. Shi Y, et al. COVID-19 infection: The perspectives on immune responses. Cell Death Differ. 2020;27:1451–1454. doi: 10.1038/s41418-020-0530-3. - DOI - PMC - PubMed
    1. Ruscitti P, Berardicurti O, Iagnocco A, Giacomelli R. Cytokine storm syndrome in severe COVID-19. Autoimmun. Rev. 2020;19:102562. doi: 10.1016/j.autrev.2020.102562. - DOI - PMC - PubMed
    1. Gao Y, et al. Diagnostic utility of clinical laboratory data determinations for patients with the severe COVID-19. J. Med. Virol. 2020;92:791–796. doi: 10.1002/jmv.25770. - DOI - PMC - PubMed
    1. Hanuš LO, Meyer SM, Muñoz E, Taglialatela-Scafati O, Appendino G. Phytocannabinoids: A unified critical inventory. Nat. Prod. Rep. 2016;33:1357–1392. doi: 10.1039/C6NP00074F. - DOI - PubMed

MeSH terms