Clinical Trial
. 2021 Jan 14;11(1):1429.
doi: 10.1038/s41598-020-80734-y.

Infant circulating MicroRNAs as biomarkers of effect in fetal alcohol spectrum disorders

Affiliations
Clinical Trial

Infant circulating MicroRNAs as biomarkers of effect in fetal alcohol spectrum disorders

Amanda H Mahnke et al. Sci Rep. .

Abstract

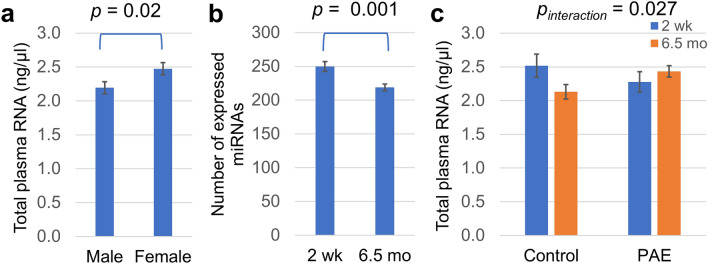
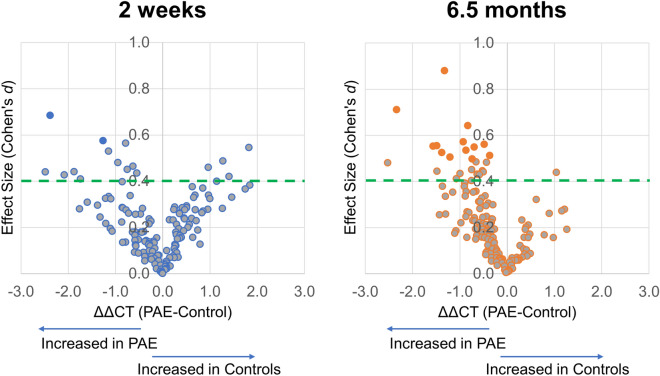
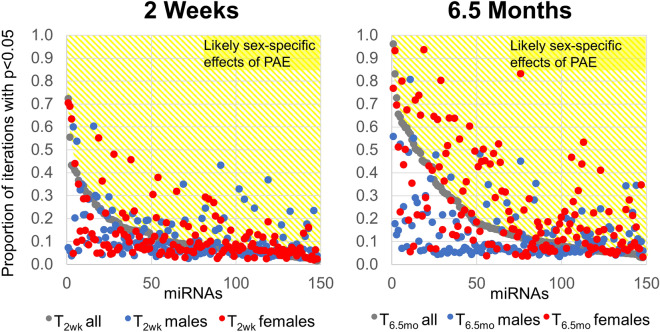
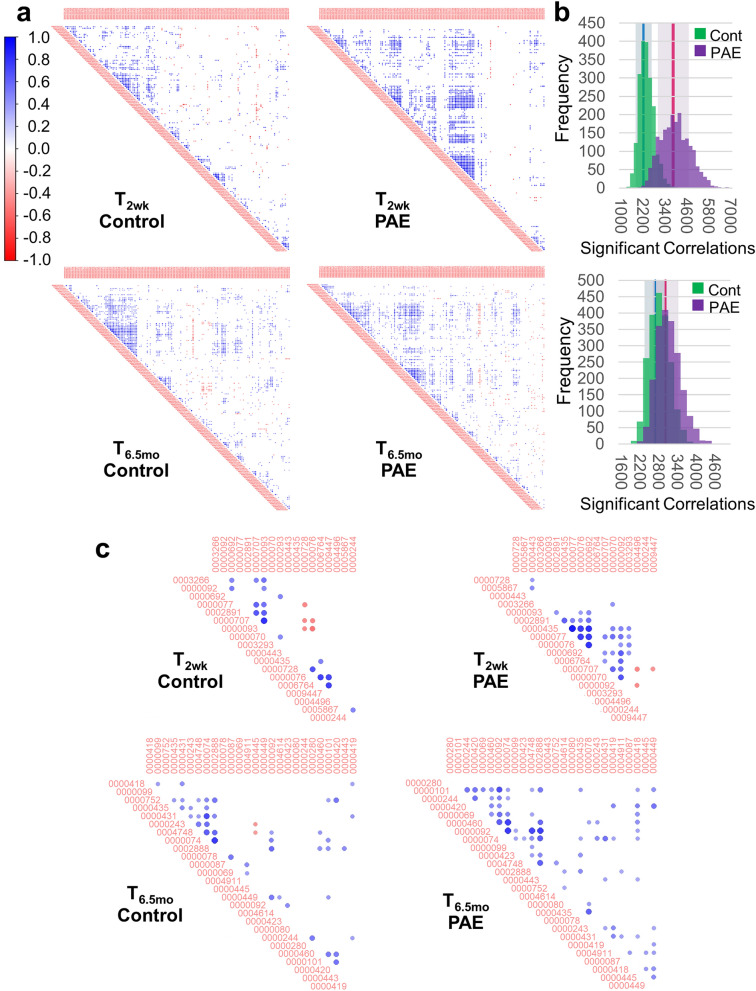
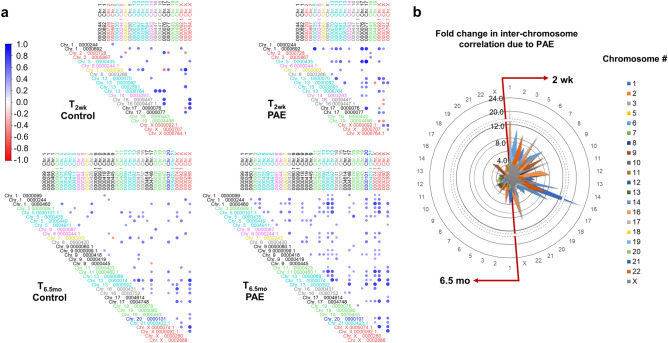
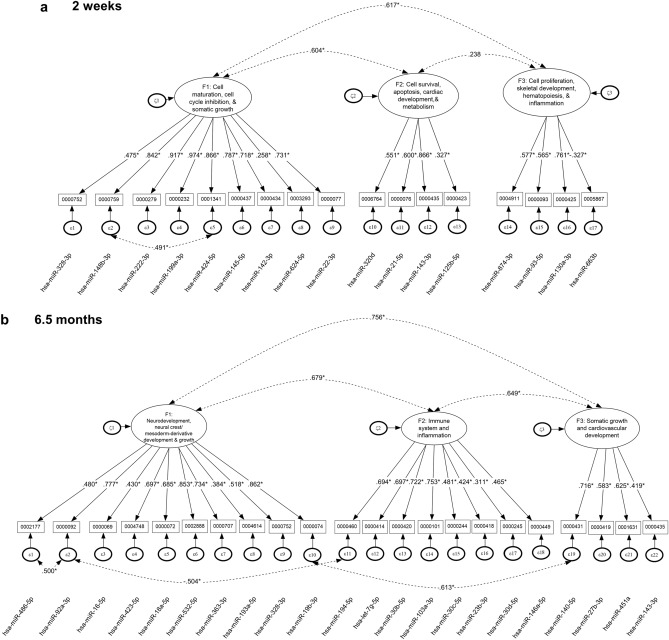
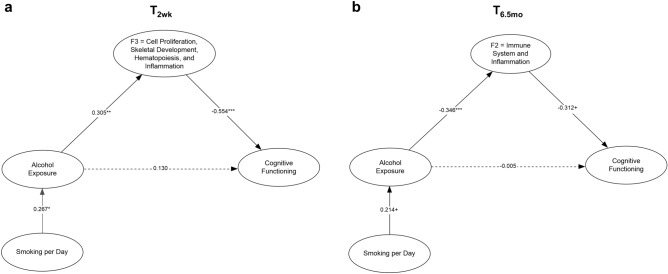
Prenatal alcohol exposure (PAE) can result in cognitive and behavioral disabilities and growth deficits. Because alcohol-related neurobehavioral deficits may occur in the absence of overt dysmorphic features or growth deficits, there is a need to identify biomarkers of PAE that can predict neurobehavioral impairment. In this study, we assessed infant plasma extracellular, circulating miRNAs (exmiRNAs) obtained from a heavily exposed Cape Town cohort to determine whether these can be used to predict PAE-related growth restriction and cognitive impairment. PAE, controlling for smoking as a covariate, altered 27% of expressed exmiRNAs with clinically-relevant effect sizes (Cohen's d ≥ 0.4). Moreover, at 2 weeks, PAE increased correlated expression of exmiRNAs across chromosomes, suggesting potential co-regulation. In confirmatory factor analysis, the variance in expression for PAE-altered exmiRNAs at 2 weeks and 6.5 months was best described by three-factor models. Pathway analysis found that factors at 2 weeks were associated with (F1) cell maturation, cell cycle inhibition, and somatic growth, (F2) cell survival, apoptosis, cardiac development, and metabolism, and (F3) cell proliferation, skeletal development, hematopoiesis, and inflammation, and at 6.5 months with (F1) neurodevelopment, neural crest/mesoderm-derivative development and growth, (F2) immune system and inflammation, and (F3) somatic growth and cardiovascular development. Factors F3 at 2 weeks and F2 at 6.5 months partially mediated PAE-induced growth deficits, and factor F3 at 2 weeks partially mediated effects of PAE on infant recognition memory at 6.5 months. These findings indicate that infant exmiRNAs can help identify infants who will exhibit PAE-related deficits in growth and cognition.


Conflict of interest statement

The authors declare no competing interests.

Figures

Figure 1
Figure 1
RNA and miRNA content in infant plasma samples. (a) Female and male assessed plasma RNA content, determined by multiplying isolated RNA concentration by total plasma volume. (b) The total number of expressed plasma miRNAs, i.e., miRNAs with detected CT, at T2wk and T6.5mo. (c) Association between plasma RNA concentration, PAE status, and infant age. For (a) and (b), t-test p-values are shown. For (c), the p-value shown is for the interaction between age and exposure group resulting from a two-way ANOVA.
Figure 2
Figure 2
PAE-altered exmiRNAs in infant plasma. Volcano plots of relative expression of exmiRNAs (ΔΔCT, ΔCTPAE—ΔCTcontrol) and effect size (Cohen’s d) at T2wk (left) andT6.5mo (right). Dashed green line denotes a clinically relevant, moderate effect size of 0.40. Orange and blue filled points denote exmiRNAs with significant effect sizes (95% confidence interval does not contain zero).
Figure 3
Figure 3
Sexually dimorphic changes in exmiRNAs in response to PAE. Bootstrap resampling of exmiRNA expression at T2wk (left) and T6.5mo (right). The population including both male and female samples (gray) was resampled 2000 times with replacement and the proportion of significant p-values (ANCOVA with cigarettes/day as a covariate) across the iterations is shown. The population was then resampled with only male (blue) or only female (red) infants. exmiRNAs that were more likely to be significantly altered when examined in a single sex than in the combined population are in the yellow region and are likely to be altered in a sex-specific manner in response to PAE.
Figure 4
Figure 4
exmiRNAs are highly correlated in PAE infants at T2wk. (a) Hierarchically clustered correlation plots of significant (p < 0.05) exmiRNA cross correlations. (b) Bootstrap resampling to assess the stability of the number of correlations at T2wk (top)and T6.5mo (bottom). The standard deviation of each distribution are shown by the shaded regions and 99% confidence intervals are shown by the blue (control) and pink (PAE) regions. (c) Hierarchically clustered correlation plots of significant (p < 0.05) exmiRNA cross correlations for exmiRNAs with an effect size ≥ 0.40. Figures (a) and (c) were constructed using the corrplot package (version 0.77, https://cran.r-project.org/web/packages/corrplot/index.html) for R (version 3.6.1) and figure (b) was constructed using Excel.
Figure 5
Figure 5
Coordinated expression of exmiRNAs across chromosomes. (a) Cross correlation of exmiRNA expression, arranged by chromosomal location, at T2wk and T6.5mo for exmiRNAs with an effect size ≥ 0.40. Individual miRNAs are denoted with MIMAT number and chromosomal location, with “.1” indicative of a chromosomal duplication of the primary miRNA. For corresponding miRNA names, see Table 2. (b) From the full correlation matrices (see Supplementary Fig. S3), we assessed the fold-change difference in the number of significant correlations between chromosomes per number of expressed exmiRNA on each chromosome. Radar plot shows the enrichment of inter-chromosomal correlation in PAE infants compared to control infants at T2wk (right) and T6.5mo (left). Figure (a) was constructed using the corrplot package (version 0.77, https://cran.r-project.org/web/packages/corrplot/index.html) for R (version 3.6.1) and figure (b) was constructed using Excel.
Figure 6
Figure 6
Confirmatory factor analysis clustered PAE-sensitive exmiRNAs into factors associated with distinct developmental pathways. Structural equation modeling of exmiRNA loading into the 3-factor solutions at (a) T2wk and (b) T6.5mo. Factors are named based on IPA analysis of the canonical pathways and disease and biofunctions for the mRNAs targeted by the miRNAs within each factor (see Supplementary Fig. 6, 8). Figures were constructed using Inspiration (version 9.2.4).
Figure 7
Figure 7
Mediational model predicting cognitive function. Cognitive function (measured by FTII visual recognition memory at 6.5 months) mediation from the direct effect of alcohol exposure and the indirect effect of alcohol exposure mediated by the exmiRNA factors at (a) T2wk and (b) T6.5mo and adjusted for maternal smoking during pregnancy. Model included all three miRNA factors with residual correlations between them. For T2wk, figure displays only F3, for which significant mediation was found. The indirect effect of alcohol exposure on cognitive functioning through F3 was significant (b = − 0.169, p = 0.032). The factors for which significant mediation was not evident (F1 and F2) are omitted from the figure for clarity. For T6.5mo, figure displays only F2, for which the mediational effect fell short of conventional levels of statistical significance (b = 0.108, p = 0.109), but using a one-tailed test mediation is evident. The factors for which significant mediation was not evident (F1 and F3) are omitted from the figure for clarity. p < 0.10; *p < 0.05; **p < 0.01; ***p < 0.001. ). Figures were constructed using Inspiration (version 9.2.4).

Similar articles

Cited by

References

    1. ACOG. Committee opinion no. 496: At-risk drinking and alcohol dependence: obstetric and gynecologic implications. Obstetrics Gynecol.118, 383–388, doi:10.1097/AOG.0b013e31822c9906 (2011). - PubMed
    1. Warren KR, et al. Fetal alcohol syndrome: an international perspective. Alcohol Clin. Exp. Res. 2001;25:202S–206S. doi: 10.1111/j.1530-0277.2001.tb02397.x. - DOI - PubMed
    1. 3SAMHSA. Vol. NSDUH Series H38A (Office of Applied Studies, 2010).
    1. Popova S, Lange S, Probst C, Gmel G, Rehm J. Estimation of national, regional, and global prevalence of alcohol use during pregnancy and fetal alcohol syndrome: a systematic review and meta-analysis. Lancet Glob. Health. 2017;5:e290–e299. doi: 10.1016/S2214-109X(17)30021-9. - DOI - PubMed
    1. SAMHSA. The NSDUH Report: 18 percent of pregnant women drink alcohol during early pregnancy. NSDUH Report (2013).

Publication types