. 2021 Jan 14;11(1):1413.
doi: 10.1038/s41598-020-80722-2.

Potential repurposing of four FDA approved compounds with antiplasmodial activity identified through proteome scale computational drug discovery and in vitro assay

Affiliations

Potential repurposing of four FDA approved compounds with antiplasmodial activity identified through proteome scale computational drug discovery and in vitro assay

Bakary N'tji Diallo et al. Sci Rep. .

Abstract

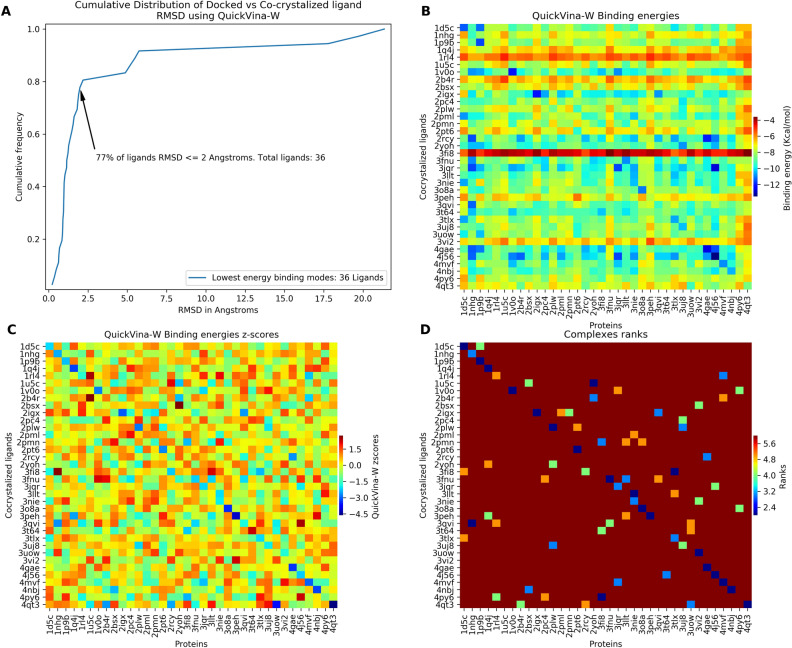
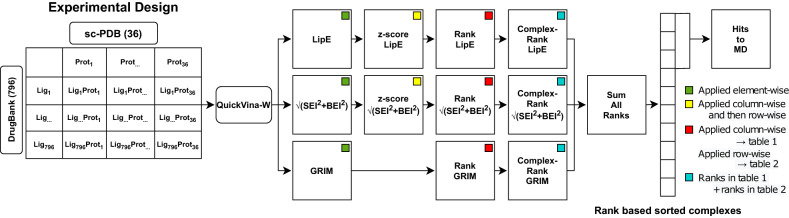
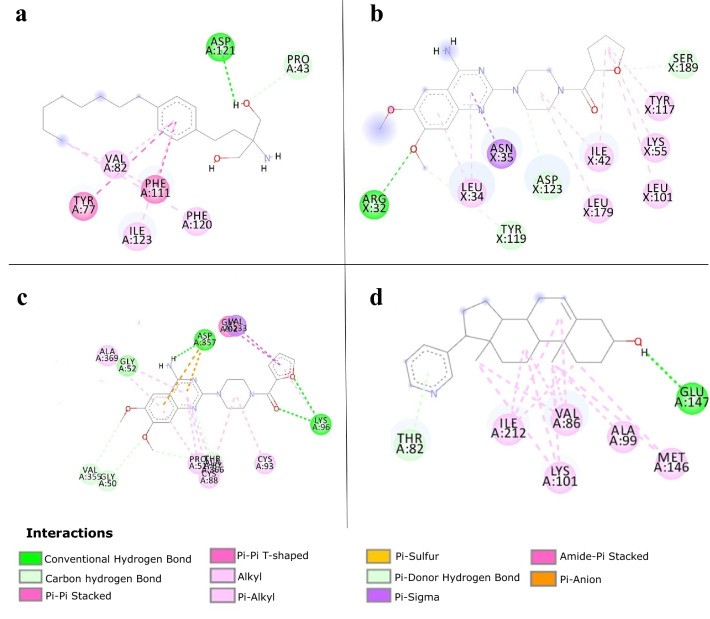
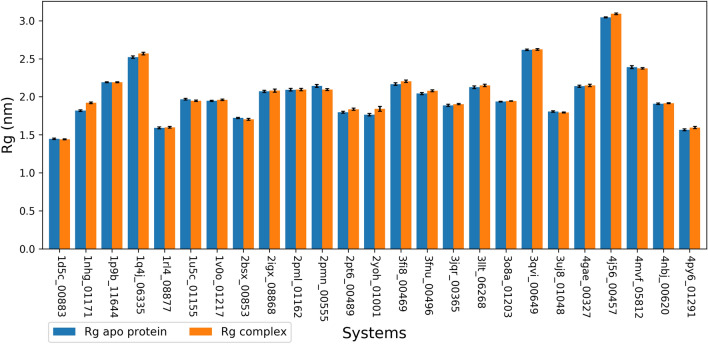
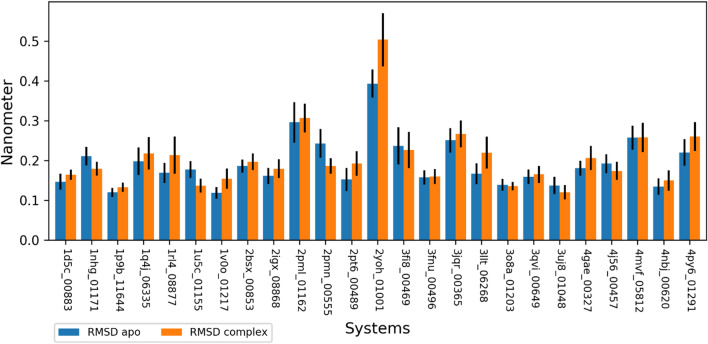
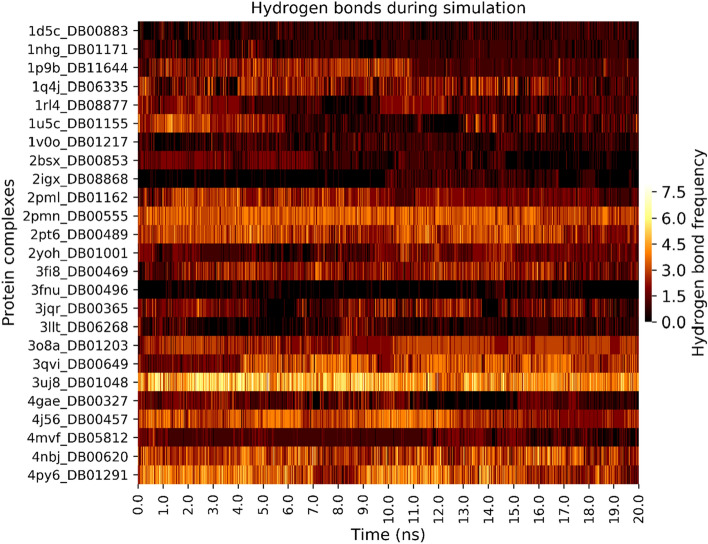
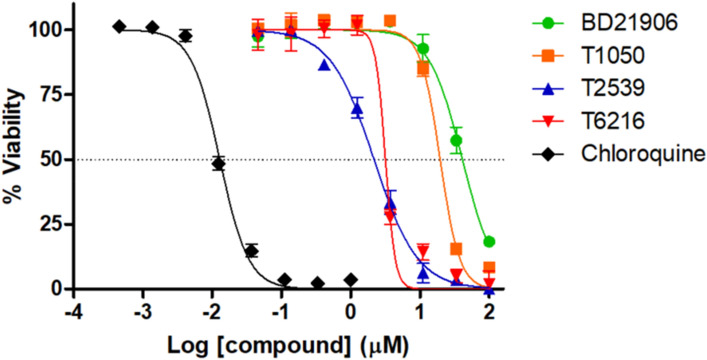
Malaria elimination can benefit from time and cost-efficient approaches for antimalarials such as drug repurposing. In this work, 796 DrugBank compounds were screened against 36 Plasmodium falciparum targets using QuickVina-W. Hits were selected after rescoring using GRaph Interaction Matching (GRIM) and ligand efficiency metrics: surface efficiency index (SEI), binding efficiency index (BEI) and lipophilic efficiency (LipE). They were further evaluated in Molecular dynamics (MD). Twenty-five protein-ligand complexes were finally retained from the 28,656 (36 × 796) dockings. Hit GRIM scores (0.58 to 0.78) showed their molecular interaction similarity to co-crystallized ligands. Minimum LipE (3), SEI (23) and BEI (7) were in at least acceptable thresholds for hits. Binding energies ranged from -6 to -11 kcal/mol. Ligands showed stability in MD simulation with good hydrogen bonding and favorable protein-ligand interactions energy (the poorest being -140.12 kcal/mol). In vitro testing showed 4 active compounds with two having IC50 values in the single-digit μM range.


Conflict of interest statement

The authors declare no competing interests.

Figures

Figure 1
Figure 1
Docking validation and scores transformations. (A) The cumulative distribution of the RMSD (docked vs co-crystallized poses of the ligands). (B) Raw binding energies. (C) Standardized values; (D) Rank transformed values (only complexes with a rank value ≤ 6 are shown for clarity. On the heatmaps, rows (ligands) and columns (proteins) are alphabetically ordered. Heatmaps were generated using Seaborn version 0.9.
Figure 2
Figure 2
Virtual screening workflow. Square boxes represent tables of protein–ligand systems as described in the experimental design. Values in the table are given by the metric in the box center. Colors code the type of operation applied on each table.
Figure 3
Figure 3
2D plot of intermolecular interactions depicted using Discovery Studio Visualizer 2017 R2. (A) Fingolimod and Plasmepsin 2, (B) Terazosin PfPK7 and (C) Prazosin and PfTrxR (D) Abiraterone and PfCDPK2. Dashed lines represent the different interactions and their color the interaction type. Colored circles represent residues with their three letter code, chain identifier and residue number.
Figure 4
Figure 4
Calculated mean of Rg of the backbone atoms for apo and complexes during the 20 ns simulation. Protein–Ligand systems are represented by their PDB IDs and DrugBank IDs (last five digits). Error bars represent the standard deviation of the means (σ). Color code: orange: complexes; blue: apo proteins.
Figure 5
Figure 5
Mean of RMSD of backbone atoms after a least-squares fit to the initial structure for apo proteins and complexes during the 20 ns simulation. Protein–Ligand systems are represented by their PDB IDs and DrugBank IDs (last five digits). Error bars represent the standard deviation of the means (σ). Color code: orange: complexes; blue: apo proteins.
Figure 6
Figure 6
Hydrogen bonds between the protein and the ligand during the 20 ns simulation. Complexes are represented on the y-axis with the PDB ID and DrugBank IDs. The heatmap was generated using Seaborn version 0.9.
Figure 7
Figure 7
Antiplasmodial dose–response plots. P. falciparum viability percentage was plotted against the Log (compound concentration). The IC50 (50% inhibitory concentration) was obtained from the curve by non-linear regression. The black curve represents the positive control chloroquine. Compounds were tested in triplicate with the standard deviation (SD) indicated by the error bars. Curves for BD21906, T1050, T2539, T6216 correspond to the following compounds terazosin (DB01162), prazosin (DB00457), fingolimod (DB08868) and abiraterone (DB05812) respectively.

References

    1. World Health Organization. WHO Malaria report 2019. Malaria report 2019https://www.who.int/publications-detail/world-malaria-report-2019 (2019).
    1. Lunev, S., Batista, F. A., Bosch, S. S., Wrenger, C. & Groves, M. R. Identification and Validation of Novel Drug Targets for the Treatment of Plasmodium falciparum Malaria: New Insights. Current Topics in Malaria (InTech, 2016). 10.5772/65659.
    1. Hemingway J, et al. Tools and strategies for malaria control and elimination: what do we need to achieve a grand convergence in Malaria? PLoS Biol. 2016;14:e1002380. doi: 10.1371/journal.pbio.1002380. - DOI - PMC - PubMed
    1. Ma D-L, Chan DS-H, Leung C-H. Drug repositioning by structure-based virtual screening. Chem. Soc. Rev. 2013;42:2130. doi: 10.1039/c2cs35357a. - DOI - PubMed
    1. Vora P, Somani R, Jain M. Drug repositioning: an approach for drug discovery. Mini. Rev. Org. Chem. 2016;13:363–376. doi: 10.2174/1570193X13666160728121823. - DOI

Publication types

MeSH terms