

Simulating SARS-CoV-2 epidemics by region-specific variables and modeling contact tracing app containment
- PMID: 33446891
- PMCID: PMC7809354
- DOI: 10.1038/s41746-020-00374-4
Simulating SARS-CoV-2 epidemics by region-specific variables and modeling contact tracing app containment
Abstract
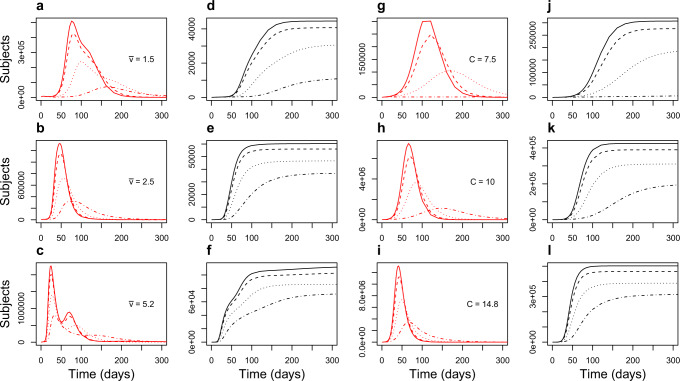
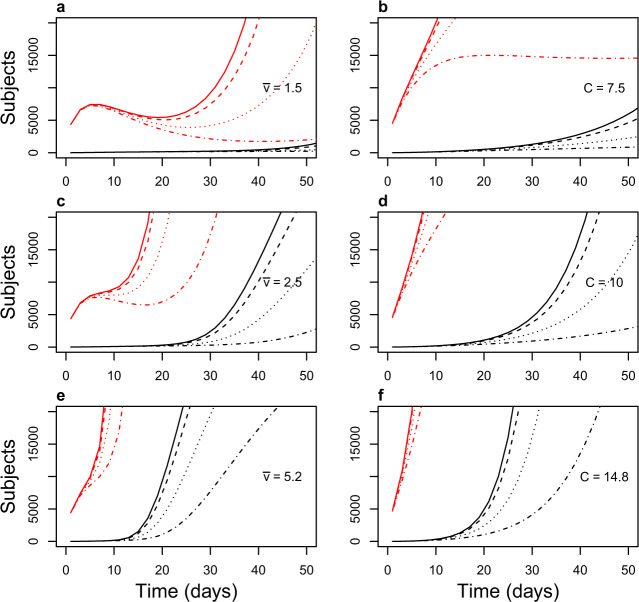
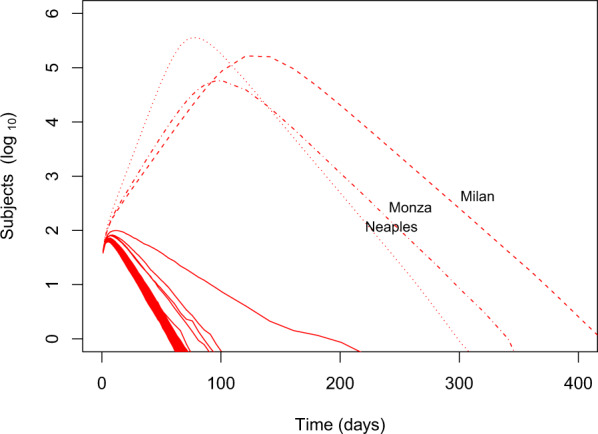
Targeted contact-tracing through mobile phone apps has been proposed as an instrument to help contain the spread of COVID-19 and manage the lifting of nation-wide lock-downs currently in place in USA and Europe. However, there is an ongoing debate on its potential efficacy, especially in light of region-specific demographics. We built an expanded SIR model of COVID-19 epidemics that accounts for region-specific population densities, and we used it to test the impact of a contact-tracing app in a number of scenarios. Using demographic and mobility data from Italy and Spain, we used the model to simulate scenarios that vary in baseline contact rates, population densities, and fraction of app users in the population. Our results show that, in support of efficient isolation of symptomatic cases, app-mediated contact-tracing can successfully mitigate the epidemic even with a relatively small fraction of users, and even suppress altogether with a larger fraction of users. However, when regional differences in population density are taken into consideration, the epidemic can be significantly harder to contain in higher density areas, highlighting potential limitations of this intervention in specific contexts. This work corroborates previous results in favor of app-mediated contact-tracing as mitigation measure for COVID-19, and draws attention on the importance of region-specific demographic and mobility factors to achieve maximum efficacy in containment policies.
Conflict of interest statement
E.S. works for Bayer, is collaborating to COVID Safe Paths app, by MIT, and advising LEMONADE tracing app, by Nuland. A.S.C. works for Roche Pharma. M.T.F is consultant for Ely Lilly. The other authors declare no competing interests.
Figures
References
-
- Ahmed N, et al. A survey of COVID-19 contact tracing apps. IEEE Access. 2020;8:134577–134601. doi: 10.1109/ACCESS.2020.3010226. - DOI
Grants and funding
- 825070/EC | Horizon 2020 Framework Programme (EU Framework Programme for Research and Innovation H2020)
- 825070/EC | Horizon 2020 Framework Programme (EU Framework Programme for Research and Innovation H2020)
- 825070/EC | Horizon 2020 Framework Programme (EU Framework Programme for Research and Innovation H2020)
LinkOut - more resources
Full Text Sources
Other Literature Sources
Miscellaneous
