. 2020 Dec 29:11:594087.
doi: 10.3389/fphar.2020.594087. eCollection 2020.

Molecular Biomarkers of Neovascular Age-Related Macular Degeneration With Incomplete Response to Anti-Vascular Endothelial Growth Factor Treatment

Affiliations

Molecular Biomarkers of Neovascular Age-Related Macular Degeneration With Incomplete Response to Anti-Vascular Endothelial Growth Factor Treatment

Irmela Mantel et al. Front Pharmacol. .

Abstract

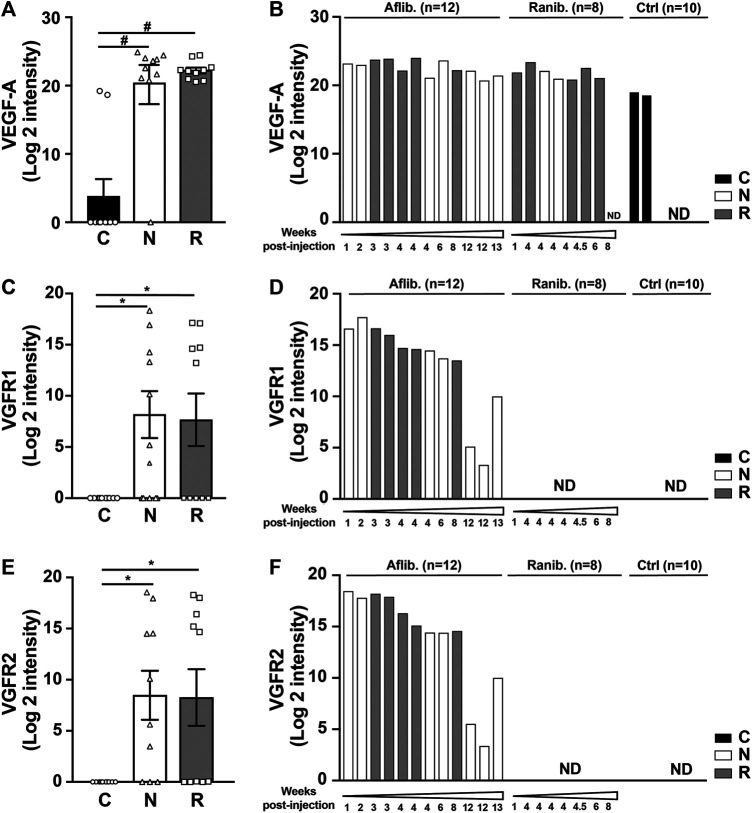
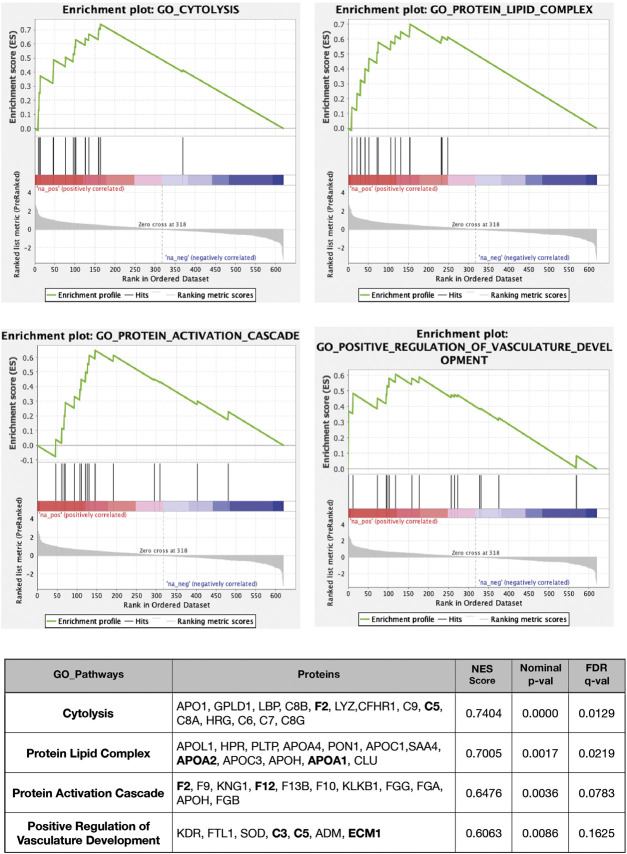
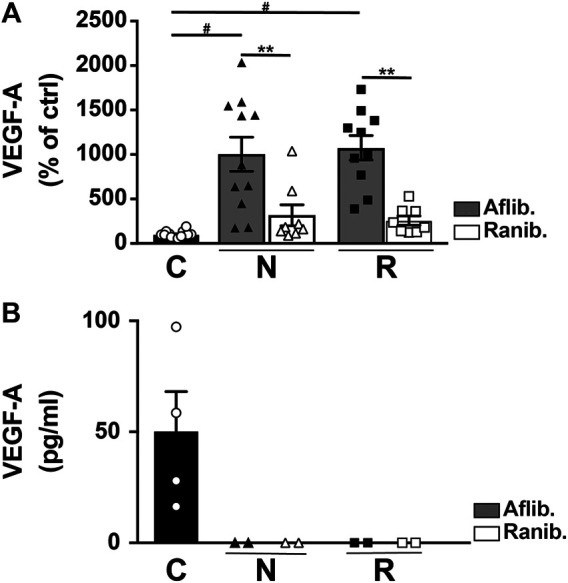
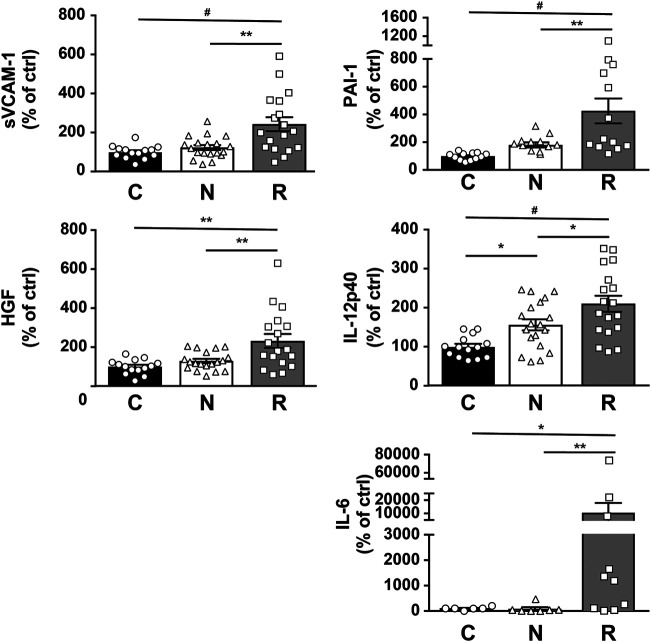
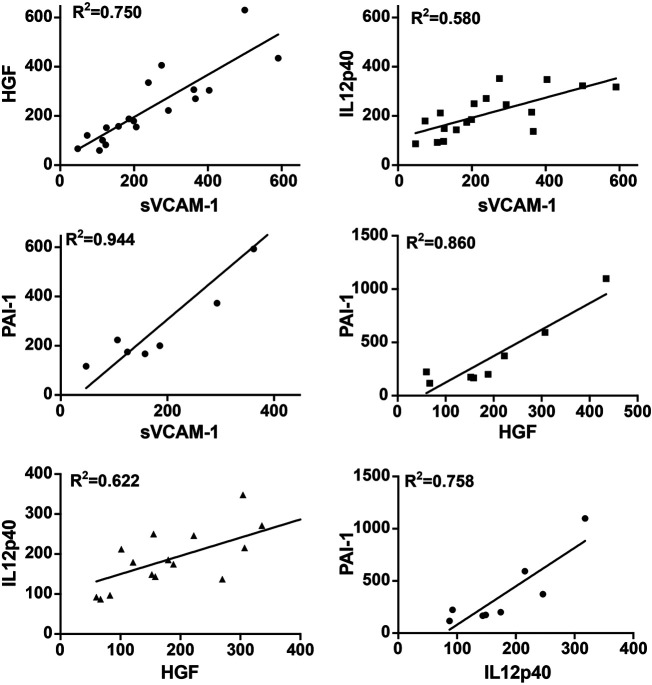
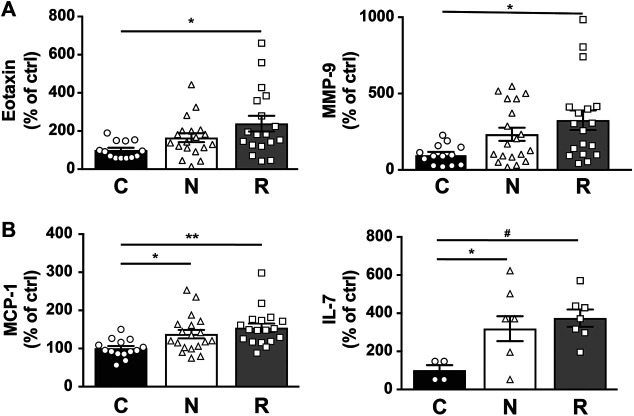
The standard treatment for neovascular age-related macular degeneration (nAMD) consists of intravitreal anti-vascular endothelial growth factors (VEGF). However, for some patients, even maximal anti-VEGF treatment does not entirely suppress exudative activity. The goal of this study was to identify molecular biomarkers in nAMD with incomplete response to anti-VEGF treatment. Aqueous humor (AH) samples were collected from three groups of patients: 17 patients with nAMD responding incompletely to anti-VEGF (18 eyes), 17 patients affected by nAMD with normal treatment response (21 eyes), and 16 control patients without any retinopathy (16 eyes). Proteomic and multiplex analyses were performed on these samples. Proteomic analyses showed that nAMD patients with incomplete anti-VEGF response displayed an increased inflammatory response, complement activation, cytolysis, protein-lipid complex, and vasculature development pathways. Multiplex analyses revealed a significant increase of soluble vascular cell adhesion molecule-1 (sVCAM-1) [ p = 0.001], interleukin-6 (IL-6) [ p = 0.009], bioactive interleukin-12 (IL-12p40) [ p = 0.03], plasminogen activator inhibitor type 1 (PAI-1) [ p = 0.004], and hepatocyte growth factor (HGF) [ p = 0.004] levels in incomplete responders in comparison to normal responders. Interestingly, the same biomarkers showed a high intercorrelation with r2 values between 0.58 and 0.94. In addition, we confirmed by AlphaLISA the increase of sVCAM-1 [ p < 0.0001] and IL-6 [ p = 0.043] in the incomplete responder group. Incomplete responders in nAMD are associated with activated angiogenic and inflammatory pathways. The residual exudative activity of nAMD despite maximal anti-VEGF treatment may be related to both angiogenic and inflammatory responses requiring specific adjuvant therapy. Data are available via ProteomeXchange with identifier PXD02247.

Keywords: Inflammation; Soluble vascular cell adhesion molecule-1 (sVCAM-1); age-related macular degeneration (AMD); angiogenic factors; bioactive interleukin-12 (IL-12p40); hepatocyte growth factor (HGF); interleukin-6 (IL-6); plasminogen ctivator inhibitor type 1 (PAI-1).


Conflict of interest statement

The authors declare that the research was conducted in the absence of any commercial or financial relationships that could be construed as a potential conflict of interest.

Figures

FIGURE 1
FIGURE 1
Proteomic analyses of ten AH from each group of patient nAMD (N), rAMD (R), and controls (C). Graphic representation of VEGF-A (A), VEGFR1 (C) and VEGFR2 (E) levels obtained in the three different study groups. *p < 0.03 and #p < 0.0001 (Left). Graphs on the right represent the quantification of VEGF-A (B), VEGFR1 (D) and VEGFR2 (F) independently of the type of AMD but depending on the anti-VEGF treatment (aflibercept [Aflib] or ranibizumab [Ranib]) and classify according to the time after the last injection of anti-VEGF inhibitors.
FIGURE 2
FIGURE 2
Proteomic bio-informatic analyses of ten samples per study group. (A) Dot plot showing GO enrichment. Statistical significance of the enriched terms is based on the p-values corrected by multiple testing (color-coded). The number of genes associated with each respective term is indicated by the dot size. (B) Boxplots expression of genes involved in GO are highlighted in red in (A) with significance levels (*p < 0.1, **p < 0.05, and ***p < 0.01) obtained from linear models comparing N and R and comparing C/N and R.
FIGURE 3
FIGURE 3
GSEA-based GO analysis enrichment plots of representative gene sets for several pathways. The primary result of the gene set enrichment analysis is the enrichment score (ES, at the top of the green curve), which reflects the degree to which a gene set is overrepresented at the top or bottom of a ranked list of genes. GSEA calculates the ES by walking down the ranked list of genes, increasing a running-sum statistic when a gene is in the gene set and decreasing it when it is not. The magnitude of the increment depends on the correlation of the gene with the phenotype. The ES is the maximum deviation from zero encountered in walking the list. A positive ES indicates gene set enrichment at the top of the ranked list; a negative ES indicates gene set enrichment at the bottom of the ranked list. The middle portion of the plot shows where the members of the gene set appear in the ranked list of genes. The bottom part of the plot shows the values of the estimates of the linear model. Genes included in GO pathways, normalized enrichment scores, nominal p-values (from 1,000 permutations), and FDR q-values are indicated in the table. The complete lists of the GSEA output are provided for positive and negative enrichment. For more details, see the supplemental Excel table.
FIGURE 4
FIGURE 4
Level of VEGF-A in AH from nAMD patients with normal response (N), incomplete response (R), and controls (C). The VEGF-A was assessed by multiplex (A) or AlphaLISA (B) assays, and the results expressed are dependent on the anti-VEGF treatment (aflibercept [Aflib] or ranibizumab [Ranib]). **p < 0.0003 and #p < 0.0001.
FIGURE 5
FIGURE 5
Multiplex analysis of AH from nAMD patients with normal response (N), incomplete response (R), and controls (C). Graphic representation of sVCAM-1, PAI-1, HFG, IL-12p40, and IL-6. Results are expressed as mean ± SEM and as % of the control group (*p < 0.05, **p < 0.005, and #p < 0.0005).
FIGURE 6
FIGURE 6
Correlation between different AH biomarkers in group R with incomplete anti-VEGF response. Levels of 4 biomarkers were compared in AH of incomplete responders. A linear regression (R 2) was measured in all comparisons. sVCAM-1 vs. PAI-1: R 2 = 0.944; sVCAM-1 vs. HGF: R 2 = 0.750; sVCAM-1 vs. IL-12p40: R 2 = 0.508; HGF vs. PAI-1: R 2 = 0.806; HGF vs. IL-12p40: R 2 = 0.622; IL-12p40 vs. PAI-1: R 2 = 0.758.
FIGURE 7
FIGURE 7
Multiplex analysis of AH from nAMD patients with normal response (N), incomplete response (R), and controls (C). Graphic representation of EOTAXIN and MMP-9 (A) and of MCP-1 and IL-7 (B) levels in the study groups. Results are expressed as mean ± SEM and as % of the control (*p < 0.05, **p < 0.005, and #p < 0.0005).

References

    1. Benjamini Y., Hochberg Y. (1995). Controlling the false discovery rate: a practical and powerful approach to multiple testing. J. Roy. Stat. Soc. B 57 (1), 289–300. 10.1111/j.2517-6161.1995.tb02031.x - DOI
    1. Bertelmann T., Spychalska M., Kohlberger L., Strodthoff S., Witteborn M., Kicova N., et al. (2013). Intracameral concentrations of the fibrinolytic system components in patients with age-related macular degeneration. Graefes Arch. Clin. Exp. Ophthalmol. 251 (12), 2697–2704. 10.1007/s00417-013-2374-8 - DOI - PubMed
    1. Bontzos G., Bagheri S., Ioanidi L., Kim I., Datseris I., Gragoudas E., et al. (2019). Nonresponders to ranibizumab anti-VEGF treatment are actually short-term responders: a prospective spectral-domain OCT study. Ophthalmology. Retina S2468–6530, 30628–30631. 10.1016/j.oret.2019.11.004PMID - DOI - PMC - PubMed
    1. Brown D. M., Kaiser P. K., Michels M., Soubrane G., Heier J. S., Kim R. Y., et al. (2006). Ranibizumab versus verteporfin for neovascular age-related macular degeneration. N. Engl. J. Med. 355, 1432–1444. 10.1056/NEJMoa062655 - DOI - PubMed
    1. Cabral T., Lima L. H., Mello L. M., Polido J., Correa É. P., Oshima A., et al. (2017). Bevacizumab injection in patients with neovascular age-related macular degeneration increases angiogenic biomarkers. Ophthalmol. Retina 2 (1), 31–37. 10.1016/j.oret.2017.04.004 - DOI - PMC - PubMed