. 2020 Dec 28;8(4):359-370.
doi: 10.14218/JCTH.2020.00015. Epub 2020 Dec 15.

A 3D Human Liver Model of Nonalcoholic Steatohepatitis

Affiliations

A 3D Human Liver Model of Nonalcoholic Steatohepatitis

Marion Duriez et al. J Clin Transl Hepatol. .

Abstract

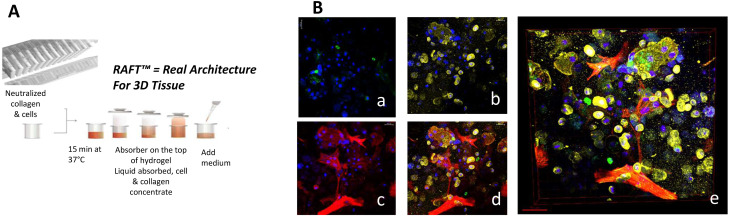
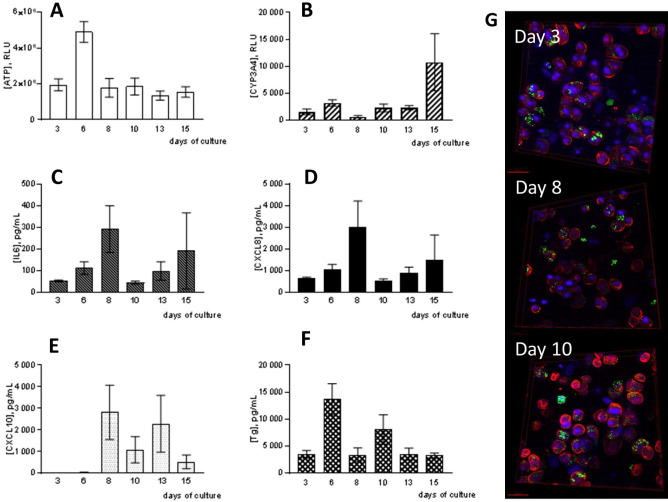
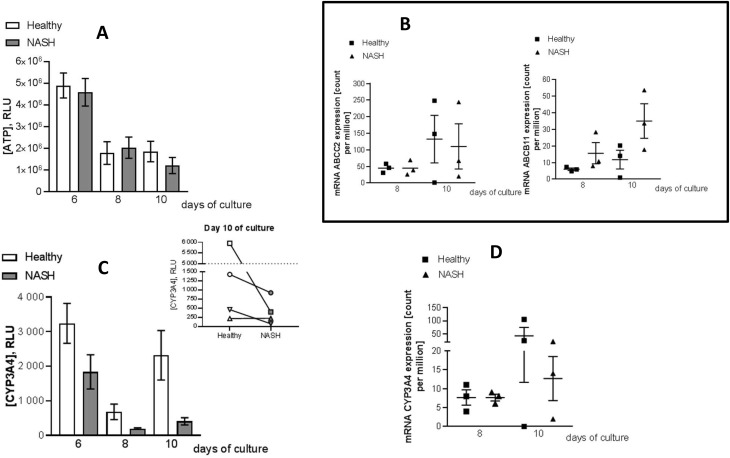
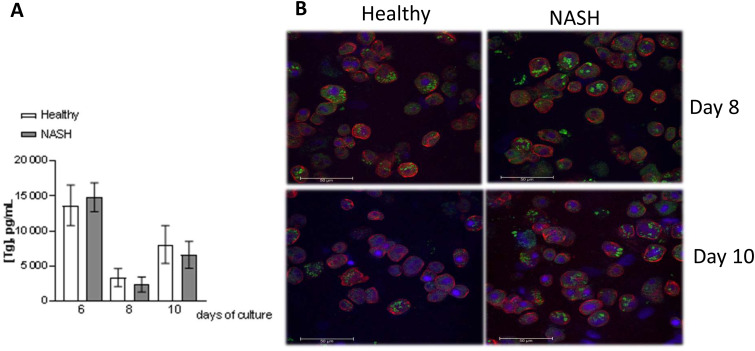
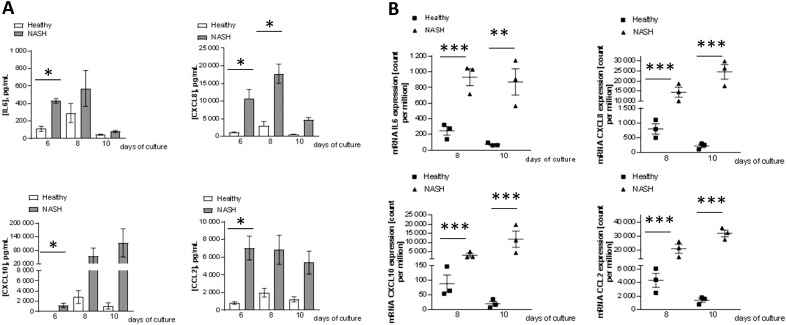
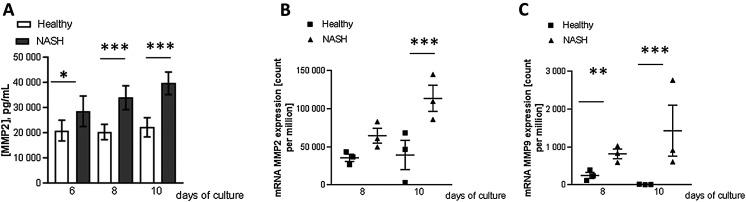
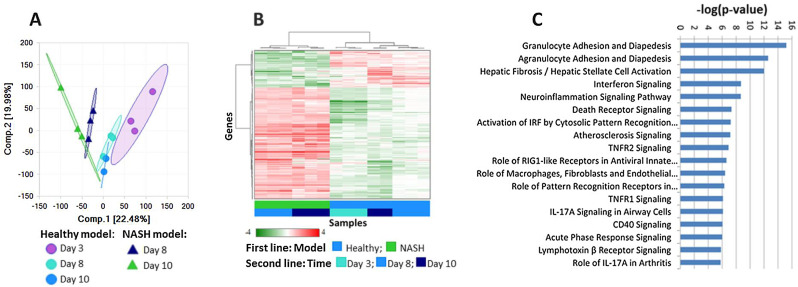
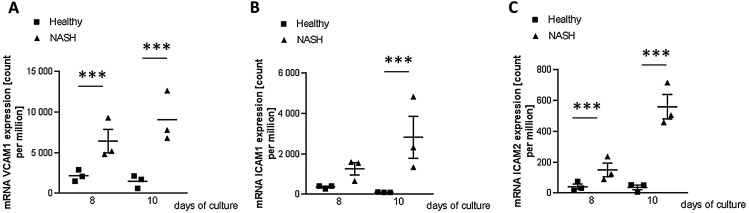
Background and Aims: To better understand nonalcoholic steatohepatitis (NASH) disease progression and to evaluate drug targets and compound activity, we undertook the development of an in vitro 3D model to mimic liver architecture and the NASH environment. Methods: We have developed an in vitro preclinical 3D NASH model by coculturing primary human hepatocytes, human stellate cells, liver endothelial cells and Kupffer cells embedded in a hydrogel of rat collagen on a 96-well plate. A NASH-like environment was induced by addition of medium containing free fatty acids and tumor necrosis factor-α. This model was then characterized by biochemical, imaging and transcriptomics analyses. Results: We succeeded in defining suitable culture conditions to maintain the 3D coculture for up to 10 days in vitro, with the lowest level of steatosis and reproducible low level of inflammation and fibrosis. NASH disease was induced with a custom medium mimicking NASH features. The cell model exhibited the key NASH disease phenotypes of hepatocyte injury, steatosis, inflammation, and fibrosis. Hepatocyte injury was highlighted by a decrease of CYP3A4 expression and activity, without loss of viability up to day 10. Moreover, the model was able to stimulate a stable inflammatory and early fibrotic environment, with expression and secretion of several cytokines. A global gene expression analysis confirmed the NASH induction. Conclusions: This is a new in vitro model of NASH disease consisting of four human primary cell-types that exhibits most features of the disease. The 10-day cell viability and cost effectiveness of the model make it suitable for medium throughput drug screening and provide attractive avenues to better understand disease physiology and to identify and characterize new drug targets.

Keywords: 3D liver model; Human primary cells; Key features of NASH.


Conflict of interest statement

All of the authors except TS were employees of Sanofi during the course of the study, and all are or have been shareholders of Sanofi.

Figures

Fig. 1.
Fig. 1.. Set-up of human liver primary coculture in a 3D environment.
(A) Real architecture for 3D model with RAFTTM system methodology illustration. (B) PHH-KC-HSC-LEC coculture at 10 days in 3D collagen matrix with healthy media. (a) KC staining with CD68 in green and nucleus-labeled in blue. (b) PHH staining with CK18 in green and nucleus labeled in blue. (c) HSC staining with α-smooth muscle actin in red and nucleus labeled in blue. (d) Merge. (e) 3D reconstitution was performed with IMARIS software 9.1.2.
Fig. 2.
Fig. 2.. Human 3D liver primary coculture characterization.
(A) Adenosine triphosphate intracellular in RLU. (B) CYP3A4 activity in RLU. (C) IL6 (D) CXCL8 and (E) CXCL10 in pg/mL. (F) Triglyceride content in pg/mL. (G) Kinetics of lipid droplet content in liver coculture in 3D collagen matrix, healthy condition. PHH staining of CK18 in red, nuclear in blue and lipid droplet in green. *p<0.050, **p<0.010, ***p<0.001, two-way ANOVA with random effect followed by Bonferroni-Holm correction
Fig. 3.
Fig. 3.. PHH injury characterization in human 3D liver NASH model.
(A) Time course of adenosine triphosphate mean concentration (in RLU, +/-standard error of the mean) in 3D healthy and NASH models. (B) ABCC2 (left panel) and ABCB11 (right panel) mRNA expression in counts per million at days 8 and 10 in healthy and NASH culture. (C) Time course of CYP3A4 mean concentration (in RLU, +/-SEM) in 3D healthy and NASH models (left panel) with a focus on the fourth independent experiment trend on day 10 (right panel, each symbol represents an independent experiment). (D) CYP3A4 mRNA expression in counts per million at days 8 and 10 in healthy and NASH culture conditions. *p<0.050, **p<0.010, ***p<0.001, Student’s test and DESeq2, respectively for panels A and C and panels B and D.
Fig. 4.
Fig. 4.. Assessment of steatosis feature.
(A) Time course of triglyceride mean concentration content (in pg/mL, +/-standard error of the mean) in 3D healthy and NASH models. (B) Lipid droplet staining in healthy and NASH culture conditions (left and right panels respectively) at days 8 and 10 (upper and lower panels, respectively). Lipid droplets are stained in green, nucleus in blue, and CK18 staining at PHH cell surface in red. Images were acquired with a Leica SP8X confocal microscope. *p<0.050, **p<0.010, ***p<0.001, Student’s test.
Fig. 5.
Fig. 5.. Inflammatory environment induced in 3D liver NASH model.
(A) Time course of secreted IL6, CXCL8, CXCL10 and CCL2 mean concentration (in pg/mL, +/-standard error of the mean) at days 6, 8 and 10 in healthy and NASH models. (B) IL6, CXCL8, CXCL10 and CCL2 mRNA expression in count per millions at days 8 and 10 in healthy and NASH conditions. *p<0.050, **p<0.010, ***p<0.001, Student’s test and DESeq2, respectively, for panel A and panel B.
Fig. 6.
Fig. 6.. Early fibrotic tissue remodeling factors induced in 3D liver NASH model.
(A) Time course of secreted MMP2 mean concentration (in pg/mL, +/-standard error of the mean) at days 6, 8 and 10 in healthy and NASH models. (B) MMP2 and (C) MMP9 mRNA expression level in count per millions at days 8 and 10 in healthy and NASH conditions. *p<0.050, **p<0.010, ***p<0.001, Student’s test and DESeq2, respectively, for panel A and panels B and C.
Fig. 7.
Fig. 7.. RNA-Seq analysis of NASH and healthy 3D models.
(A) Principal component analysis (PCA) for gene expression in the 3D model of NASH versus healthy state at day 3, 8 and 10. The PCA was performed using DESeq2 normalized expression data. (B) Clustering analysis of differentially-expressed genes between the 3D model of the NASH disease and biological healthy models, at day 8. Heat map illustrating unsupervised hierarchical clustering of the 468 genes specifically regulated in NASH model versus the biologically healthy model at day 8 (log2 of DESeq normalized data). (C) Enrichment analysis of molecular pathways in NASH model at day 8. Visualization of top 18 enriched canonical pathways in human NASH patients as compared to normal controls. Values are expressed as –log (p-value).
Fig. 8.
Fig. 8.. mRNA expression level.
The values are expressed in counts per million at days 8 and 10 in the healthy and NASH conditions, with a scatter plot representation for VCAM1 (A), ICAM1 (B) and ICAM2 (C). *p<0.050, **p<0.010, ***p<0.001, DESeq2 test.

References

    1. Younossi Z, Tacke F, Arrese M, Chander Sharma B, Mostafa I, Bugianesi E, et al. Global perspectives on nonalcoholic fatty liver disease and nonalcoholic steatohepatitis. Hepatology. 2019;69:2672–2682. doi: 10.1002/hep.30251. - DOI - PubMed
    1. Friedman SL, Neuschwander-Tetri BA, Rinella M, Sanyal AJ. Mechanisms of NAFLD development and therapeutic strategies. Nat Med. 2018;24:908–922. doi: 10.1038/s41591-018-0104-9. - DOI - PMC - PubMed
    1. Buzzetti E, Pinzani M, Tsochatzis EA. The multiple-hit pathogenesis of non-alcoholic fatty liver disease (NAFLD) Metabolism. 2016;65:1038–1048. doi: 10.1016/j.metabol.2015.12.012. - DOI - PubMed
    1. Younossi ZM, Koenig AB, Abdelatif D, Fazel Y, Henry L, Wymer M. Global epidemiology of nonalcoholic fatty liver disease-Meta-analytic assessment of prevalence, incidence, and outcomes. Hepatology. 2016;64:73–84. doi: 10.1002/hep.28431. - DOI - PubMed
    1. Dulai PS, Singh S, Patel J, Soni M, Prokop LJ, Younossi Z, et al. Increased risk of mortality by fibrosis stage in nonalcoholic fatty liver disease: Systematic review and meta-analysis. Hepatology. 2017;65:1557–1565. doi: 10.1002/hep.29085. - DOI - PMC - PubMed