

Into the well-A close look at the complex structures of a microtiter biofilm and the crystal violet assay
- PMID: 33447793
- PMCID: PMC7798451
- DOI: 10.1016/j.bioflm.2019.100006
Into the well-A close look at the complex structures of a microtiter biofilm and the crystal violet assay
Abstract
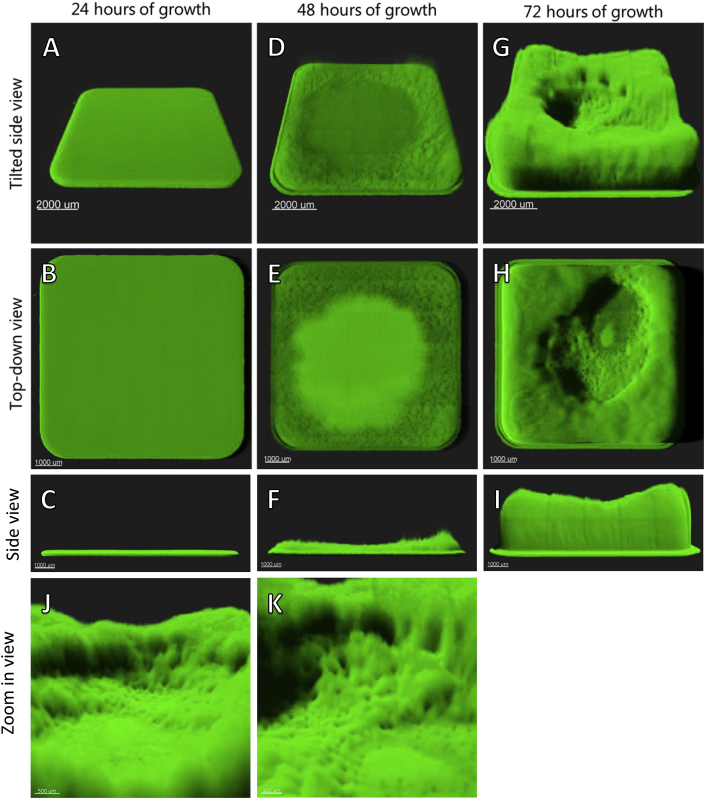
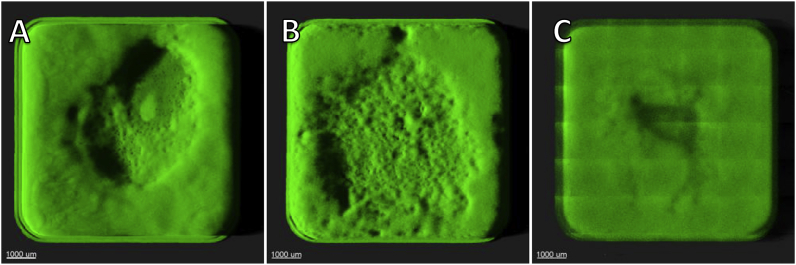
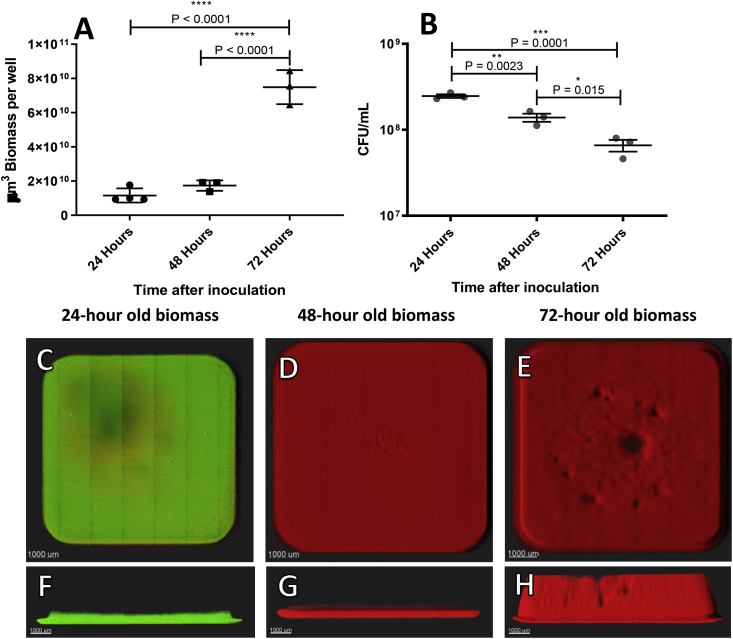
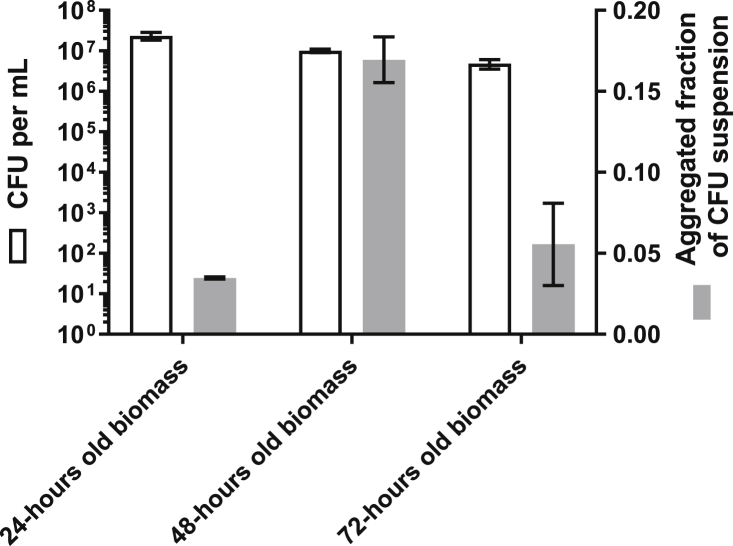
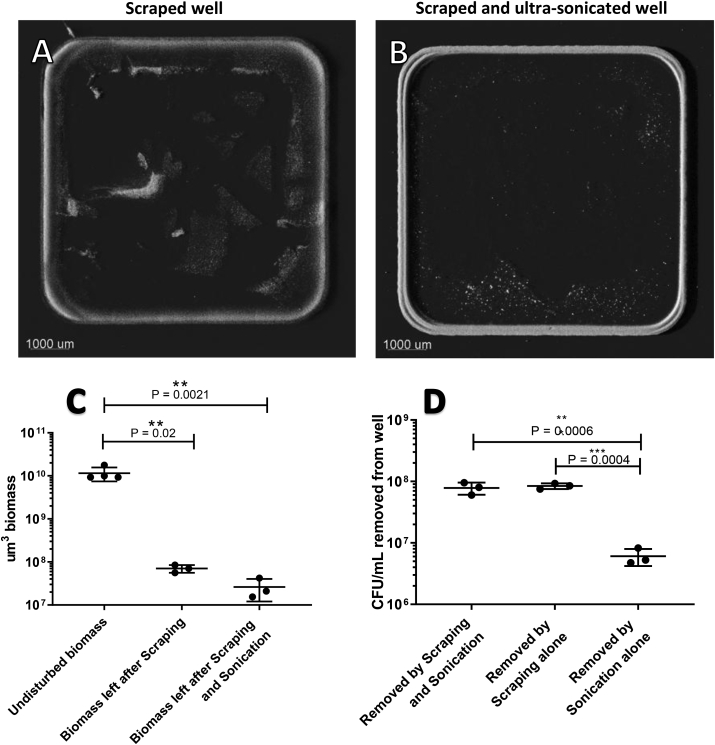
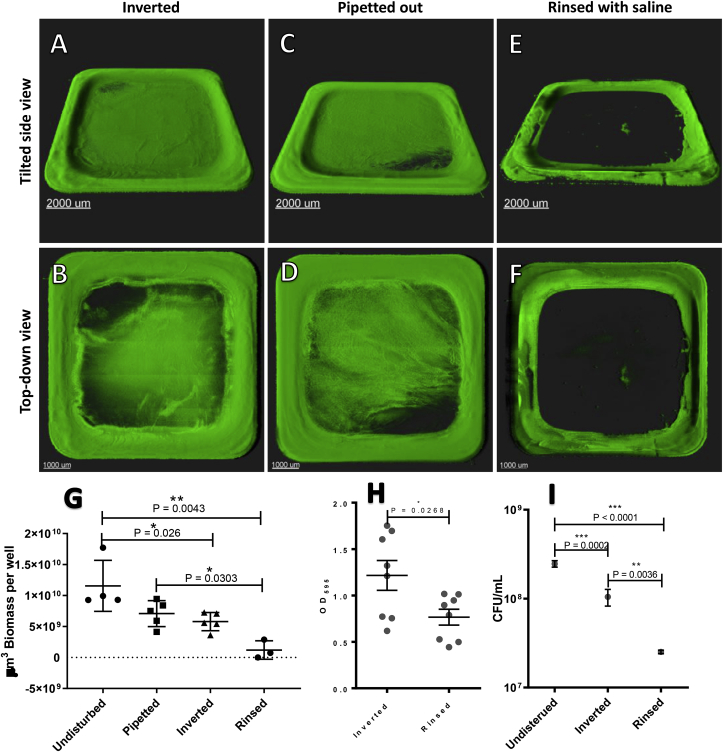
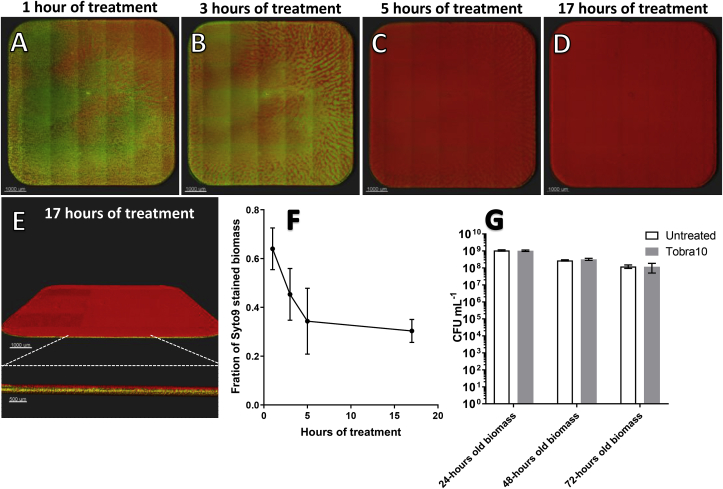
The microtiter assay is one of the most widely used methods for assessing biofilm formation. Though it has high throughput, this assay is known for its substantial deviation from experiment to experiment, and even from well to well. Since the assay constitutes one of the pillars of biofilm research, it was decided to examine the wells of a microtiter plate directly during growth, treatment, and the steps involved in crystal violet (CV) measurements. An inverted Zeiss LSM 880 confocal laser scanning microscope was used to visualize and quantify biomass directly in the wells of the microtiter plate. Green fluorescent protein-tagged Pseudomonas aeruginosa, PAO1, and live/dead stains were used to assess the structure, state, and position of biomass build-up. Microscopic observations were compared with colony-forming unit (CFU) and CV measurements. The development and the structured architecture of biomass was observed in real-time in the wells. Three-dimensional images of biomass were obtained from all of the microtiter wells; these showed variations from well to well. CV staining showed large variations in remaining biomass, depending on the method selected to remove the supernatant prior to CV staining (i.e. pipetting or manually discarding the fluid by inversion, washed or unwashed wells). Colony-forming unit counts or live/dead staining used to evaluate biomass with or without antibiotic treatment proved imprecise due to aggregation, limited removal of biomass, and overestimation of dead staining. The highly structured microenvironment of biomass in microtiter wells needs to be considered when designing and analyzing experiments. When using microtiter plates, stochastic variation due to growth and handling may lead to flawed conclusions. It is therefore recommended that this assay be used as a screening tool rather than as a stand-alone experimental tool.
Keywords: Biofilm; Confocal laser scanning microscopy; Crystal violet; In vitro validation; Microtiter assay; Pseudomonas aeruginosa.
© 2019 The Authors.
Figures
Similar articles
-
Microtiter dish biofilm formation assay.J Vis Exp. 2011 Jan 30;(47):2437. doi: 10.3791/2437. J Vis Exp. 2011. PMID: 21307833 Free PMC article.
-
A High-Throughput Microtiter Plate Screening Assay to Quantify and Differentiate Species in Dual-Species Biofilms.Microorganisms. 2023 Sep 6;11(9):2244. doi: 10.3390/microorganisms11092244. Microorganisms. 2023. PMID: 37764089 Free PMC article.
-
The dynamics of biofilm development and dispersal should be taken into account when quantifying biofilm via the crystal violet microtiter plate assay.Biofilm. 2024 Jun 20;8:100207. doi: 10.1016/j.bioflm.2024.100207. eCollection 2024 Dec. Biofilm. 2024. PMID: 39021701 Free PMC article.
-
Development and assessment of a high-throughput biofilm and biomass testing platform.J Wound Care. 2021 Jul 1;30(Sup7):S36-S46. doi: 10.12968/jowc.2021.30.Sup7.S36. J Wound Care. 2021. PMID: 34256585
-
Microtiter plate assay for assessment of Listeria monocytogenes biofilm formation.Appl Environ Microbiol. 2002 Jun;68(6):2950-8. doi: 10.1128/AEM.68.6.2950-2958.2002. Appl Environ Microbiol. 2002. PMID: 12039754 Free PMC article.
Cited by
-
Antifouling potential of enzymes applied to reverse osmosis membranes.Biofilm. 2023 Apr 1;5:100119. doi: 10.1016/j.bioflm.2023.100119. eCollection 2023 Dec. Biofilm. 2023. PMID: 37131492 Free PMC article.
-
A microtiter peg lid with ziggurat geometry for medium-throughput antibiotic testing and in situ imaging of biofilms.Biofilm. 2023 Nov 17;6:100167. doi: 10.1016/j.bioflm.2023.100167. eCollection 2023 Dec 15. Biofilm. 2023. PMID: 38078058 Free PMC article.
-
MXene-Coated Ion-Selective Electrode Sensors for Highly Stable and Selective Lithium Dynamics Monitoring.Environ Sci Technol. 2024 Jan 16;58(2):1359-1368. doi: 10.1021/acs.est.3c06235. Epub 2023 Dec 11. Environ Sci Technol. 2024. PMID: 38079615 Free PMC article.
-
In Vitro Evaluation of Polihexanide, Octenidine and NaClO/HClO-Based Antiseptics against Biofilm Formed by Wound Pathogens.Membranes (Basel). 2021 Jan 17;11(1):62. doi: 10.3390/membranes11010062. Membranes (Basel). 2021. PMID: 33477349 Free PMC article.
-
Bacteriophage Dosing and Its Effect on Bacterial Growth Suppression in a Staphylococcus epidermidis Model: An In Vitro Study.Phage (New Rochelle). 2024 Dec 18;5(4):223-229. doi: 10.1089/phage.2024.0001. eCollection 2024 Dec. Phage (New Rochelle). 2024. PMID: 40045941
References
-
- O’Toole G.A., Kolter R. Initiation of biofilm formation in Pseudomonas fluorescens WCS365 proceeds via multiple, convergent signalling pathways: a genetic analysis. Mol Microbiol. 1998;28(3):449–461. http://www.ncbi.nlm.nih.gov/pubmed/9632250 - PubMed
-
- Pitts B., Hamilton M.A., Zelver N., Stewart P.S. A microtiter-plate screening method for biofilm disinfection and removal. J Microbiol Methods. 2003;54(2):269–276. http://www.ncbi.nlm.nih.gov/pubmed/12782382 - PubMed
-
- O’Toole G.A., Pratt L.A., Watnick P.I., Newman D.K., Weaver V.B., Kolter R. Genetic approaches to study of biofilms. Methods Enzymol. 1999;310:91–109. http://www.ncbi.nlm.nih.gov/pubmed/10547784 - PubMed
LinkOut - more resources
Full Text Sources
