. 2019 Nov 19:2:100010.
doi: 10.1016/j.bioflm.2019.100010. eCollection 2020 Dec.

Minimum information guideline for spectrophotometric and fluorometric methods to assess biofilm formation in microplates

Affiliations

Minimum information guideline for spectrophotometric and fluorometric methods to assess biofilm formation in microplates

Jontana Allkja et al. Biofilm. .

Abstract

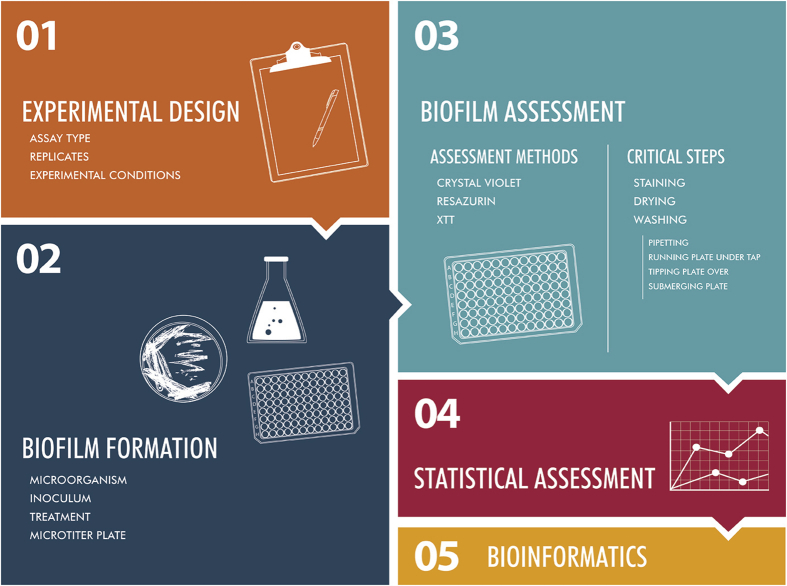
The lack of reproducibility of published studies is one of the major issues facing the scientific community, and the field of biofilm microbiology has been no exception. One effective strategy against this multifaceted problem is the use of minimum information guidelines. This strategy provides a guide for authors and reviewers on the necessary information that a manuscript should include for the experiments in a study to be clearly interpreted and independently reproduced. As a result of several discussions between international groups working in the area of biofilms, we present a guideline for the spectrophotometric and fluorometric assessment of biofilm formation in microplates. This guideline has been divided into 5 main sections, each presenting a comprehensive set of recommendations. The intention of the minimum information guideline is to improve the quality of scientific communication that will augment interlaboratory reproducibility in biofilm microplate assays.

Keywords: Biofilm; Fluorometry; Guidelines; Microplate; Reproducibility; Spectrophotometry.


Conflict of interest statement

The authors declare no competing interests.

Figures

Fig. 1
Fig. 1
Schematic diagram of the guideline and critical steps for spectrophotometric and fluorometric methods of biofilm assessment. Schematic diagram of the different sections of this guideline, highlighting the various critical steps that can increase variability in biofilm experiments. Different approaches to washing were illustrated to showcase how variable these can be in different protocols. (Illustration courtesy of Jill Story).
Fig. 2
Fig. 2
Show the dots on plots: scatter graphs allow readers to evaluate data distributions for themselves. Biofilm formation was measured for Pseudomonas aeruginosa strains CF39S and CF39, which express functional and mutant alleles of the thermosensory diguanylate cyclase (tdcA+ and tdcA), respectively. Each condition has 48 replicates, representing sixteen technical replicates from each of three independent biological replicates. (a) Line graph. Datum points represent means and standard deviations. (b) Scatter plot. Each point denotes a replicate datum point and lines and bars represent means and standard deviations, respectively. (Data courtesy of Joe J. Harrison).

References

    1. Baker M. Reproducibility crisis? Nature. 2016;533:26. - PubMed
    1. Dirnagl U. Rethinking research reproducibility. EMBO J. 2019;38 - PMC - PubMed
    1. Grimes D.R., Bauch C.T., Ioannidis J.P. Modelling science trustworthiness under publish or perish pressure. R. Soc. Open Sci. 2018;5:171511. - PMC - PubMed
    1. Taylor C.F. Promoting coherent minimum reporting guidelines for biological and biomedical investigations: the MIBBI project. Nat Biotechnol. 2008;26:889–896. - PMC - PubMed
    1. Anon A checklist for our community. Nat. Ecol. Evol. 2018;2:913. - PubMed