Review
. 2021 Jun;15(6):1622-1646.
doi: 10.1002/1878-0261.12901. Epub 2021 Feb 1.

Circulating tumor cell profiling for precision oncology

Affiliations
Review

Circulating tumor cell profiling for precision oncology

Mahmoud Labib et al. Mol Oncol. 2021 Jun.

Abstract

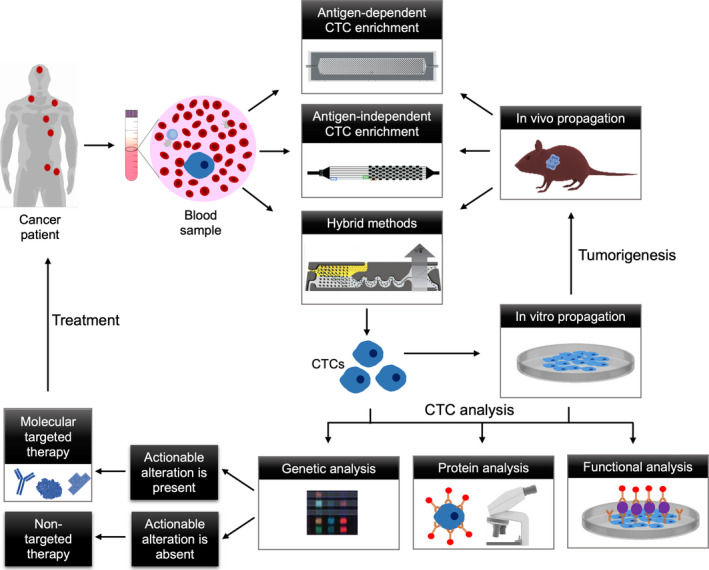
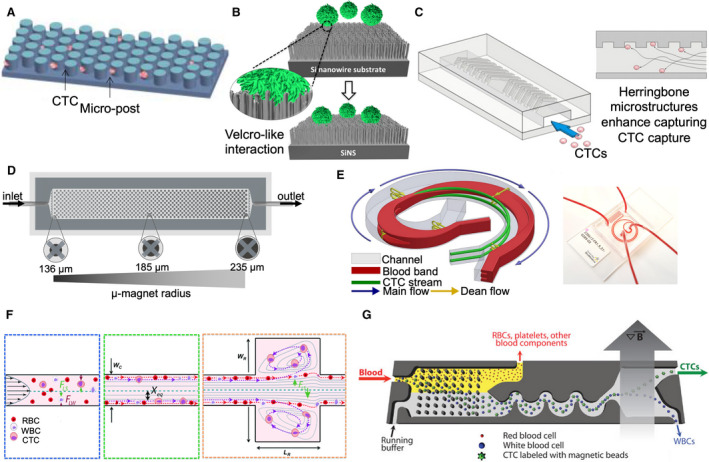
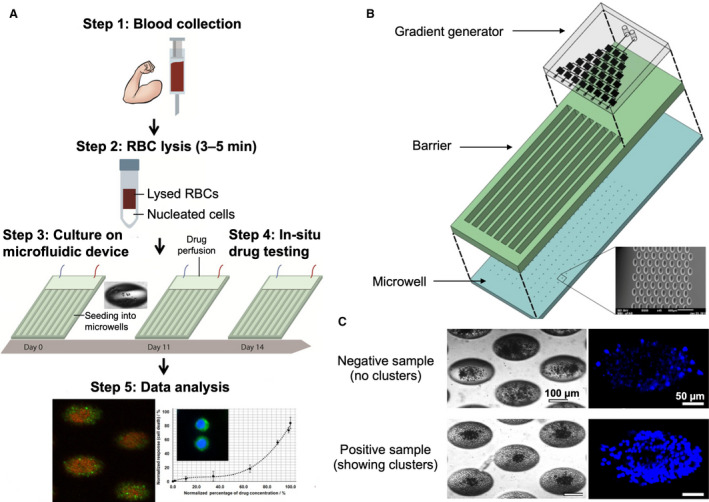
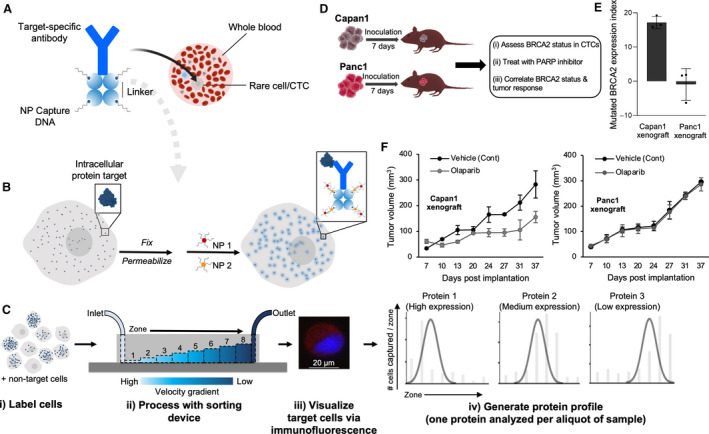
Analysis of circulating tumor cells (CTCs) collected from patient's blood offers a broad range of opportunities in the field of precision oncology. With new advances in profiling technology, it is now possible to demonstrate an association between the molecular profiles of CTCs and tumor response to therapy. In this Review, we discuss mechanisms of tumor resistance to therapy and their link to phenotypic and genotypic properties of CTCs. We summarize key technologies used to isolate and analyze CTCs and discuss recent clinical studies that examined CTCs for genomic and proteomic predictors of responsiveness to therapy. We also point out current limitations that still hamper the implementation of CTCs into clinical practice. We finally reflect on how these shortcomings can be addressed with the likely contribution of multiparametric approaches and advanced data analytics.

Keywords: CTC enrichment; drug selection; microfluidics; molecular profiling; precision oncology; tumor resistance.


Conflict of interest statement

The authors declare no conflict of interest.

Figures

Fig. 1
Fig. 1
CTC analysis guiding precision oncology. To achieve this goal, CTCs are isolated from the blood of a cancer patient using antigen‐dependent or antigen‐independent CTC enrichment approaches or hybrid methods. The isolated CTCs can either be analyzed directly with single‐cell approaches or cultured in vitro before analysis. The CTCs propagated in vitro can also be xenografted to propagate in vivo then isolated using the previous approaches. The CTCs are analyzed for predictors of responsiveness to therapy using genetic, protein, and functional assays. Upon detection of actionable alterations, the patient is treated with molecular targeted therapy. In absence of molecular alterations, an appropriate therapeutic intervention is decided by the physician.
Fig. 2
Fig. 2
CTC enrichment approaches used for monitoring tumor resistance. (A–D) Antigen‐dependent CTC enrichment approaches. (A) Illustrative cartoon showing CTCs captured against the microposts within the CTC‐Chip. (B) The working mechanism of the nanoVelcro chip, which contains silicon nanowire substrate (SiNS) coated with EpCAM antibodies to enhance the capture efficiency of CTCs. (C) Illustration of the herringbone device (HBCTC‐Chip), featuring a microfluidic array of channels with a single inlet and outlet. (D) The microfluidic device used for magnetic ranking cytometry (MagRC) consists of 100 distinct capture zones. An array of X‐shaped microstructures creates regions of low flow velocity and circular nickel micromagnets patterned within the channel enhance the externally applied magnetic field. (E, F) Antigen‐independent CTC enrichment methods used for resistance monitoring. (E) Schematic illustration of Dean flow fractionation (DFF) principle of the antigen‐independent ClearCell Fx system (left). The target cells travel to the inner together with the blood band following the Dean flow stream in the first half curvature of the channel. Once the inner side of the channel is reached, the target cells remain focused while the blood band travels to the outer side in the second half curvature of the channel. Both target cells and nontarget cells are collected from different outlets at the end of the spiral channel. The microfluidic device utilized in the ClearCell Fx system (right) has sample and sheath inlets at one end and recovery and waste outlets at the other end. (F) Schematic of the Vortex chip featuring 8 channels. (a) At the channel inlet, the cells are randomly distributed and experience to opposing lift forces, the wall effect (F LW) and the shear‐gradient lift force (F LS). (b) As a result, the cells migrate to dynamic lateral equilibrium position (X eq), based to the channel cross section. (c) Upon entering the reservoir, the wall effect is reduced so large cells which still experience large F LW are pushed to the vortices where they become captured, whereas small cells, which do not experience sufficient F LW remain in the main flow. (G) Schematic of a hybrid CTC enrichment system, the CTC‐iChip. The blood is mixed with immunomagnetic beads and buffer before introduced into the device. CTCs are captured subsequent to inertial focusing and magnetophoresis. Figure A is reproduced with permission from Ref.[46]; Figure B is reproduced with permission from Ref. [47]; Figure C is reproduced with permission from Ref. [48]; Figure D is reproduced with permission from Ref. [41]. Figures E is reproduced with permission from Ref. [71]; Figure F is reproduced with permission from Ref. [72]; Figure G is reproduced with permission from Ref. [77]. Figure reproduced from Refs [41, 46, 47, 48, 71, 72, 77].
Fig. 3
Fig. 3
CTC cluster assay for drug screening. (A) Schematic depicting the cluster assay for anticancer drug screening. Blood samples are first lysed to remove red blood cells (RBCs), and the nucleated cell fraction is then seeded into an integrated microwell‐based microfluidic device. Drugs are introduced directly in situ, and the CTC clusters are generated within 2 weeks. (B) Three‐dimensional layout of the drug assay device showing the gradient generator, barrier, and microwells. (C) Representative bright‐field and fluorescent images of negative and positive samples. Nuclei were stained using Hoechst dye. Figures adapted with permission from Ref. [105].
Fig. 4
Fig. 4
Analysis of intracellular proteins using the MagRC approach. (A) An antibody specific for the target intracellular protein is tagged with streptavidin then modified with biotin‐labeled ssDNAs using biotin–streptavidin coupling. (B) The cells expressing the target intracellular protein are fixed, permeabilized, and incubated with the intracellular protein‐specific antibody modified with ssDNAs. The ssDNAs are then hybridized with two capture probes (CP1 and CP2), which are composed of complementary DNA sequences modified at one end with MNPs. Aggregates of MNPs are thus formed and trapped within the cells that express the intracellular protein. (C) The cells are sorted using a microfluidic device featuring eight capture zones, immunostained, and counted to generate a profile characteristic for the target protein. (D) Schematic illustration for therapeutic protein analysis in xenografted mice. (E) Analysis of mutated BRCA2 protein in CTCs captured from the blood of mice bearing either Capan1 (with mutated BRCA2) or Panc1 (with wild‐type BRCA2) xenograft. The analysis was carried out at day 7 after tumor formation. After tumor formation, the mice were randomly divided into control and treated groups. Mice in the treated group received 50 mg·kg−1 olaparib, whereas mice in the control group received only the vehicle. (F) Tumor volume is plotted against duration of treatment for Capan1 and Panc1 xenografts. Figure reprinted with permission from Ref. [54].

References

    1. Kumar‐Sinha C & Chinnaiyan AM (2018) Precision oncology in the age of integrative genomics. Nat Biotechnol 36, 46–60. - PMC - PubMed
    1. Weinstein JN, Collisson EA, Mills GB, Shaw KR, Ozenberger BA, Ellrott K, Shmulevich I, Sander C & Stuart JM (2013) The cancer genome atlas Pan‐cancer analysis project. Nat Genet 45, 1113–1120. - PMC - PubMed
    1. Scott AM, Wolchok JD & Old LJ (2012) Antibody therapy of cancer. Nat Rev Cancer 12, 278–287. - PubMed
    1. La Thangue NB & Kerr DJ (2011) Predictive biomarkers: a paradigm shift towards personalized cancer medicine. Nat Rev Clin Oncol 8, 587–596. - PubMed
    1. Basik M, Aguilar‐Mahecha A, Rousseau C, Diaz Z, Tejpar S, Spatz A, Greenwood CM & Batist G (2013) Biopsies: next‐generation biospecimens for tailoring therapy. Nat Rev Clin Oncol 10, 437–450. - PubMed

Publication types

MeSH terms

LinkOut - more resources