. 2021 Jul;19(7):1325-1336.
doi: 10.1111/pbi.13547. Epub 2021 Feb 2.

Divergent improvement of two cultivated allotetraploid cotton species

Affiliations

Divergent improvement of two cultivated allotetraploid cotton species

Lei Fang et al. Plant Biotechnol J. 2021 Jul.

Abstract

Interspecific genomic variation can provide a genetic basis for local adaptation and domestication. A series of studies have presented its role of interspecific haplotypes and introgressions in adaptive traits, but few studies have addressed their role in improving agronomic character. Two allotetraploid Gossypium species, Gossypium barbadense (Gb) and G. hirsutum (Gh) originating from the Americas, are cultivated independently. Here, through sequencing and the comparison of one GWAS panel in 229 Gb accessions and two GWAS panels in 491 Gh accessions, we found that most associated loci or functional haplotypes for agronomic traits were highly divergent, representing the strong divergent improvement between Gb and Gh. Using a comprehensive interspecific haplotype map, we revealed that six interspecific introgressions from Gh to Gb were significantly associated with the phenotypic performance of Gb, which could explain 5%-40% of phenotypic variation in yield and fibre qualities. In addition, three introgressions overlapped with six associated loci in Gb, indicating that these introgression regions were under further selection and stabilized during improvement. A single interspecific introgression often possessed yield-increasing potential but decreased fibre qualities, or the opposite, making it difficult to simultaneously improve yield and fibre qualities. Our study not only has proved the importance of interspecific functional haplotypes or introgressions in the divergent improvement of Gb and Gh, but also supports their potential value in further human-mediated hybridization or precision breeding.

Keywords: Gossypium species; divergent improvement; interspecific haplotypes; interspecific introgression.


Conflict of interest statement

The authors declare no competing financial interests.

Figures
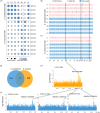
Figure 1
Figure 1
Interspecific divergent improvements between Gb and Gh. (a) Comparison of agronomic traits in Gb and Gh accessions. Each trait was z‐score transformed. Circle colour (light to dark) and size indicate gradually increasing values of each trait. (b) Distribution of loci associated with agronomic traits in Gb. Yield traits included LY, LP, SY and SI (pink background). Fibre quality traits included FE, FL, FM, FS and FU (blue background). The loci associated with each trait are indicated by black vertical lines in the chromosome map. (c) Distribution of loci associated with agronomic traits in Gh. Yield traits included LP and SI (pink background). Fibre quality traits included FE, FL, FM, FS and FU (blue background). The loci associated with each trait are indicated by black vertical lines in the chromosome map. (d) Venn diagram showing the overlap of associated loci in Gb and Gh. (e) Overlapped loci associated with LY in Gb. (f) Overlapped loci associated with FE, FL and FM in Gh.
Figure 2
Figure 2
Functional haplotypes in interspecific associated loci. (a) Manhattan plots for FL, FS and FU on Chromosome A03 in Gb. Interspecific QTLs LU7_UQLw_3_1_7.62, Ga7_ML_3_1_5.47 and F2:3‐qFL‐c3‐1 overlapped with the FS‐associated QTL qFS3‐1. (b) Genes with significant nonsynonymous SNPs in GWAS loci. (c) Transcriptomic levels of GbVAL1 and GbCIPK in Gb tissues based on FPKM values. (d) Boxplot for two haplotypes of GbCIPK and GbVAL1. Centre line, median; box limits, upper and lower quartiles; whiskers, 1.5 × the interquartile range; dots, outliers (**P < 0.01, two‐tailed t‐test). (e) Manhattan plots for FE, FL and FS on Chromosome A05 in Gh. Interspecific FL QTLs qFL‐A5‐1, qFL‐A5‐4 and Len‐C5 overlapped with FS QTLs qFS‐A5‐1, BC1_STR_5_3_3 and q‐STR‐5‐1. (f) Genes with significant nonsynonymous SNPs in GWAS loci. (g) Transcriptomic levels of GhMAPK in Gh tissues based on FPKM values. (h) Boxplot for two haplotypes of GhMAPK. Centre line, median; box limits, upper and lower quartiles; whiskers, 1.5 × the interquartile range; dots, outliers (**P < 0.01, two‐tailed t‐test).
Figure 3
Figure 3
Interspecific introgressions identified by comparative population genomics. (a) Pairwise IBDs identified in Gb and Gh accessions. Gb‐IBDs, Gh‐IBDs and Gb‐Gh‐IBDs are coloured yellow, blue and red, respectively. (b) Distribution of the relative proportions of IBD haplotypes (rIBD) in Gb (yellow) and Gh (blue) in bins of 10 kbp. rIBD = nIBDGb–nIBDGh, ranging from 1 (all haplotypes are IBD with Gb) to −1 (all haplotypes are IBD with Gh). rIBDGb > 0 and rIBDGh < 0 are shown in inner box. c, Genome‐wide distribution of interspecific common haplotypes. From outside to inside, I: Fst between Gb and Gh; II: Distribution of Gh‐HAPs in the Gb population (>5%); III: Distribution of Gb‐HAPs in the Gh population (>5%); IV: Chromosomal distribution of Gh‐HAPs in each of 12 Gb accessions; V: Chromosomal distribution of Gb‐HAPs in each of 9 Gh accessions. Gb‐HAPs and Gh‐HAPs are shown in orange and blue, respectively. (d) Phylogenetic neighbour‐joining tree of a panel of Gb and Gh accessions. Branches labelled in red and blue indicate Gb and Gh, respectively. The heatmap of individual accessions indicates the ratio of interspecies‐derived haplotypes. (e) Introgression regions from Gh in Gb populations. Blue, introgression origin from Gh; red, haplotype origin from Gb. Each column is a 10‐kb genomic region, and each row is a phased haplotype of Gb. (f) Fst index between Gb and Gh plotted against chromosome position. The x‐axis represents sliding windows of 100 kb on each chromosome, and the introgression regions are highlighted in grey. (g) Nucleotide diversity scores of Gb population plotted against chromosome position. The x‐axis represents sliding windows of 100 kb, and the introgression regions are highlighted in grey. (h) Average r 2 of Gb plotted against chromosome position. The introgression regions are highlighted in grey.
Figure 4
Figure 4
Effect of interspecific introgressions on phenotypic variance in Gb. (a) Boxplot for FL, FS, LP and SI in 229 Gb accessions with introgression and nonintrogression regions. Centre line, median; box limits, upper and lower quartiles; whiskers, 1.5× the interquartile range; dots, outliers (**P < 0.01, *P < 0.05, two‐tailed t‐test). (b) Percentage of the variance of FL, FS, LP and SI observed over four years explained by SNPs assigned to six Gh‐HAPs in Gb. (c) Phylogenetic relationships among the 229 accessions as revealed by different introgression regions. Accession groups G1, G2, G3I and G3II are marked with red, green, blue and purple lines, respectively. The outer circle indicates each accession, including those with introgressions (orange) and those without (grey).
Figure 5
Figure 5
Interspecific introgressions are under further human selection. (a) Manhattan plots of overlapped loci associated with FL and LP on Chr.A06 of Gb, which overlapped a segment of an interspecific introgression. Two interspecific QTLs, F2‐qFL‐c6‐1 and Mp7_uhml_6_1_4.25, are also shown at the top. (b) Candidate genes with significant nonsynonymous SNPs within GWAS loci from a, including GbTTL, GbLURP and GbJAZ1. Candidate genes in the locus A06Gb:19557428 overlapped with interspecific Gh‐i5. (c) Haplotype patterns of chromosome A06 in GB population. Blue represents haplotype origin from Gh; orange, haplotype origin from GB. (d) Boxplot for FL and LP by the associated SNPs of each gene. Centre line, median; box limits, upper and lower quartiles; whiskers, 1.5× the interquartile range; dots, outliers (**P < 0.01, two‐tailed t‐test). (e) Diagram of two accessions without and two with Gh‐i5 based on rIBD. (f) Significant relationships between associated loci and Gh‐i5. The frequencies are for GWAS‐associated SNPs in GbJAZ1, GbLURP and GbTTL in accessions with and without Gh‐i5.

Similar articles

Cited by

References

    1. Altschul, S.F. , Madden, T.L. , Schaffer, A.A. , Zhang, J. , Zhang, Z. , Miller, W. and Lipman, D.J. (1997) Gapped BLAST and PSI‐BLAST: a new generation of protein database search programs. Nucleic Acids Res. 25, 3389–3402. - PMC - PubMed
    1. Bolger, A.M. , Lohse, M. and Usadel, B. (2014) Trimmomatic: a flexible trimmer for Illumina sequence data. Bioinformatics 30, 2114–2120. - PMC - PubMed
    1. Bosse, M. , Megens, H.J. , Frantz, L.A. , Madsen, O. , Larson, G. , Paudel, Y. , Duijvesteijn, N. et al. (2014) Genomic analysis reveals selection for Asian genes in European pigs following human‐mediated introgression. Nat. Commun. 5, 4392. - PMC - PubMed
    1. Browning, B.L. and Browning, S.R. (2016) Genotype imputation with millions of reference samples. Am. J. Human Genet. 98, 116–126. - PMC - PubMed
    1. Chen, S. , Zhou, Y. , Chen, Y. and Gu, J. (2018) fastp: an ultra‐fast all‐in‐one FASTQ preprocessor. Bioinformatics 34, 884–890. - PMC - PubMed

Publication types

LinkOut - more resources