. 2021 Feb;20(2):e13305.
doi: 10.1111/acel.13305. Epub 2021 Jan 15.

Age-related changes in hippocampal-dependent synaptic plasticity and memory mediated by p75 neurotrophin receptor

Affiliations

Age-related changes in hippocampal-dependent synaptic plasticity and memory mediated by p75 neurotrophin receptor

Lik-Wei Wong et al. Aging Cell. 2021 Feb.

Abstract

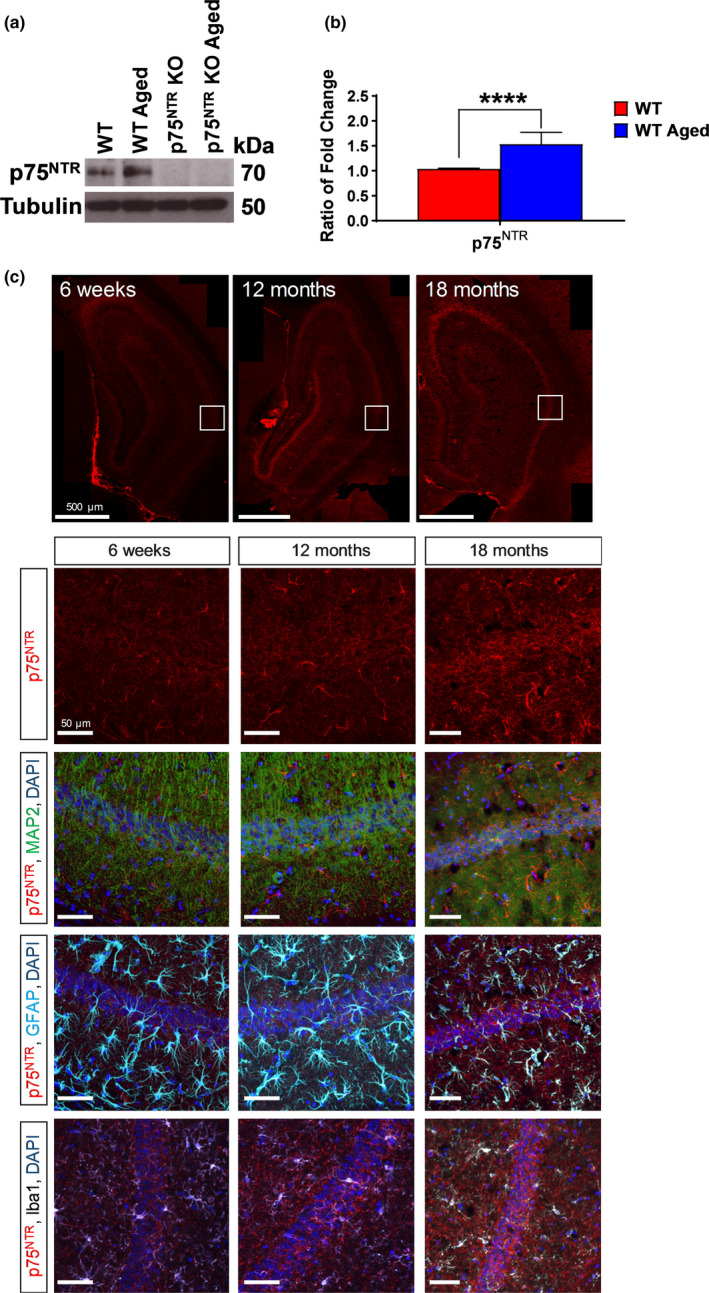
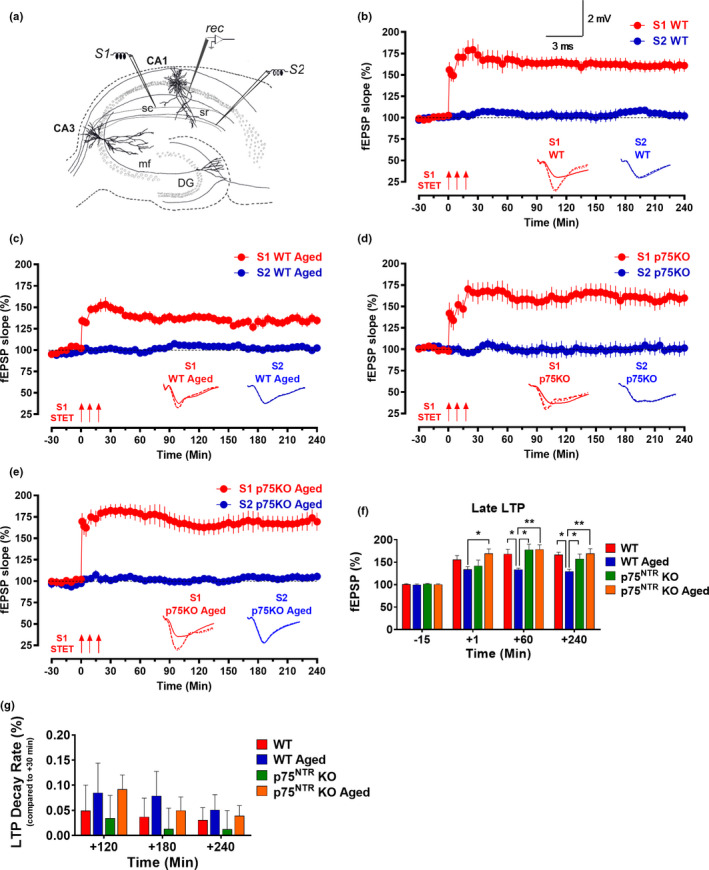
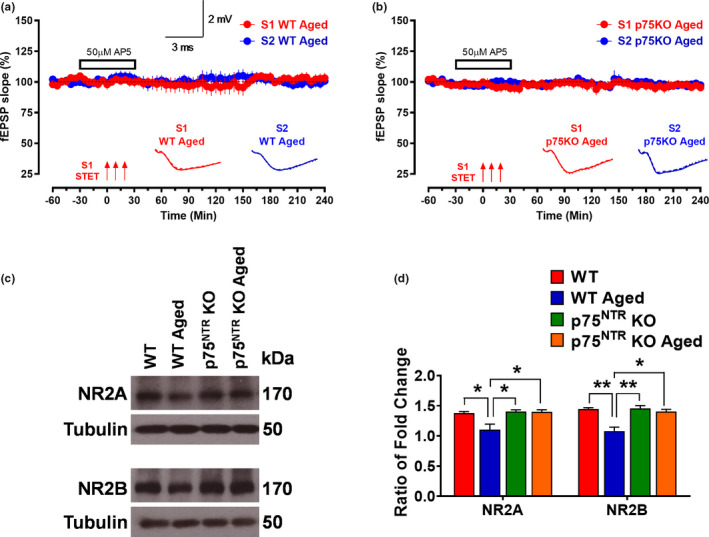
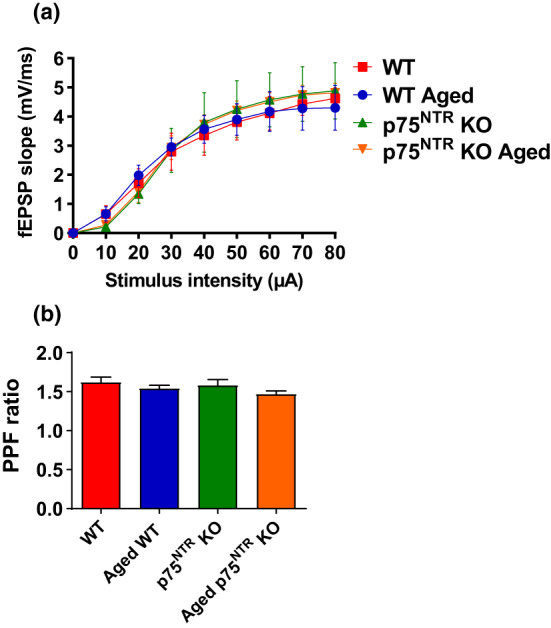
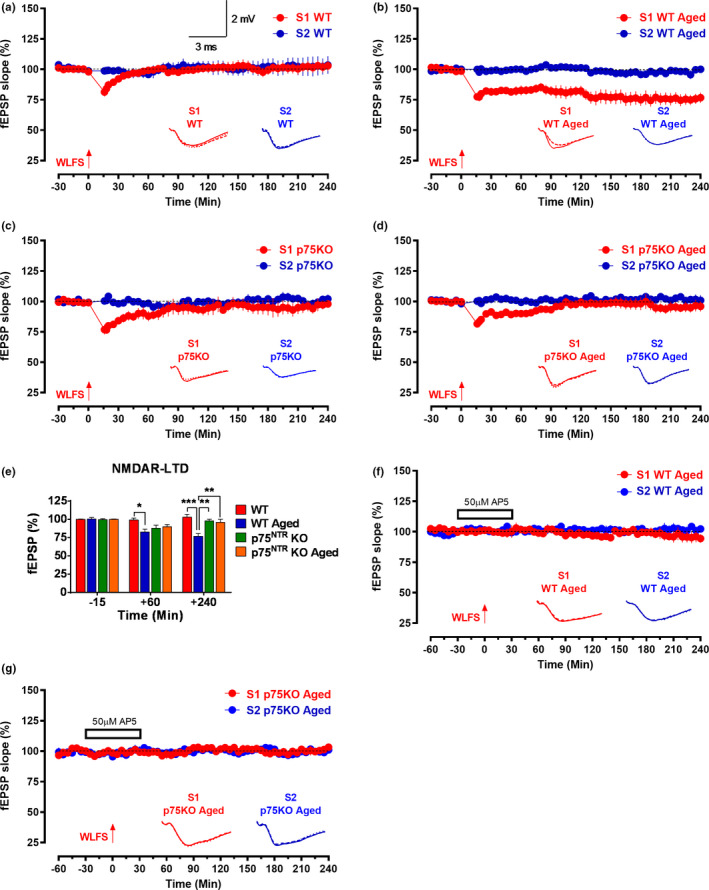
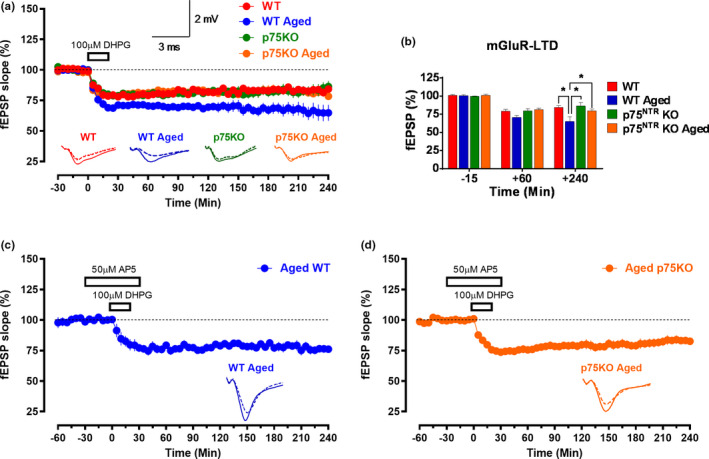
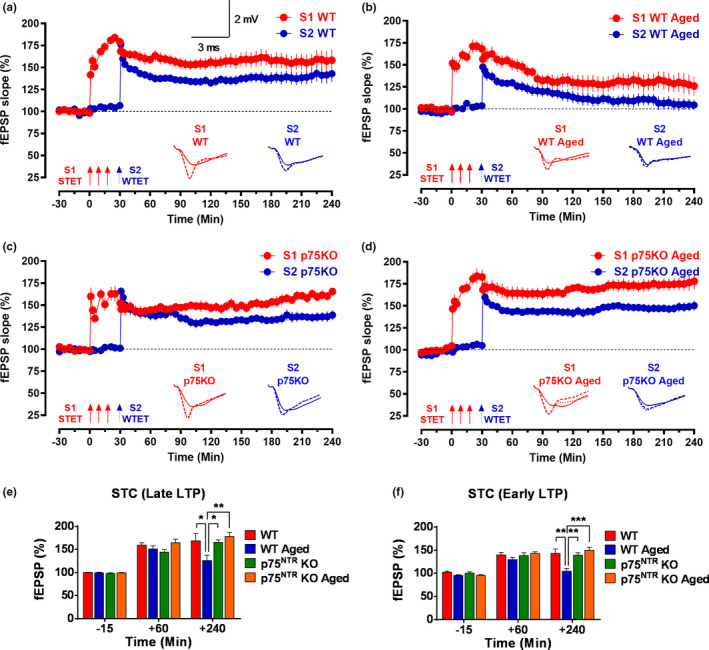
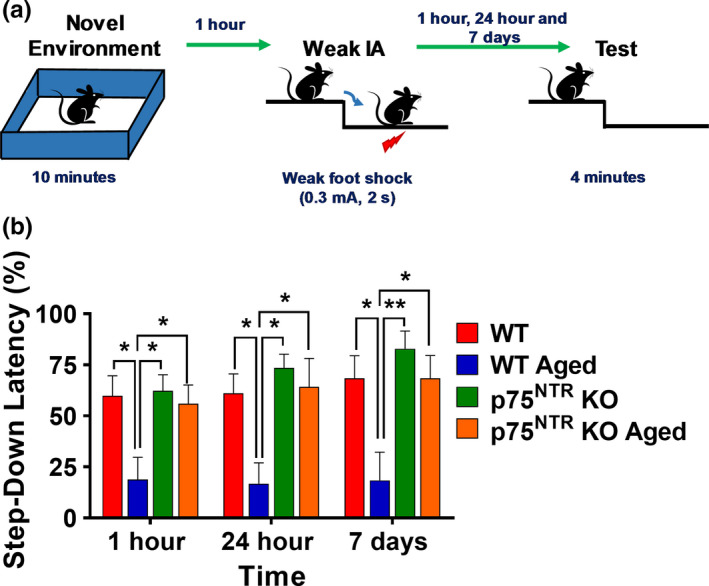
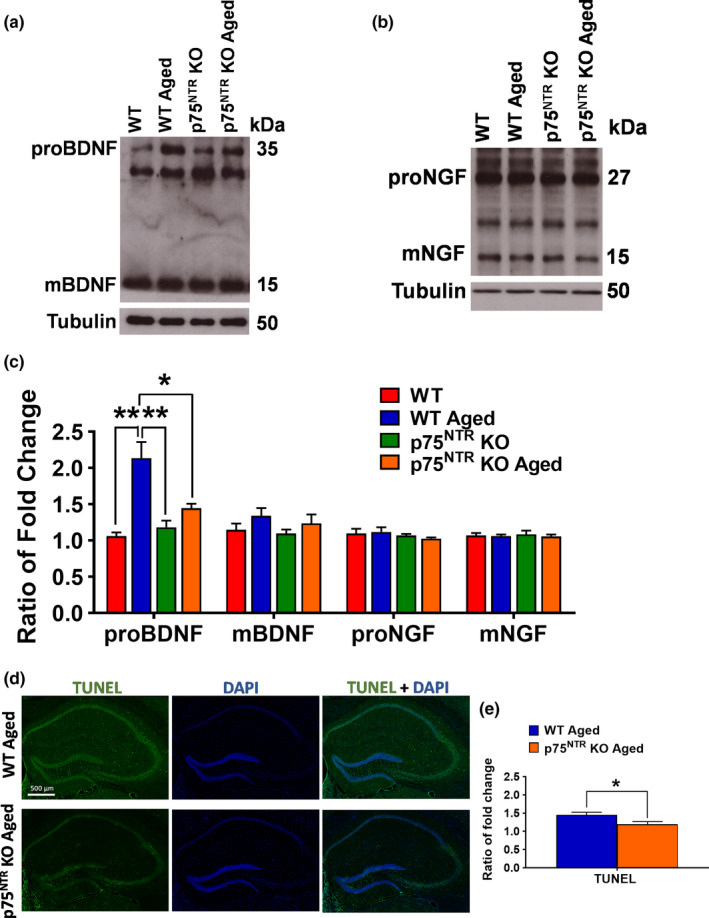
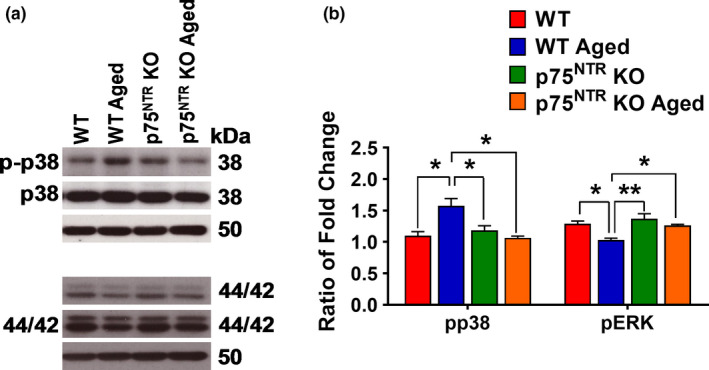
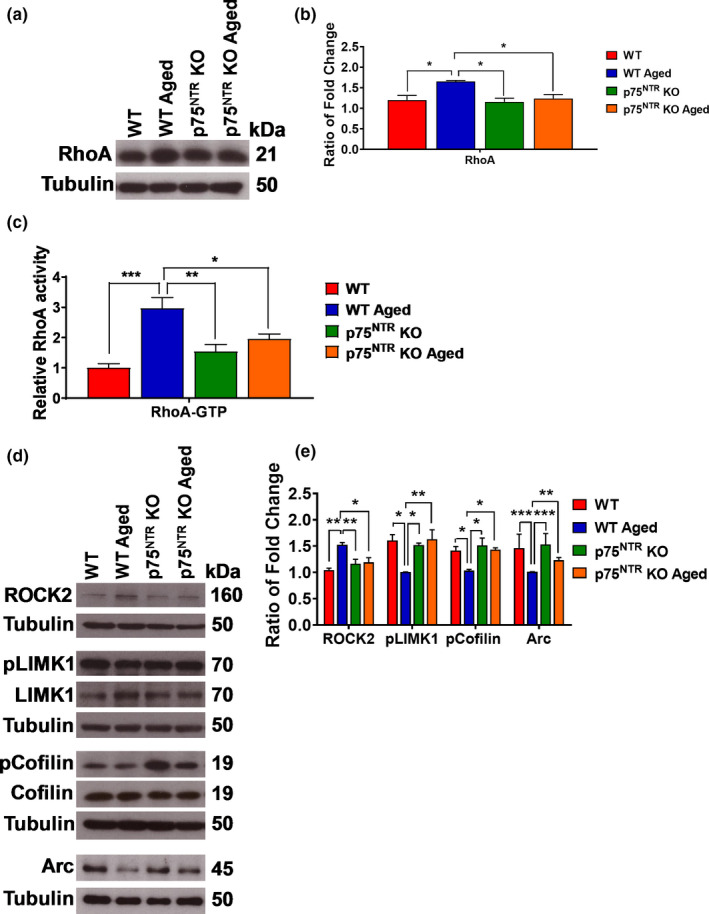
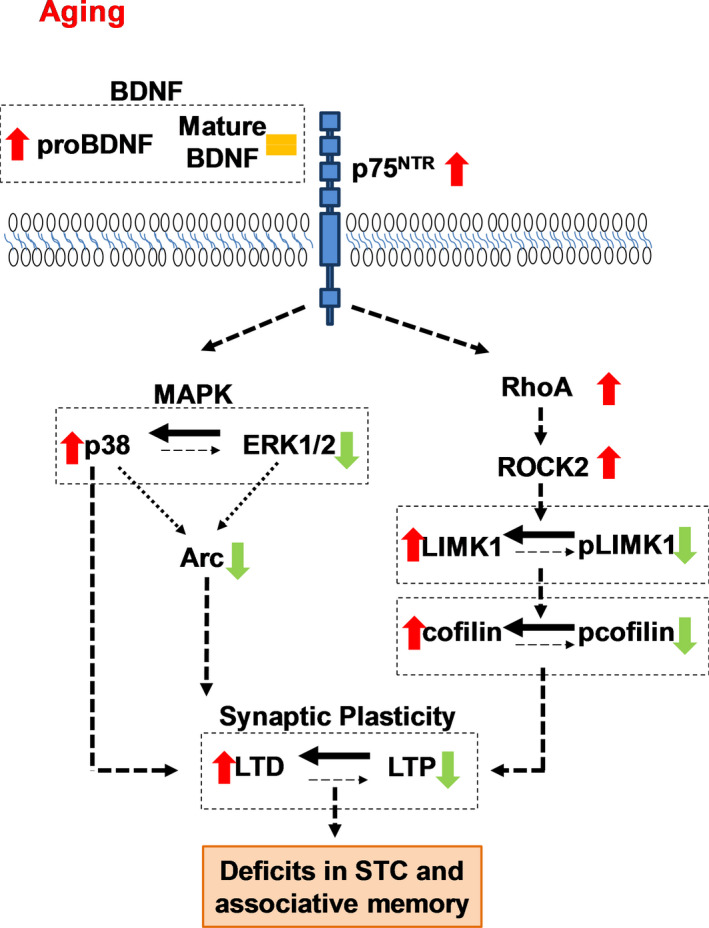
The plasticity mechanisms in the nervous system that are important for learning and memory are greatly impacted during aging. Notably, hippocampal-dependent long-term plasticity and its associative plasticity, such as synaptic tagging and capture (STC), show considerable age-related decline. The p75 neurotrophin receptor (p75NTR ) is a negative regulator of structural and functional plasticity in the brain and thus represents a potential candidate to mediate age-related alterations. However, the mechanisms by which p75NTR affects synaptic plasticity of aged neuronal networks and ultimately contribute to deficits in cognitive function have not been well characterized. Here, we report that mutant mice lacking the p75NTR were resistant to age-associated changes in long-term plasticity, associative plasticity, and associative memory. Our study shows that p75NTR is responsible for age-dependent disruption of hippocampal homeostatic plasticity by modulating several signaling pathways, including BDNF, MAPK, Arc, and RhoA-ROCK2-LIMK1-cofilin. p75NTR may thus represent an important therapeutic target for limiting the age-related memory and cognitive function deficits.

Keywords: Late-LTP; aging; hippocampus; p75NTR; synaptic capture; synaptic tagging.


Conflict of interest statement

The authors declare no conflict of interests.

Figures

FIGURE 1
FIGURE 1
Hippocampal p75NTR protein level increased in aging. (a) Western blot analysis of hippocampal p75NTR level between young adult and aged WT mice. (b) Ratio of fold change from Western blot. The p75NTR protein level was significantly increased (p = 0.0001) in aged WT mice compared to young adult WT mice, N = 3 for each group. The values of the individual groups were calculated in relation to the control group, while tubulin serves as a loading control. Asterisk indicates significant differences between groups (unpaired t‐test, ****p < 0.0001). Error bars indicate ± SEM. (c) Representative photomicrographs of p75NTR (red) with MAP2 (green) or GFAP (light blue) or Iba1 (white), and counterstained with DAPI (dark blue) immunohistochemistry in hippocampal CA1 of 6‐week‐old, 12‐month‐old and 18‐month‐old WT mice
FIGURE 2
FIGURE 2
p75NTR KO displayed normal late‐LTP irrespective of age. (a) Schematic representation of a hippocampal slice showing the location of electrodes in the CA1 region. Recording electrode (rec) was positioned onto CA1 apical dendrites flanked by two stimulating electrodes S1 and S2 in the stratum radiatum (sr) to stimulate two independent Schaffer collateral (sc) synaptic inputs to the same neuronal populations. (b) The STET in S1 resulted in a significant potentiation that maintained for 4 h in young adult WT mice (red circles, N = 8). (c) The STET in S1 (red circles) resulted in late‐LTP that was significantly maintained toward the end of the recording in aged WT mice (N = 8). (d) The STET in S1 resulted in a significant potentiation that maintained for 4 h in young adult p75NTR KO mice (red circles, N = 7). (e) STET in S1 (red circles) resulted in a significant potentiation that also maintained for 4 h in aged p75NTR KO mice (N = 8). Control potentials from S2 (blue circles) remained stable during the recording period in all experiments. Analog traces represent typical fEPSPs of inputs S1 and S2 15 min before (solid line), 60 min after (dashed line) tetanization, and at the end of the recording (dotted line). Three solid arrows represent STET for the induction of late‐LTP. Scale bars for all the traces vertical: 2 mV; horizontal: 3 ms. Error bars indicate ± SEM. (f) A histogram of mean fEPSP slope values recorded for young adult WT, aged WT, young adult p75NTR KO, and aged p75NTR KO mice at four different time points: 15 min (baseline), +1 min, +60 min, and +240 min after LTP. At +1 min, the mean fEPSP slope value was significantly smaller in aged WT mice compared to aged p75NTR KO (p = 0.0345). At +60 min, the mean fEPSP slope value was significantly smaller in aged WT mice compared to young adult WT (p = 0.0102), young adult p75NTR KO (p = 0.0200) and aged p75NTR KO mice (p = 0.0032). At +240 min, the mean fEPSP slope value was significantly smaller in aged WT mice compared to young adult WT (p = 0.0275), young adult p75NTR KO (p = 0.0369), and aged p75NTR KO mice (p = 0.0028). (g) A histogram of LTP decay rate (%) measured for young adult WT, aged WT, young adult p75NTR KO, and aged p75NTR KO mice at three different time points: +120 min, +180 min, and +240 min compared to +30 min after LTP. No significant change in LTP decay rate in aged WT mice compared to young adult WT, young adult p75NTR KO, and aged p75NTR KO mice at all three different time points. Asterisk indicates significant differences between groups (two‐way ANOVA, *p < 0.05, **p < 0.01). Error bars indicate ± SEM
FIGURE 3
FIGURE 3
The effect of NMDA receptor antagonist AP5 on LTP in aging and effects of age on NR2A and NR2B levels in the hippocampus. The STET in S1 (red circles) could not induce potentiation in the presence of AP5 (50 μM) in (a) aged WT (N = 6) and (b) aged p75NTR KO (N = 6) mice. Control potentials from S2 (blue circles) remained stable during the recording period in all experiments. Analog traces represent typical fEPSPs of inputs S1 and S2 15 min before (solid line), 60 min after (dashed line) tetanization, and at the end of the recording (dotted line). Three solid arrows represent STET for the induction of late‐LTP. Scale bars for all the traces vertical: 2 mV; horizontal: 3 ms. Error bars indicate ±SEM. (c) Western blot analysis of hippocampal NR2A and NR2B levels between young adult and aged from WT and p75NTR KO mice. (d) Ratio of fold change from Western blot. The NR2A level was significantly decreased in aged WT mice compared to young adult WT (p = 0.0338), young adult p75NTR KO (p = 0.0224), and age p75NTR KO (p = 0.0243) mice, N = 3 for each group. The NR2B level was significantly decreased in aged WT mice compared to young adult WT (p = 0.0060), young adult p75NTR KO (p = 0.0052) and aged p75NTR KO (p = 0.0111) mice, N = 3 for each group. The values of the individual groups were calculated in relation to the control group while tubulin serves as a loading control. Asterisk indicates significant differences between groups (two‐way ANOVA, *p < 0.05, **p < 0.01). Error bars indicate ± SEM
FIGURE 4
FIGURE 4
Aging does not affect basal transmission and neurotransmitter release in hippocampus. (a) Basal synaptic transmission was assayed by measuring fEPSPs within the stratum radiatum of the CA1 region of the hippocampus evoked by a bipolar electrode placed at the CA3‐CA1 border. No significant difference was observed in basal transmission among WT and p75NTR KO mice in both age groups. (b) Paired‐pulse facilitation at the Schaffer collateral CA1 synapse was measured by dividing the amplitude of the second fEPSP by the amplitude of the first elicited by a pair of two 50‐ms spaced stimuli. No significant change was observed in PPF ratio in both age groups between WT and p75NTR KO mice
FIGURE 5
FIGURE 5
p75NTR KO displayed normal NMDAR‐LTD irrespective of age. (a) The WLFS in S1 (red circles) resulted in early‐LTD which gradually returned to baseline in young adult WT mice (N = 7). (b) The WLFS in S1 (red circles) resulted in late‐LTD that was significantly maintained toward the end of the recording in aged WT mice (N = 6). The WLFS in S1 (red circles) resulted in early‐LTD, which gradually returned to baseline in (c) young adult p75NTR KO mice (N = 6) and (d) aged p75NTR KO mice (N = 7). (e) A histogram of mean fEPSP slope values recorded for young adult WT, aged WT, young adult p75NTR KO, and aged p75NTR KO mice at three different time points: 15 min (baseline), +60 min, and +240 min after LTD. At +60 min, the mean fEPSP slope value was significantly smaller in aged WT mice (p = 0.0111) compared to young adult WT. At +240 min, the mean fEPSP slope value was significantly smaller in aged WT mice compared to young adult WT (p = 0.0002), young adult p75NTR KO (p = 0.0026), and aged p75NTR KO mice (p = 0.0017). Asterisk indicates significant differences between groups (two‐way ANOVA, *p < 0.05, **p < 0.01, ***p < 0.001). Error bars indicate ±SEM. The WLFS in S1 (red circles) could not induce depression in the presence of AP5 (50 μM) in (f) aged WT (N = 6) and (g) aged p75NTR KO (N = 7) mice. Control potentials from S2 (blue circles) remained stable during the recording period in all experiments. Analog traces represent typical fEPSPs of inputs S1 and S2 15 min before (solid line), 60 min after (dashed line) tetanization, and at the end of the recording (dotted line). One solid arrow represents WLFS for the induction of early‐LTD. Scale bars for all the traces vertical: 2 mV; horizontal: 3 ms. Error bars indicate ± SEM
FIGURE 6
FIGURE 6
p75NTR KO displayed normal mGluR‐LTD irrespective of age. (a) Bath application of 100 µM DHPG for 20 min resulted in mGluR‐LTD that persisted till the end of the recording in young adult WT, aged WT, young adult p75NTR KO, and aged p75NTR KO mice. (b) A histogram of mean fEPSP slope values recorded for young adult WT, aged WT, young adult p75NTR KO, and aged p75NTR KO mice at three different time points: 15 min (baseline), +60 min, and +240 min after LTD. At +240 min, the mean fEPSP slope value was significantly smaller in aged WT mice compared to young adult WT (p = 0.0120), young adult p75NTR KO (p = 0.0100), and aged p75NTR KO mice (p = 0.0115). Asterisk indicates significant differences between groups (two‐way ANOVA, *p < 0.05). Error bars indicate ± SEM. Bath application of 100 µM DHPG for 20 min in the presence of AP5 (50 μM) resulted in mGluR‐LTD that persisted till the end of the recording in (c) aged WT (N = 6) and (d) aged p75NTR KO (N = 7) mice. Analog traces represent typical fEPSPs of 15 min before (solid line), 60 min after (dashed line) tetanization, and at the end of the recording (dotted line). Scale bars for all the traces vertical: 2 mV; horizontal: 3 ms. Error bars indicate ± SEM
FIGURE 7
FIGURE 7
p75NTR KO displays normal synaptic tagging and capture (STC) irrespective of age. “Strong before weak” paradigm was used to study STC. (a) Both STET in S1 (red circles) and WTET in S2 (blue circles) resulted in a significant potentiation that maintained till the end of recording in young adult WT mice (N = 7). (b) Both STET in S1 (red circles) and WTET in S2 (blue circles) resulted in early‐LTP that was not reinforced into late‐LTP in aged WT mice (N = 7). (c) Both STET in S1 (red circles) and WTET in S2 (blue circles) resulted in a significant potentiation that maintained till the end of experiment in young adult p75NTR KO mice (N = 8). (d) Both STET in S1 (red circles) and WTET in S2 (blue circles) resulted in a significant potentiation that maintained till the end of recording in aged p75NTR KO mice (N = 8). Control potentials from S2 (blue circles) remained stable during the recording period in all experiments. Scale bars for all the traces vertical: 2 mV; horizontal: 3 ms. Error bars indicate ± SEM. Symbols and analog traces as in Figure 1. (e) A histogram of mean fEPSP slope values recorded for young adult WT, aged WT, young adult p75NTR KO, and aged p75NTR KO mice at three different time points: 15 min (baseline), +60 min, and +240 min after late‐LTP for STC. At +240 min, the mean fEPSP slope value was significantly smaller in aged WT mice compared to young adult WT (p = 0.0489), young adult p75NTR KO (p = 0.0143) and aged p75NTR KO mice (p = 0.0020). (f) A histogram of mean fEPSP slope values recorded for young adult WT, aged WT, young adult p75NTR KO and aged p75NTR KO mice at three different time points: 15 min (baseline), +60 min, and +240 min after early‐LTP for STC. At +240 min, the mean fEPSP slope value was significantly smaller in aged WT mice compared to young adult WT (p = 0.0016), young adult p75NTR KO (p = 0.0023), and aged p75NTR KO mice (p = 0.0001). Asterisk indicates significant differences between groups (two‐way ANOVA, *p < 0.05, **p < 0.01, ***p < 0.001). Error bars indicate ± SEM
FIGURE 8
FIGURE 8
p75NTR KO displays normal associative memory irrespective of age. (a) Schematic diagram of behavioral tagging experiment protocol. A mouse was being placed in a novel environment/open field (OF) for 10 min within 1 hour before weak inhibitory avoidance (IA). Step‐down latency was tested at 1 h, 24 h, and 7 d post‐IA. (b) Associative memory was impaired in aged WT mice. Associative memory was, however, normal in aged p75NTR KO mice. Asterisks indicate significant differences between groups (two‐way ANOVA, *p < 0.05, **p < 0.01). Error bars indicate ± SEM
FIGURE 9
FIGURE 9
Effects of age on BDNF and NGF levels, and apoptosis in the hippocampus. (a) Western blot analysis of hippocampal BDNF levels between young adult and aged from WT and p75NTR KO mice. (b) Western blot analysis of hippocampal NGF levels between young adult and aged from WT and p75NTR KO mice. (c) Ratio of fold change from Western blot. The proBDNF level was significantly increased in aged WT mice compared to young adult WT (p = 0.0060), young adult p75NTR KO (p = 0.0052), and aged p75NTR KO mice (p = 0.0111), N = 4 for each group. No significant difference in mature BDNF level from aged WT mice compared to young adult WT, young adult p75NTR KO, and aged p75NTR KO mice, N = 4, for each group. No significant change in the levels of NGF from aged WT mice compared to young adult WT, young adult p75NTR KO, and aged p75NTR KO mice, N = 3 for each group. The values of the individual groups were calculated in relation to the control group, while tubulin serves as a loading control. Asterisk indicates significant differences between groups (two‐way ANOVA, *p < 0.05, **p < 0.01). Error bars indicate ± SEM. (d) Representative photomicrographs of TUNEL staining (green) and counterstained with DAPI (dark blue) immunohistochemistry in hippocampus of aged WT and p75NTR KO mice. (e) Quantitation of relative immunofluorescence intensity of TUNEL signal was shown as a bar graph. The fold change of TUNEL fluorescence in aged WT mice was significantly higher (p = 0.0336) than aged p75NTR KO mice, N = 3 for each group. Asterisk indicates significant differences between groups (unpaired t‐test, *p < 0.05). Error bars indicate ± SEM
FIGURE 10
FIGURE 10
Effects of age on p38 and ERK1/2 levels in the hippocampus. (a) Western blot analysis of hippocampal p38 and ERK1/2 levels between young adult and aged from WT and p75NTR KO mice. (b) Ratio of fold change from Western blot. The phospho/total p38 ratio was significantly increased in aged WT mice compared to young adult WT (p = 0.0221), young adult p75NTR KO (p = 0.0462), and age p75NTR KO (p = 0.0162) mice, N = 3 for each group. The phospho/total ERK1/2 ratio was significantly decreased in aged WT mice compared to young adult WT (p = 0.0299), young adult p75NTR KO (p = 0.0088), and aged p75NTR KO (p = 0.0447) mice, N = 3 for each group. The values of the individual groups were calculated in relation to the control group, while tubulin serves as a loading control. Asterisk indicates significant differences between groups (two‐way ANOVA, *p < 0.05, **p < 0.01). Error bars indicate ± SEM
FIGURE 11
FIGURE 11
Effects of age on RhoA, ROCK2, LIMK1, cofilin, and Arc levels in the hippocampus. (a) Western blot analysis of hippocampal RhoA level between young adult and aged from both WT and p75NTR KO mice. (b) Ratio of fold change from Western blot. The RhoA level was significantly increased in aged WT mice compared to young adult WT (p = 0.0338), young adult p75NTR KO (p = 0.0206), and aged p75NTR KO (p = 0.0488) mice, N = 4 for each group. (c) ELISA analysis of hippocampal RhoA‐GTP activity between young adult and aged from both WT and p75NTR KO mice. The RhoA‐GTP activity was significantly increased in aged WT mice compared to young adult WT (p = 0.0002), young adult p75NTR KO (p = 0.0021), and aged p75NTR KO (p = 0.0192) mice, N = 5 for each group. (d) Western blot analysis of hippocampal ROCK2, LIMK1, cofilin, and Arc levels between young adult and aged from both WT and p75NTR KO mice. (e) Ratio of fold change from Western blot. The ROCK2 level was significantly increased in aged WT mice compared to young adult WT (p = 0.0012), young adult p75NTR KO (p = 0.0085), and aged p75NTR KO (p = 0.0135) mice, N = 4 for each group. The phosphorylated LIMK1 protein level was significantly decreased in aged WT mice compared to young adult WT (p = 0.0111), young adult p75NTR KO (p = 0.0223), and aged p75NTR KO (p = 0.0091) mice, N = 3 for each group. The phosphorylated cofilin level was significantly decreased in aged WT mice compared to young adult WT (p = 0.0499), young adult p75NTR KO (p = 0.0201), and aged p75NTR KO (p = 0.0427) mice, N = 3 for each group. The Arc level was significantly decreased in aged WT mice compared to young adult WT (p = 0.0008), young adult p75NTR KO (p = 0.0002), and aged p75NTR KO (p = 0.0017) mice, N = 4 for each group. The values of the individual groups were calculated in relation to the control group, while tubulin serves as a loading control. Asterisk indicates significant differences between groups (two‐way ANOVA, *p < 0.05, **p < 0.01, ***p < 0.001). Error bars indicate ± SEM
FIGURE 12
FIGURE 12
The molecular mechanism of p75NTR in regulating age‐associated changes in the homeostatic of synaptic plasticity. This cartoon depicts the signaling pathway by p75NTR in mediating synaptic plasticity changes in aging. Aging increases proBDNF without affecting mature BDNF. ProBDNF has been implicated in facilitating LTD. Aging also modulates MAPK pathway by upregulating p38 activity while downregulating ERK1/2 activity. Both p38 and ERK1/2 pathways are important in regulating Arc gene transcription. Aging decreases Arc protein and thus, affecting the maintenance of LTP and LTM consolidation through regulation of actin dynamics. In addition, aging increases RhoA level leading to an increase in ROCK2 activity. This reduces both LIMK1 and cofilin phosphorylation. Modulation of cofilin activity is essential for the reorganization of the actin cytoskeleton and influences synaptic plasticity. As a whole, p75NTR responsible for the age‐mediated disruption of hippocampal homeostatic long‐term plasticity by modulating several signaling pathways, including BDNF, MAPK, Arc, and RhoA‐ROCK2‐LIMK1‐cofilin, leading to deficits in STC and associative memory. Red arrow indicates increases. Green arrow indicates decreases. Orange equals sign indicates no change

References

    1. Arias‐Cavieres, A. , Adasme, T. , Sánchez, G. , Muñoz, P. , & Hidalgo, C. (2017). Aging impairs hippocampal‐dependent recognition memory and LTP and prevents the associated RyR up‐regulation. Frontiers in Aging Neuroscience, 9, 111. - PMC - PubMed
    1. Bach, M. E. , Barad, M. , Son, H. , Zhuo, M. , Lu, Y.‐F. , Shih, R. , Mansuy, I. , Hawkins, R. D. , & Kandel, E. R. (1999). Age‐related defects in spatial memory are correlated with defects in the late phase of hippocampal long‐term potentiation in vitro and are attenuated by drugs that enhance the cAMP signaling pathway. Proceedings of the National Academy of Sciences, 96, 5280–5285. - PMC - PubMed
    1. Bachis, A. , Wenzel, E. , Boelk, A. , Becker, J. , & Mocchetti, I. (2016). The neurotrophin receptor p75 mediates gp120‐induced loss of synaptic spines in aging mice. Neurobiology of Aging, 46, 160–168. - PMC - PubMed
    1. Bamburg, J. R. , & Bernstein, B. W. (2010). Roles of ADF/cofilin in actin polymerization and beyond. F1000 Biology Reports, 2, 1–7. - PMC - PubMed
    1. Barnes, C. A. , & McNaughton, B. L. (1980). Physiological compensation for loss of afferent synapses in rat hippocampal granule cells during senescence. The Journal of Physiology, 309, 473–485. - PMC - PubMed

Publication types

Substances