

Comparison of Saliva and Nasopharyngeal Swab Nucleic Acid Amplification Testing for Detection of SARS-CoV-2: A Systematic Review and Meta-analysis
- PMID: 33449069
- PMCID: PMC7811189
- DOI: 10.1001/jamainternmed.2020.8876
Comparison of Saliva and Nasopharyngeal Swab Nucleic Acid Amplification Testing for Detection of SARS-CoV-2: A Systematic Review and Meta-analysis
Erratum in
-
Error in the Byline.JAMA Intern Med. 2021 Mar 1;181(3):409. doi: 10.1001/jamainternmed.2021.0245. JAMA Intern Med. 2021. PMID: 33646283 Free PMC article. No abstract available.
Abstract
Importance: Nasopharyngeal swab nucleic acid amplification testing (NAAT) is the noninvasive criterion standard for diagnosis of coronavirus disease 2019 (COVID-19). However, it requires trained personnel, limiting its availability. Saliva NAAT represents an attractive alternative, but its diagnostic performance is unclear.
Objective: To assess the diagnostic accuracy of saliva NAAT for COVID-19.
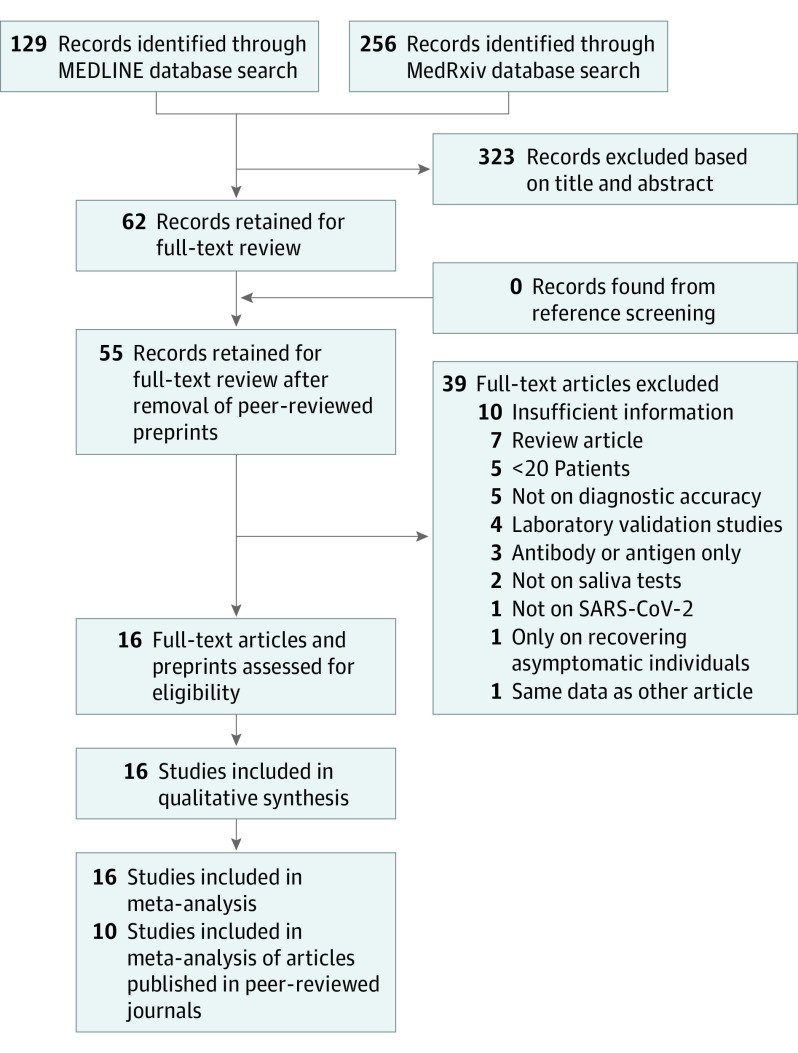
Data sources: In this systematic review, a search of the MEDLINE and medRxiv databases was conducted on August 29, 2020, to find studies of diagnostic test accuracy. The final meta-analysis was performed on November 17, 2020.
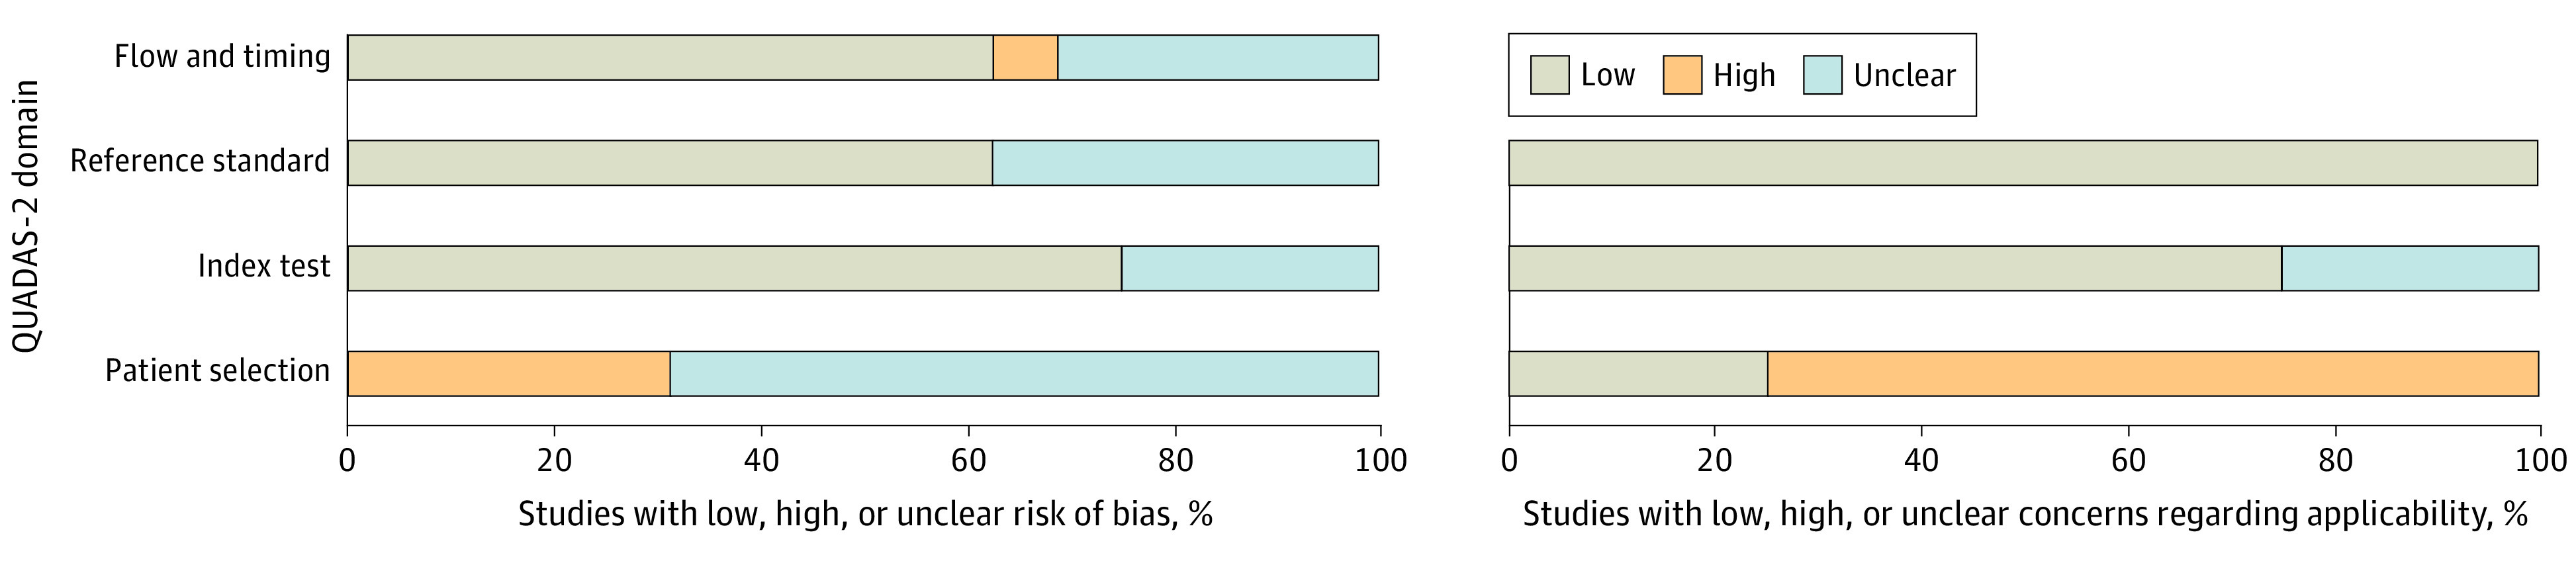
Study selection: Studies needed to provide enough data to measure salivary NAAT sensitivity and specificity compared with imperfect nasopharyngeal swab NAAT as a reference test. An imperfect reference test does not perfectly reflect the truth (ie, it can give false results). Studies were excluded if the sample contained fewer than 20 participants or was neither random nor consecutive. The Quality Assessment of Diagnostic Accuracy Studies 2 tool was used to assess the risk of bias.
Data extraction and synthesis: Preferred Reporting Items for Systematic Reviews and Meta-analyses reporting guideline was followed for the systematic review, with multiple authors involved at each stage of the review. To account for the imperfect reference test sensitivity, we used a bayesian latent class bivariate model for the meta-analysis.
Main outcomes and measures: The primary outcome was pooled sensitivity and specificity. Two secondary analyses were performed: one restricted to peer-reviewed studies, and a post hoc analysis limited to ambulatory settings.
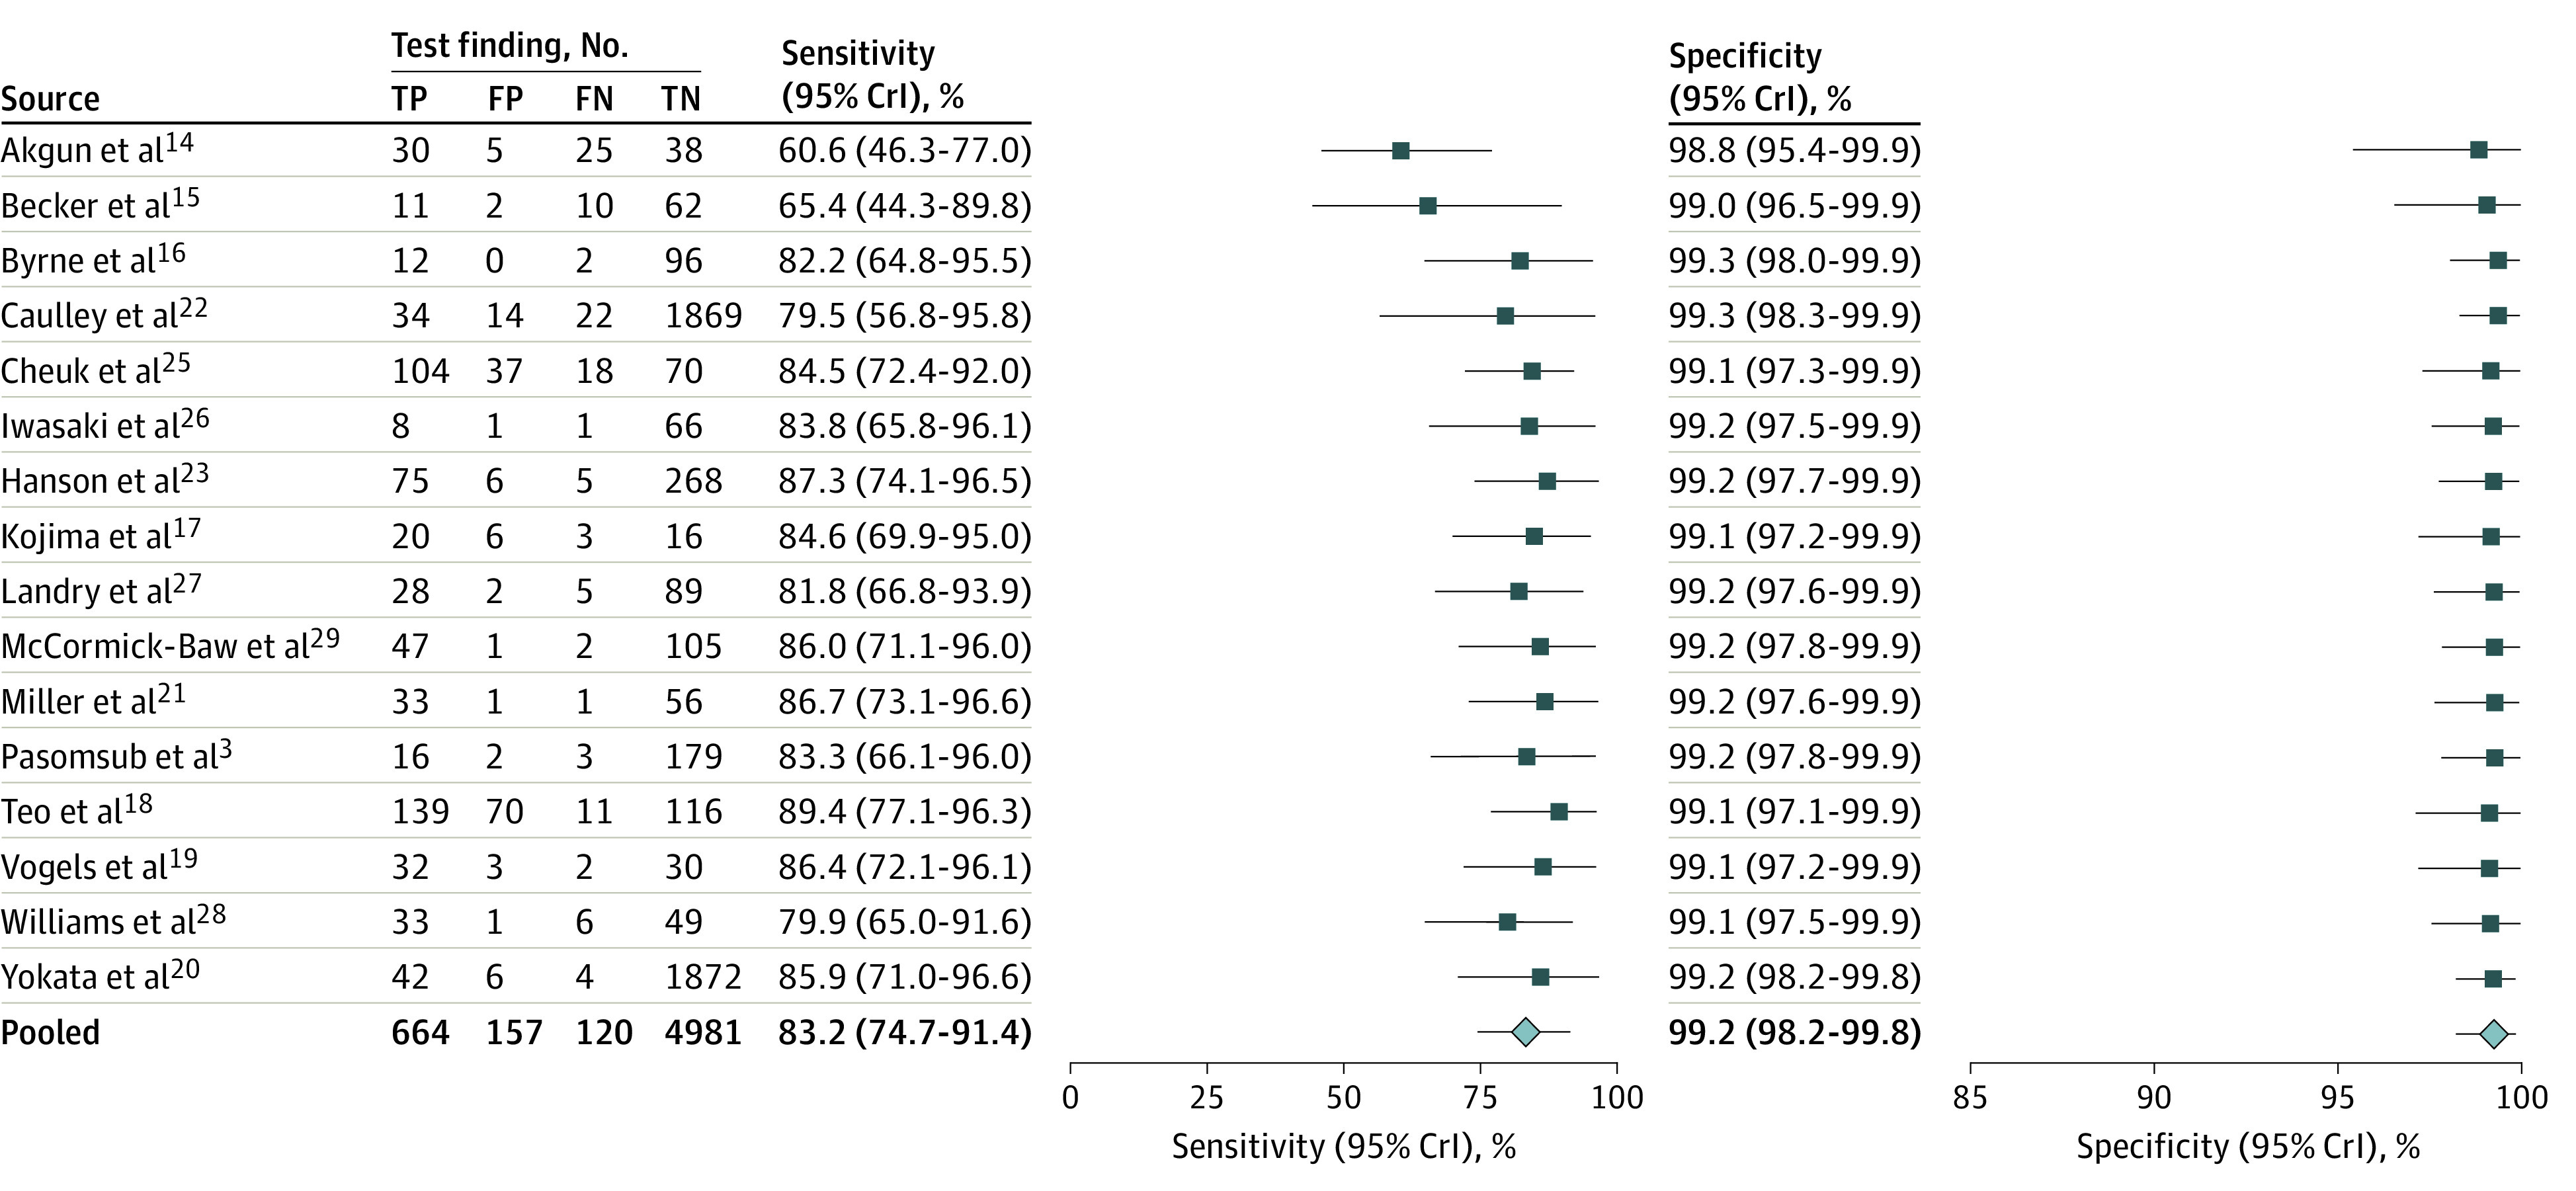
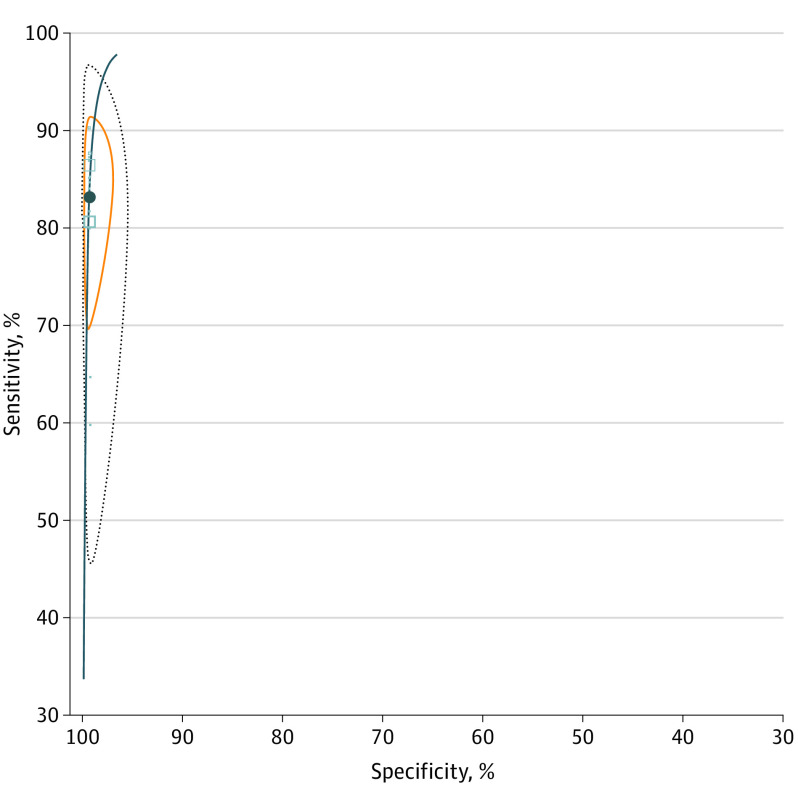
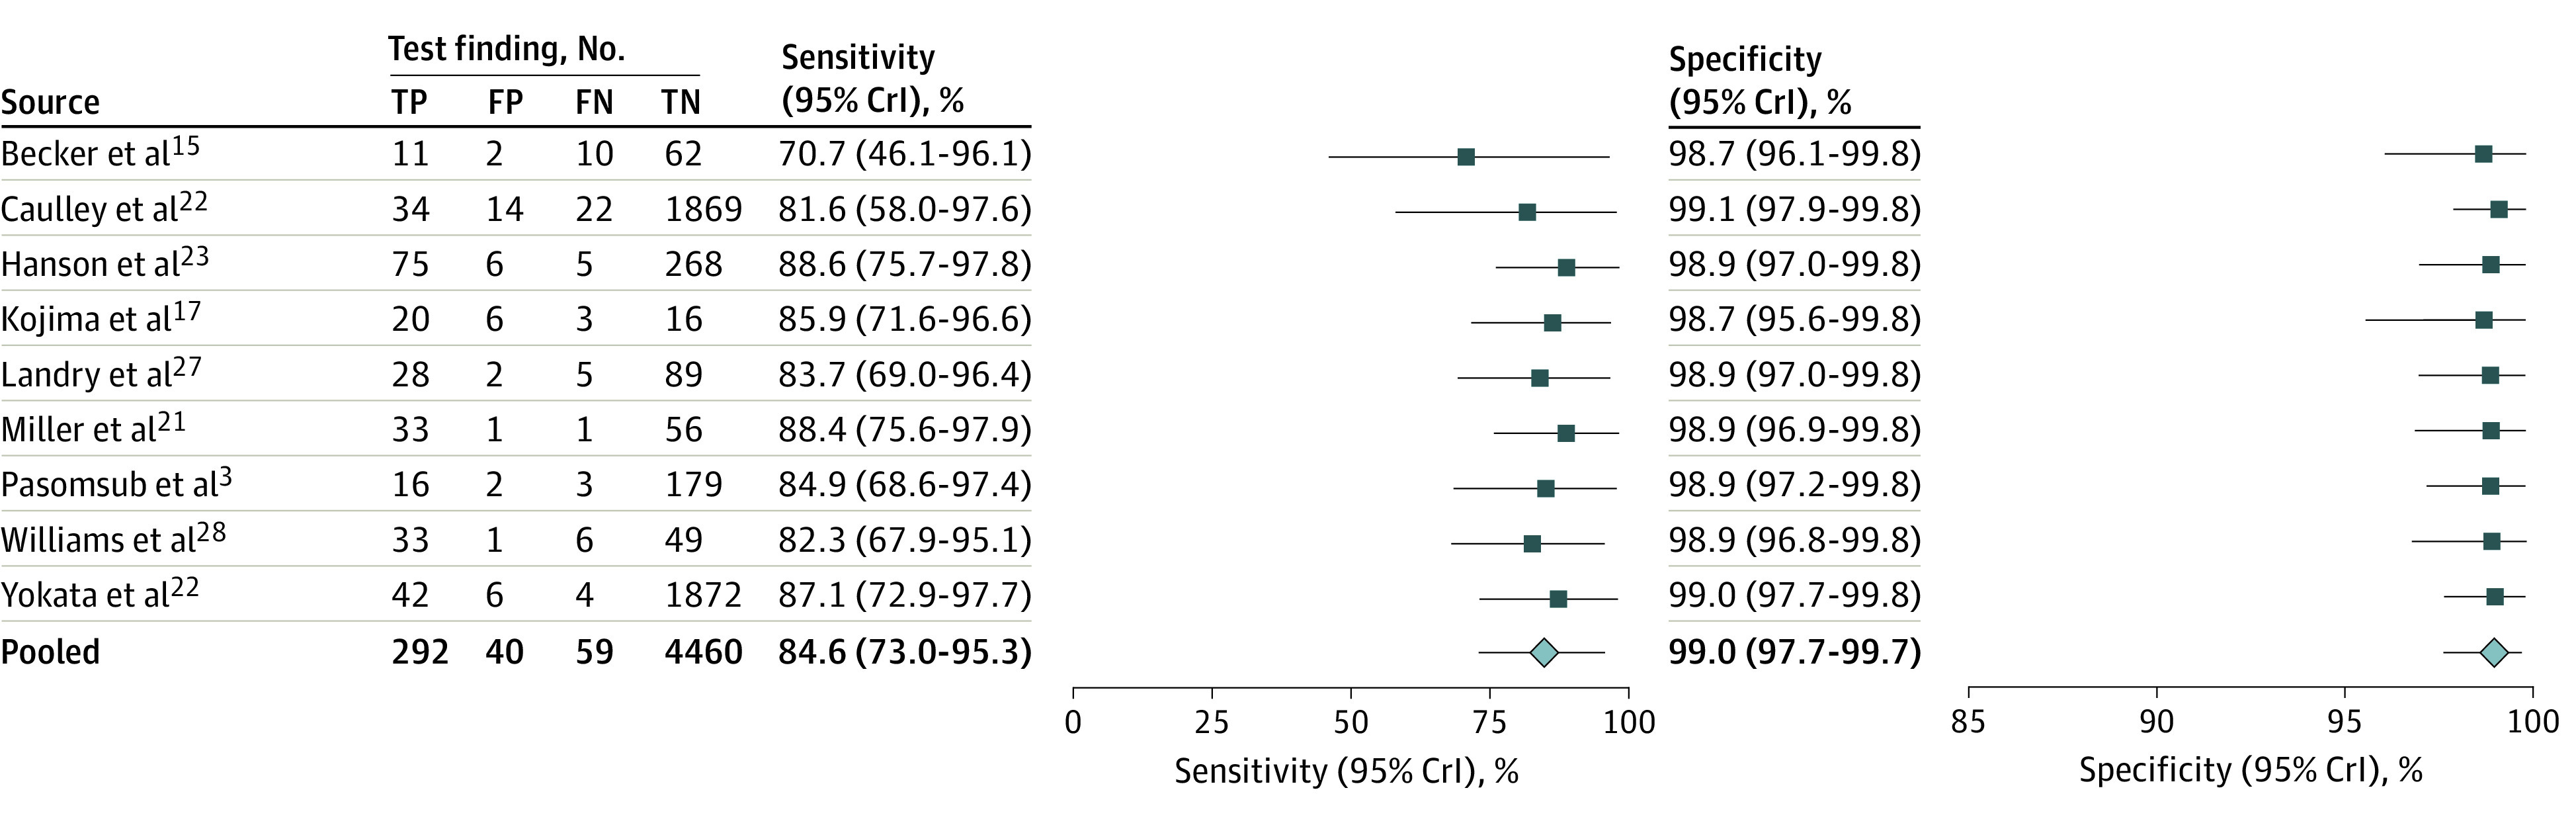
Results: The search strategy yielded 385 references, and 16 unique studies were identified for quantitative synthesis. Eight peer-reviewed studies and 8 preprints were included in the meta-analyses (5922 unique patients). There was significant variability in patient selection, study design, and stage of illness at which patients were enrolled. Fifteen studies included ambulatory patients, and 9 exclusively enrolled from an outpatient population with mild or no symptoms. In the primary analysis, the saliva NAAT pooled sensitivity was 83.2% (95% credible interval [CrI], 74.7%-91.4%) and the pooled specificity was 99.2% (95% CrI, 98.2%-99.8%). The nasopharyngeal swab NAAT had a sensitivity of 84.8% (95% CrI, 76.8%-92.4%) and a specificity of 98.9% (95% CrI, 97.4%-99.8%). Results were similar in secondary analyses.
Conclusions and relevance: These results suggest that saliva NAAT diagnostic accuracy is similar to that of nasopharyngeal swab NAAT, especially in the ambulatory setting. These findings support larger-scale research on the use of saliva NAAT as an alternative to nasopharyngeal swabs.
Conflict of interest statement
Figures
References
-
- Jamal AJ, Mozafarihashjin M, Coomes E, et al. ; Toronto Invasive Bacterial Diseases Network COVID-19 Investigators . Sensitivity of nasopharyngeal swabs and saliva for the detection of severe acute respiratory syndrome coronavirus 2 (SARS-CoV-2). Clin Infect Dis. 2020;ciaa848. doi: 10.1093/cid/ciaa848 - DOI - PMC - PubMed
Publication types
MeSH terms
LinkOut - more resources
Full Text Sources
Other Literature Sources
Medical
Miscellaneous
