. 2021 Jan;129(1):17007.
doi: 10.1289/EHP7699. Epub 2021 Jan 15.

DNA Methylation Patterns in CD4+ T Cells of Naïve and Influenza A Virus-Infected Mice Developmentally Exposed to an Aryl Hydrocarbon Receptor Ligand

Affiliations

DNA Methylation Patterns in CD4+ T Cells of Naïve and Influenza A Virus-Infected Mice Developmentally Exposed to an Aryl Hydrocarbon Receptor Ligand

Catherine G Burke et al. Environ Health Perspect. 2021 Jan.

Abstract

Background: Early life environmental exposures can have lasting effects on the function of the immune system and contribute to disease later in life. Epidemiological studies have linked early life exposure to xenobiotics that bind the aryl hydrocarbon receptor (AhR) with dysregulated immune responses later in life. Among the immune cells influenced by developmental activation of the AhR are CD4+ T cells. Yet, the underlying affected cellular pathways via which activating the AhR early in life causes the responses of CD4+ T cells to remain affected into adulthood remain unclear.

Objective: Our goal was to identify cellular mechanisms that drive impaired CD4+ T-cell responses later in life following maternal exposure to an exogenous AhR ligand.

Methods: C57BL/6 mice were vertically exposed to the prototype AhR ligand, 2,3,7,8-tetrachlorodibenzo-p-dioxin (TCDD), throughout gestation and early postnatal life. The transcriptome and DNA methylation patterns were evaluated in CD4+ T cells isolated from naïve and influenza A virus (IAV)-infected adult mice that were developmentally exposed to TCDD or vehicle control. We then assessed the influence of DNA methylation-altering drug therapies on the response of CD4+ T cells from developmentally exposed mice to infection.

Results: Gene and protein expression showed that developmental AhR activation reduced CD4+ T-cell expansion and effector functions during IAV infection later in life. Furthermore, whole-genome bisulfite sequencing analyses revealed that developmental AhR activation durably programed DNA methylation patterns across the CD4+ T-cell genome. Treatment of developmentally exposed offspring with DNA methylation-altering drugs alleviated some, but not all, of the impaired CD4+ T-cell responses.

Discussion: Taken together, these results indicate that skewed DNA methylation is one of the mechanisms by which early life exposures can durably change the function of T cells in mice. Furthermore, treatment with DNA methylation-altering drugs after the exposure restored some aspects of CD4+ T-cell functional responsiveness. https://doi.org/10.1289/EHP7699.


Figures
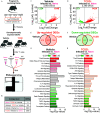
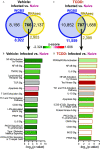
Figure 1A is a flowchart depicting gene expression profiles of infected mice. An arrow is pointing toward the right with a text that reads, gestational day 0, gestational day 7, gestational day 14, and postnatal day 2 administrated 1 microgram 2,3,7,8-tetrachlorodibenzo-p-dioxin per kilogram body weight with vehicle (peanut oil). After 6 to 10 weeks, the developmentally exposed adults in vehicle and 2,3,7,8-tetrachlorodibenzo-p-dioxin groups with T helper cells from lymph nodes of naïve or influenza A virus infected offspring lead to Ribonucleic acid sequencing. Figure 1B is a tabular representation having two columns and four rows, namely, comparison and differentially expressed genes. Row 1: Naive: 2,3,7,8-tetrachlorodibenzo-p-dioxin versus vehicle and 0; Row 2: Infected: 2,3,7,8-tetrachlorodibenzo-p-dioxin versus vehicle and 163; Row 3: Vehicle: Infected versus Naive and 2,903; and 2,3,7,8-tetrachlorodibenzo-p-dioxin: Infected versus Naive and 2,395. Figures 1C and 1D are Volcano plots titled Vehicle: infected versus naive, 2,903 differentially expressed genes and 2,3,7,8-tetrachlorodibenzo-p-dioxin: infected versus naïve, 2,395 differentially expressed genes plotting negative log to the base 10 of (adjusted lowercase p), ranging from 0 to 80 in increments of 20 (y-axis) across log to the base 2 of fold change, ranging from negative 1 to 2 in unit increments (x-axis) for 1,254 and 1,649 asterisk in vehicle: infected versus naive, 2,903 differentially expressed genes and 971 and 1,424 asterisk in 2,3,7,8-tetrachlorodibenzo-p-dioxin: infected versus naïve, 2,395 differentially expressed genes. Figures 1E and 1F are Venn diagrams titled Up-regulated differentially expressed genes and down-regulated differentially expressed genes. The circle on the left is labeled vehicle: 579 and 667, respectively, and the one on the right is labeled 2,3,7,8-tetrachlorodibenzo-p-dioxin: 354 and 384, respectively. Both dots intersect and the intersection area is labeled, 1,070 and 587, respectively. Figures 1G and 1H are horizontal bar graphs titled Vehicle: infected versus naive and 2,3,7,8-Tetrachlorodibenzo-p-dioxin: infected versus naïve plotting (Figure 1G) T cell exhaustion, Mitotic Roles of Polo-Like Kinase, Th1 Pathway, Th2 Pathway, Ataxia Telangiectasia Mutated Protein Signaling, Apoptosis Signaling, DNA Damage Response, Th1 and Th2 Activation, T Helper Differentiation, Chromosomal Replication, Interleukin-10 Signaling, Cell Cycle: second growth phase and mitosis, Leukocyte Extravasation, Nuclear Factor Kappa-Light-Chain-Enhancer of Activated B cells Activation by Viruses, Inducible Nitric Oxide Synthase Signaling, Death Receptor Signaling, Cell Cycle Control, Tumor necrosis factor receptor 1 Signaling, Tumor necrosis factor receptor 2 Signaling, and Sumoylation Pathway, and (Figure 1H) T Cell Exhaustion, Th1 Pathway, Th2 Pathway, Oxidative Stress Response, Inducible T-Cell Costimulator–Inducible T-Cell Costimulator Ligand Signaling, Ataxia Telangiectasia Mutated Protein Signaling, Type I Diabetes Signaling, Th1 and Th2 Pathway, T Helper Differentiation, Chromosomal Replication, Interleukin-10 Signaling, Rheumatoid Arthritis Signaling, Apoptosis Signaling, Inducible Nitric Oxide Synthase Signaling, DNA Damage Response, Interleukin-6 Signaling, CD40 Signaling, Tumor necrosis factor receptor 2 Signaling, Cell Cycle: second growth phase and mitosis, and Cell Cycle: control (y-axis) across negative log 10 of (lowercase p value), ranging from 0 to 15 in increments of 5 (x-axis), respectively. There is a color scale titled lowercase z score ranging from negative 2.524 to 2.92 for Figures 1G and 1H.
Figure 1.
Gene expression profiles in CD4+ T cells of naïve or influenza A virus (IAV)-infected mice developmentally exposed to vehicle or TCDD. (A) Pregnant mice were administered vehicle or TCDD (1μg/kg body weight) on GD0, 7, and 14 and 2 d after parturition. CD4+ T cells from lymph nodes of naïve or IAV-infected offspring (8–10 wk of age) were purified, RNA was isolated, and RNA-sequencing (RNA-seq) was performed. For immunologically naïve offspring, peripheral lymph nodes from a single mouse were combined, and there were a total of three replicates per treatment group, with 1 offspring from unique dams used per replicate, and 6 total mice used. For IAV-infected offspring, the mediastinal lymph nodes were used. Mice were sacrificed 9 d after infection, and there were three replicates per treatment group, with 4–6 offspring in each unique pool of cells for a total of 30 total mice used. (B) All of the mice (naïve and infected) were sacrificed on the same day with CD4+ T-cell purification, RNA isolation, and RNA-seq performed in parallel. The number of differentially expressed genes (DEGs) was assessed. (C,D) Volcano plots of DEGs. On each plot, the direction of change indicates increased (right; red) or decreased (left; green) gene expression with infection compared with CD4+ T cells from immunologically naïve (C) vehicle or (D) TCDD developmentally exposed mice. (E) Venn diagram of the number of DEGs that were up-regulated in both vehicle and TCDD groups, or uniquely up-regulated in only one group. (F) Venn diagram of the number of DEGs that were down-regulated by both vehicle and TCDD exposure, or uniquely down-regulated in only one group. (G,H) Ingenuity Pathway Analysis was used to identify cellular pathways affected by DEGs identified in (C) and (D). T-cell relevant pathways were ranked according to z-score, in descending order of highest to lowest z-score. Graphs depict pathways from (G) IAV-infected vs. naïve vehicle offspring or (H) IAV-infected vs. naïve TCDD offspring. The x-axes denote log(p-value) for each pathway. Pathways were plotted according to z-score, with highest z-scores at the top (red) to lowest at the bottom (green). Gray bars were used when a z-score was not predicted. Numerical details are provided in Table S1. Graphic art in (A) was manually created or adapted from Servier Medical Art templates (https://smart.servier.com) and licensed under the Creative Commons Attribution 3.0 Unported License agreement (https://creativecommons.org/licenses/by/3.0/). Note: ATM, ataxia telangiectasia mutated protein; BW, body weight; GD, gestational day; IL, interleukin; iCOS, inducible T-cell costimulator; iCOSL, inducible T-cell costimulator ligand; iNOS, inducible nitric oxide synthase; NF-κB, nuclear factor kappa-light-chain-enhancer of activated B cells; PND, postnatal day; TCDD, 2,3,7,8-tetrachlorodibenzo-p-dioxin; Th, T helper; TNFR, tumor necrosis factor receptor.
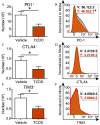
Figures 2A, 2C, and 2E are bar graphs plotting number (10 begin superscript 4 end superscript), ranging from 0 to 20 in increments of 5; 0.0 to 1.5 in increments of 0.5; and 0.0 to 1.5 in increments of 0.5 (y-axis) across vehicle and 2,3,7,8-tetrachlorodibenzo-p-dioxin (x-axis) for programmed cell death protein 1 positive, cytotoxic T-lymphocyte-associated protein 4 positive, and T cell immunoglobulin and mucin domain-containing protein 3 positive, respectively. Figures 2B, 2D, and 2F are area charts plotting normalized to mode, ranging from 0 to 100 in increments of 20 (y-axis) across programmed cell death protein 1, ranging 0, 10 begin superscript 3 end superscript, 10 begin superscript 4 end superscript, and 10 begin superscript 5 end superscript; cytotoxic T-lymphocyte-associated protein 4, ranging from negative 10 begin superscript 3 end superscript, 0, 10 begin superscript 3 end superscript, 10 begin superscript 4 end superscript, and 10 begin superscript 5 end superscript; and T cell immunoglobulin and mucin domain-containing protein 3, ranging from 0, 10 begin superscript 3 end superscript, 10 begin superscript 4 end superscript, and 10 begin superscript 5 end superscript (x-axis) for vehicle: 56.1 plus or minus 2.2; 3.41 plus or minus 0.5; 4.09 plus or minus 0.2 and 2,3,7,8-tetrachlorodibenzo-p-dioxin: 46.9 plus or minus 2.1; 3.21 plus or minus 0.3; and 3.80 plus or minus 0.2, respectively.
Figure 2.
Exhaustion markers on CD4+ T cells during IAV infection following developmental AhR activation via maternal exposure to TCDD or vehicle. Vehicle (7 mice) or TCDD (8 mice) developmentally exposed mice were infected with IAV at maturity (6–8 wk of age). Nine days after infection, mice were euthanized and mediastinal lymph node cells stained for flow cytometry. (A,C,E) Bar graphs show the mean number of CD44hiCD4+ T cells from each exposure group that expressed (A) PD1, (C) CTLA4, or (E) TIM3. (B,D,F) Histograms depict the percentage of CD44hiCD4+ T cells from vehicle (gray solid line) or TCDD (orange dashed line) exposure groups that express (B) PD1, (D) CTLA4, or (F) TIM3. All values are mean±SEM. The numerical information, including p-values, are provided in Table S2. All offspring within a treatment group were from separate dams. *, p0.05, using Student’s t-test. Note: AhR, aryl hydrocarbon receptor; CTLA-4, cytotoxic T-lymphocyte-associated protein 4; IAV, influenza A virus; PD1, programmed cell death protein 1; SEM, standard error of the mean; T, TCDD; TCDD, 2,3,7,8-tetrachlorodibenzo-p-dioxin; TIM3, T-cell immunoglobulin and mucin domain-3; V, vehicle.
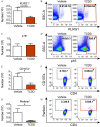
Figures 3A, 3C, 3E, and 3G are bar graphs plotting number (10 begin superscript 3 end superscript), ranging from 0.0 to 2.5 in increments of 0.5; number (10 begin superscript 4 end superscript), ranging from 0.0 to 1.5 in increments of 0.5; number (10 begin superscript 4 end superscript), ranging from 0 to 5 in unit increments; number (10 begin superscript 4 end superscript), ranging from 0.0 to 2.0 in increments of 0.5 (y-axis) across vehicle and 2,3,7,8-tetrachlorodibenzo-p-dioxin (x-axis) for Killer cell lectin-like receptor subfamily G member 1 positive, lowercase p equals 0.053; p16 positive; lysosomal-associated membrane protein-1 positive asterisk; and Perforin positive asterisk, respectively. Figure 3B is set of two scatter plot graphs plotting side scatter area, ranging from 0 to 250 thousand in increments of 50 thousand (y-axis) across Killer cell lectin-like receptor subfamily G member 1, ranging from 0, 10 begin superscript 2 end superscript, 10 begin superscript 3 end superscript, 10 begin superscript 4 end superscript, and 10 begin superscript 5 end superscript (x-axis) for vehicle: 0.91 plus or minus 0.10 and 2,3,7,8-tetrachlorodibenzo-p-dioxin: 0.7 plus or minus 0.04 asterisk. Figure 3D is a set of two scatter plot graphs plotting side scatter area, ranging from 0 to 250 thousand in increments of 50 thousand (y-axis) across p16, ranging from 0, 10 begin superscript 2 end superscript, 10 begin superscript 3 end superscript, 10 begin superscript 4 end superscript, and 10 begin superscript 5 end superscript (x-axis) for vehicle: 4.6 plus or minus 0.3 and 2,3,7,8-tetrachlorodibenzo-p-dioxin: 7.6 plus or minus 0.8 asterisk. Figure 3F is a set of two scatter plot graphs plotting lysosomal-associated membrane protein-1, ranging from negative 10 begin superscript 2 end superscript, 0, 10 begin superscript 2 end superscript, 10 begin superscript 3 end superscript, 10 begin superscript 4 end superscript, and 10 begin superscript 5 end superscript (y-axis) across cluster of differentiation 4 positive, ranging 0, 10 begin superscript 2 end superscript, 10 begin superscript 3 end superscript, 10 begin superscript 4 end superscript, and 10 begin superscript 5 end superscript (x-axis) for vehicle: 8.7 plus or minus 0.7 and 2,3,7,8-tetrachlorodibenzo-p-dioxin: 6.0 plus or minus 0.8 asterisk. Figure 3H is a set of two scatter plot graphs plotting Perforin, ranging from 0, 10 begin superscript 2 end superscript, 10 begin superscript 3 end superscript, 10 begin superscript 4 end superscript, and 10 begin superscript 5 end superscript (y-axis) across cluster of differentiation 4 positive, ranging 0, 10 begin superscript 2 end superscript, 10 begin superscript 3 end superscript, 10 begin superscript 4 end superscript, and 10 begin superscript 5 end superscript (x-axis) for vehicle: 2.3 plus or minus 0.6 and 2,3,7,8-tetrachlorodibenzo-p-dioxin: 0.8 plus or minus 0.1 asterisk.
Figure 3.
Evaluation of senescence-associated characteristics of CD4+ T cells from the offspring of vehicle and TCDD-treated dams during IAV infection. Adult (6–8 wk of age) developmentally exposed mice were infected with IAV. Mediastinal lymph nodes (MLNs) were analyzed 9 d after infection. (A,C,E,G) The number of CD4+ T cells from vehicle (7 mice) or TCDD (8 mice for KLRG1 and p16; 3 mice for CD107a and perforin) developmentally exposed offspring that express (A) KLRG1, (C) p16, (E) CD107a, or (F) perforin are shown as bar graphs. (B,D,F,H) Scatter plots show the percentage of (B) p16+, (D) KLRG1+, (F) CD107a+, or (H) perforin+ CD4+ T cells from infected mice that were developmentally exposed to vehicle (left) or TCDD (right). The numerical information is provided in Table S2. All offspring within a group were from separate dams. Values are mean±SEM. *, p 0.05, using Student’s t-test. Note: CD107a, lysosomal-associated membrane protein 1; IAV, influenza A virus; KLRG1, killer cell lectin-like receptor subfamily G member 1; p16, cyclin-dependent kinase inhibitor 2A; SEM, standard error of the mean; SSC-A, side scatter area; TCDD, 2,3,7,8-tetrachlorodibenzo-p-dioxin.
Figure 4A is a flow chart depicting developmentally exposed mice during primary and secondary responses to Influenza A virus having three steps. Step 1: Naive adult offspring divided into two categories: vehicle and 2,3,7,8-tetrachlorodibenzo-p-dioxin. Step 2: Step 1 with HKx31 Influenza A virus infection on day 0 leads to primary Influenza A virus infection on day 9. Step 3: Step 2 with PR8 Influenza A virus infection leads to secondary Influenza A virus infection on day 86. Figures 4B, 4C, and 4D are bar graphs titled Naïve, Primary infection, Secondary infection plotting number per lymph nodes (10 begin superscript 4 end superscript), ranging from 0 to 0.1 in unit increment and 0.6 to 1.0 in in increments of 0.2; number per mediastinal lymph nodes (10 begin superscript 4 end superscript), ranging from 0.0 to 1.0 in increments of 0.2; and number per mediastinal lymph nodes (10 begin superscript 4 end superscript), ranging from 0.0 to 1.0 in increments of 0.2 (y-axis) across vehicle and 2,3,7,8-tetrachlorodibenzo-p-dioxin: day 0; day 9; and day 79 and day 86 for NS, respectively.
Figure 4.
Assessment of CD4+ T cells from developmentally exposed mice during primary and recall responses to IAV. (A) Scheme of experimental set up. Mice were developmentally exposed to vehicle (V) or TCDD (T) and experiment was initiated when the offspring were 6–8 wk of age. (B) The number of virus-specific I-ANP311325b+ CD4+ T cells in the lymph nodes of naïve mice (8 vehicle; 9 TCDD) was quantified using flow cytometry. (C,D) Offspring of vehicle-treated dams and offspring of TCDD-treated dams were challenged with HKx31 (primary infection). (C) On Day 9 post primary infection, the number of virus-specific CD4+ T cells in 8 mice from the vehicle exposure group and 8 mice from the TCDD group was determined using flow cytometry. (D) Mice recovered from primary IAV infection for 79 d. The number of virus-specific CD4+ T cells was quantified prior to (7 vehicle; 7 TCDD) and 7 d after PR8 infection (secondary infection; 8 vehicle; 9 TCDD). The mice were 17–19 wk of age at the time of the secondary infection. The mean number of cells and p-values are provided in Table S3. At each point in time, offspring within the same exposure group were from separate dams. All values are mean±SEM. *, p0.05, using Student’s t-test. Note: IAV, influenza A virus; LN, lymph node; MLN, mediastinal lymph node; SEM, standard error of the mean; TCDD, 2,3,7,8-tetrachlorodibenzo-p-dioxin; 1°, primary; 2°, secondary.
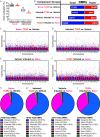
Figure 5A is an error bar graph plotting D N A methylation (percentage), ranging from 0 to 1 in unit increments and 76 to 81 in unit increments (y-axis) across naïve and infected for vehicle and 2,3,7,8-tetrachlorodibenzo-p-dioxin (x-axis) for A and A in Naïve and B and C in infected, respectively. Figure 5B is a horizontal stacked bar graph plotting comparison groups, including naïve: 2,3,7,8-tetrachlorodibenzo-p-dioxin versus vehicle; infected: 2,3,7,8-tetrachlorodibenzo-p-dioxin versus vehicle; vehicle: infected versus naïve; and 2,3,7,8-tetrachlorodibenzo-p-dioxin: infected versus naïve (y-axis) across differentially methylated regions, including hypo and hyper (x-axis). Figures 5C, 5D, 5E, and 5F are clustered bar graphs titled Naïve: 2,3,7,8-tetrachlorodibenzo-p-dioxin versus vehicle; Infected: 2,3,7,8-tetrachlorodibenzo-p-dioxin versus vehicle; Vehicle: infected versus naïve; and 2,3,7,8-Tetrachlorodibenzo-p-dioxin: infected versus naïve plotting negative log 10 of (lowercase q value), ranging from 10 to 20 in increments of 10 (y-axis) across chromosome, ranging from 1 to 19 in unit increments and uppercase x (x-axis). Figure 5G is a pie chart titled Naïve: 2,3,7,8-tetrachlorodibenzo-p-dioxin versus vehicle and is divided into eight parts representing 21,940 total differentially methylated regions. Intergenic is 62.21 percent, Intron is 33.45 percent, Promoter-transcription start site is 2.06 percent, Transcription start site is 0.91 percent, 3 prime Untranslated region is 0.70 percent, Exon is 0.49 percent, Non-coding is 0.14 percent, and 5 prime Untranslated region is 0.04 percent. Figure 5H is a pie chart titled Infected: 2,3,7,8-tetrachlorodibenzo-p-dioxin versus vehicle and is divided into eight parts representing 18,752 total differentially methylated regions. Intergenic is 63.07 percent, Intron is 33.05 percent, Promoter-transcription start site is 1.83 percent, Transcription start site is 0.81 percent, 3 prime Untranslated region is 0.55 percent, Exon is 0.49 percent, Non-coding is 0.17 percent, and 5 prime Untranslated region is 0.04 percent. Figure 5I is a pie chart titled Vehicle: infected versus naïve and is divided into eight parts representing 22,911 total differentially methylated regions. Intergenic is 62.16 percent, Intron is 33.78 percent, Promoter-transcription start site is 1.85 percent, Transcription start site is 0.86 percent, 3 prime Untranslated region is 0.62 percent, Exon is 0.51 percent, Non-coding is 0.19 percent, and 5 prime Untranslated region is 0.02 percent. Figure 5J is a pie chart titled 2,3,7,8-Tetrachlorodibenzo-p-dioxin: infected versus naïve and is divided into eight parts representing 29,563 total differentially methylated regions. Intergenic is 62.12 percent, Intron is 33.85 percent, Promoter-transcription start site is 1.79 percent, Transcription start site is 0.95 percent, 3 prime Untranslated region is 0.62 percent, Exon is 0.49 percent, Non-coding is 0.15 percent, and 5 prime Untranslated region is 0.02 percent.
Figure 5.
DNA methylation patterns in CD4+ T cells from naïve IAV-infected mice that were developmentally exposed to TCDD or vehicle. Mice were developmentally exposed to vehicle or TCDD, as described in Figure 1. Whole-genome bisulfite sequencing was performed using DNA from purified CD4+ T cells from naïve or IAV-infected adult mice (8–10 wk of age). For naïve offspring, peripheral lymph nodes from 1 mouse were pooled, and there was a total of three replicates per treatment group, with 1 offspring from unique dams used per replicate, for a total of 6 mice. For IAV-infected offspring mediastinal lymph nodes were used. Mice were sacrificed 9 d after infection, and there were three replicates per treatment group, with 4–6 offspring in each unique pool of cells for a total of 30 total mice used. All of the mice were sacrificed at the same time. (A) Box plots show global DNA methylation levels. The horizontal line denotes the mean, and boxes depict SEM. Differences between groups were evaluated using a two-way ANOVA with Tukey’s HSD post hoc test, and p-values are reported in Table S4. Groups with the same letter were not significantly different from each other. (B) The number of differentially methylated regions (DMRs) that were hypo- (blue; left side) or hyper- (red; right side) methylated are shown. The length of the bar is proportionate to the number of DMRs, and the number of DMRs is denoted on the bar segments. (C–F) Modified Manhattan plots show the distribution of hypomethylated (blue dots; left cluster) and hypermethylated (red dots; right cluster) DMRs across chromosomes in CD4+ T cells. (C,D) DMRs in CD4+ T cells from naïve (C) or IAV-infected TCDD (D) mice compared with vehicle controls. (E,F) DMRs in CD4+ T cells from vehicle (E) or TCDD (F) mice during IAV infection compared with naïve controls. The direction of hyper- and hypomethylation in (B) top two comparisons, (C) and (D) refer to the effect of developmental exposure to TCDD, or refers to the effect of infection in (B) bottom two comparisons, (E) and (F). Global methylation levels were analyzed by ANOVA with a Tukey HSD post hoc test. (G–J) DMRs were mapped to the genome. The total numbers of DMRs are shown. The percent of DMRs in intergenic, intron, TSS, TTS, 3′UTR, exon, noncoding, and 5′UTR regions are shown. The following comparisons were made: (G) DMRs from CD4+ T cells from naïve TCDD vs. naïve vehicle mice, (H) DMRs from CD4+ T Cells from IAV-infected TCDD vs. IAV-infected vehicle mice, (I) DMRs from CD4+ T cells from vehicle IAV-infected vs. vehicle naïve mice, and (J) DMRs from CD4+ T cells from TCDD IAV-infected vs. TCDD naïve mice. Note: ANOVA, analysis of variance; HSD, honestly significant difference; IAV, influenza A virus; SEM, standard error of the mean; TCDD, 2,3,7,8-tetrachlorodibenzo-p-dioxin; TSS, transcription start site; TTS, transcription termination site; UTR, untranslated region.
Figures 6A and 6C are Venn diagrams titled Vehicle: Infected versus Naïve and 2,3,7,8-tetrachlorodibenzo-p-dioxin: infected versus naïve. The circle on the left is labeled whole genome bisulfite sequencing: 8,156 and 10,852, respectively, and the one on the right is labeled Ribonucleic acid sequencing: 2,137 and 1,688, respectively. Both dots intersect and the intersection area is labeled, Vehicle: Infected versus Naïve and 2,3,7,8-tetrachlorodibenzo-p-dioxin: infected versus naïve: 766 and 707, respectively. Figures 6B and 6D are horizontal bar graphs titled Vehicle: Infected versus Naïve and 2,3,7,8-Tetrachlorodibenzo-p-dioxin: infected versus naïve plotting (Figure 6B) nuclear factor kappa-light-chain-enhancer of activated B cells Activation by Viruses, nuclear factor kappa-light-chain-enhancer of activated B cells signaling, Tumor necrosis factor receptor 2 signaling, Lymphotoxinb Receptor signaling, T-cell receptor signaling, Apoptosis signaling, T Cell Exhaustion signaling, Th1 and Th2 Activation Pathway, Cluster of differentiation 40 signaling, Lipopolysaccharide stimulated Mitogen-activated protein kinases signaling, Pigment epithelium-derived factor signaling, Interleukin-6 signaling, Protein Kinase C Theta In T Lymphocytes, Type I Diabetes Mellitus Signaling, and Inducible T-Cell Costimulator–Inducible T-Cell Costimulator Ligand Signaling in T Helper Cells, and (Figure 6D) Peroxisome proliferator-activated receptors per retinoid X receptors a activation, nuclear factor kappa-light-chain-enhancer of activated B cells signaling, Interleukin-6 signaling, nuclear factor kappa-light-chain-enhancer of activated B cells Activation by Viruses, Tec Kinase Signaling, Th1 and Th2 Activation Pathway, Interleukin-10 Signaling, Apoptosis signaling, Inducible T-Cell Costimulator–Inducible T-Cell Costimulator Ligand Signaling in T Helper Cells, Protein Kinase A signaling, Protein Kinase C Theta In T Lymphocytes, Gonadotropin-releasing hormone Signaling, Cluster of differentiation 40 signaling, Inducible Nitric Oxide Synthase signaling, and Peroxisome proliferator-activated receptor signaling (y-axis) across negative log to the base 10 of (lowercase p value), ranging from 0 to 10 in increments of 2 and from 0 to 8 in increments of 2, respectively.
Figure 6.
Gene expression and DNA methylation data set integration. The same cells were used for whole-genome bisulfite sequencing (WGBS) and RNA-seq. (A,C) Venn diagrams show the overlap of genes with differentially methylated regions (DMRs), assessed by WGBS, and differentially expressed genes (DEGs), assessed by RNAseq. (A) The DEG and DMR overlap shown for CD4+ T cells isolated from vehicle mice prior to and during IAV infection. (C) The DEG and DMR overlap for CD4+ T cells isolated from naïve and infected TCDD offspring. (B,D) Ingenuity Pathway Analysis was used to identify and rank T-cell relevant cellular pathways associated with genes with differential expression and DMRs (overlap in Venn diagrams). The pathways impacted by IAV infection in CD4+ T cells from (B) vehicle or (D) TCDD developmentally exposed offspring were ranked in descending order according to p-value. Pathways were colored according to z-score from 2.324 (diminished activity, green) to 1.606 (enhanced activity, red). Gray bars were used when a z-score was not predicted. The numerical data corresponding to (B) and (D) are in Table 5S. Note: GNRH, gonadotropin-releasing hormone; IAV, influenza A virus; iCOS, inducible T-cell costimulator; iCOSL, inducible T-cell costimulator ligand; IL, interleukin; iNOS, inducible nitric oxide synthase; LPS, lipopolysaccharide; MAPK, mitogen-activated protein kinase; NF-κB, nuclear factor kappa-light-chain-enhancer of activated B cells; PEDF, pigment epithelium-derived factor; PKCθ, protein kinase C theta; PPARa, peroxisome proliferator-activated receptors; RNA-seq, RNA sequencing; sig, signaling; RXRa, retinoid X receptor; TCDD, 2,3,7,8-tetrachlorodibenzo-p-dioxin; TCR, T cell receptor; Th, T helper; TNFR, tumor necrosis factor receptor.
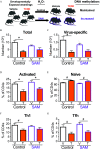
Figure 7A is a flowchart depicting effects of treatment on infected mice having three steps. Step 1: Developmentally Exposed weanlings is divided into two parts vehicle and 2,3,7,8-tetrachlorodibenzo-p-dioxin. Step 2: Step 1 infused with water the effects of treatment with control and S-adenosyl methionine lead to D N A methylation. Step 3: The D N A methylation in control vehicle and 2,3,7,8-tetrachlorodibenzo-p-dioxin is maintained and the D N A methylation in S-adenosyl methionine vehicle and 2,3,7,8-tetrachlorodibenzo-p-dioxin is increased. Figures 7B, 7C, 7D, 7E, 7F, and 7G are clustered bar graphs titled Total, Virus-specific, Activated, Naïve, T helper, and T follicular helper plotting number (10 begin superscript 5 end superscript), ranging from 0 to 15 in increments of 5; number (10 begin superscript 4 end superscript), ranging from 0.0 to 1.5 in increments of 0.5, percentage of clusters of differentiation 4, ranging from 0 to 25 in increments of 5; percentage of clusters of differentiation 4, ranging from 0 to 80 in increments of 20; percentage of clusters of differentiation 4, ranging from 0 to 25 in increments of 5; and percentage of clusters of differentiation 4, ranging from 0 to 5 in unit increments (y-axis) for control and S-adenosyl methionine, including vehicle and 2,3,7,8-tetrachlorodibenzo-p-dioxin (x-axis), respectively.
Figure 7.
Effects of treatment with S-adenosyl methionine (SAM) on the CD4+ T-cell response to IAV infection in developmentally exposed mice. (A) Mice were developmentally exposed to vehicle or TCDD. At weaning (21 d of age), mice were randomly divided and given normal vivarium water to maintain DNA methylation levels or water containing SAM (0.5mg/mL) to increase DNA methylation levels. At 6–8 wk of age, offspring of dams given vehicle (V; white bar) and TCDD (T; orange bar) were infected with IAV (HKx31). Mediastinal lymph nodes were harvested 9 d after infection, and cells stained for flow cytometry. (B) The total number of CD4+ T cells or (C) virus-specific I-ANP311325b+ CD4+ T cells were quantified from mice on control (black outline) or SAM (purple outline) water. The percentage of (D) activated (CD44hiCD62L) or (E) naïve (CD44loCD62L+) CD4+ T cells from control or SAM mice. The percentage of (F) Th1 (Tbet+CD4+) or (G) Tfh (CXCR5+PD1+CD44hiCD4+) isolated from control or SAM mice. The number of mice in each group was as follows: control water vehicle (8), control water TCDD (5), SAM water vehicle (8), and SAM water TCDD (6). Due to a limited number of offspring, individual offspring were defined as the statistical unit, rather than the dam. All data shown are mean±SEM. *, p0.05, using a two-way ANOVA with Tukey’s HSD and Student’s t-test. #, p0.05, using Student’s t-test. The numerical data in the graphs, including p-values are provided in Table S6. Note: ANOVA, analysis of variance, HSD, honestly significant difference; H2O, water; IAV, influenza A virus; SEM, standard error of the mean; TCDD, 2,3,7,8-tetrachlorodibenzo-p-dioxin; Tfh, T follicular helper; Th, T helper.
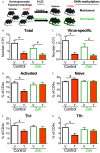
Figure 8A is a flowchart depicting effects of treatment on infected mice having three steps. Step 1: Developmentally Exposed weanlings is divided into two parts vehicle and 2,3,7,8-tetrachlorodibenzo-p-dioxin. Step 2: Step 1 infused with water the effects of treatment with control and Zebularine lead to D N A methylation. Step 3: The D N A methylation in control vehicle and 2,3,7,8-tetrachlorodibenzo-p-dioxin is maintained and the D N A methylation in Zebularine vehicle and 2,3,7,8-tetrachlorodibenzo-p-dioxin is decreased. Figures 8B, 8C, 8D, 8E, 8F, and 8G are clustered bar graphs titled Total, Virus-specific, Activated, Naïve, T helper, and T follicular helper plotting number (10 begin superscript 5 end superscript), ranging from 0 to 15 in increments of 5; number (10 begin superscript 4 end superscript) ranging from 0.0 to 1.5 in increments of 0.5, percentage of clusters of differentiation 4, ranging from 0 to 25 in increments of 5; percentage of clusters of differentiation 4, ranging from 0 to 80 in increments of 20; percentage of clusters of differentiation 4, ranging from 0 to 25 in increments of 5; and percentage of clusters of differentiation 4, ranging from 0 to 5 in unit increments (y-axis) for control and Zebularine, including vehicle and 2,3,7,8-tetrachlorodibenzo-p-dioxin (x-axis), respectively.
Figure 8.
Effects of Zebularine (Zeb) on CD4+ T cells from developmentally exposed mice after infection with IAV. (A) Mice were developmentally exposed to vehicle or TCDD. At weaning (21 d of age), mice were randomly selected be given normal vivarium water to maintain DNA methylation levels or water containing Zeb (0.2mg/mL) to decrease DNA methylation levels. At 6–8 wk of age, mice developmentally exposed to vehicle (white bar) and TCDD (orange bar) were infected with IAV. Mediastinal lymph nodes (MLNs) were harvested 9 d after infection, and cells stained for flow cytometry. (B) The number of CD4+ T cells or (C) virus-specific I-ANP311325b+ CD4+ T cells were quantified from MLNs of mice on control (black outline) or Zeb (green outline) water. The percentage of (D) activated (CD44hiCD62L) or (E) naïve (CD44loCD62L+) CD4+ T cells from control or Zeb mice. The percentage of (F) Th1 (Tbet+CD4+) or (G) Tfh (CXCR5+PD1+CD44hiCD4+) isolated from control or Zeb mice. For each group, 5–9 developmentally exposed offspring were used: control water vehicle (8), control water TCDD (5), Zeb water vehicle (9), and Zeb water TCDD (6). Due to a limited number of offspring, individual offspring were defined as the statistical unit, rather than the dam. All data shown are mean±SEM. *, p0.05, using a two-way ANOVA with Tukey’s HSD and Student’s t-test. #, p0.05, using Student’s t-test. The numerical data in the graphs and p-values are provided in Table S7. Note: ANOVA, analysis of variance; HSD, honestly significant difference; H2O, water; IAV, influenza A virus; SEM, standard error of the mean; T, TCDD; Tbet, T-box transcription factor; TCDD, 2,3,7,8-tetrachlorodibenzo-p-dioxin; Tfh, T follicular helper; Th, T helper; V, vehicle.

Comment in

Similar articles

Cited by

References

    1. Akalin A, Kormaksson M, Li S, Garrett-Bakelman FE, Figueroa ME, Melnick A, et al. . 2012. methylKit: a comprehensive R package for the analysis of genome-wide DNA methylation profiles. Genome Biol 13(10):R87, PMID: 23034086, 10.1186/gb-2012-13-10-r87. - DOI - PMC - PubMed
    1. Akbar AN, Henson SM. 2011. Are senescence and exhaustion intertwined or unrelated processes that compromise immunity? Nat Rev Immunol 11(4):289–295, PMID: 21436838, 10.1038/nri2959. - DOI - PubMed
    1. Akemann C, Meyer DN, Gurdziel K, Baker TR. 2019. Developmental dioxin exposure alters the methylome of adult male zebrafish gonads. Front Genet 9:719, PMID: 30687390, 10.3389/fgene.2018.00719. - DOI - PMC - PubMed
    1. Barrett T, Inglis SC. 1985. Growth, purification and titration of influenza viruses. In Virology: A Practical Approach. Mahy BWJ, ed. Washington, DC: IRL Press, 119–150.
    1. Basson MA. 2012. Signaling in cell differentiation and morphogenesis. Cold Spring Harb Perspect Biol 4(6):a008151, PMID: 22570373, 10.1101/cshperspect.a008151. - DOI - PMC - PubMed

Publication types

MeSH terms

Substances