. 2021 Mar 1;320(3):H1089-H1101.
doi: 10.1152/ajpheart.00690.2020. Epub 2021 Jan 15.

TMEM16A channel upregulation in arterial smooth muscle cells produces vasoconstriction during diabetes

Affiliations

TMEM16A channel upregulation in arterial smooth muscle cells produces vasoconstriction during diabetes

M Dennis Leo et al. Am J Physiol Heart Circ Physiol. .

Abstract

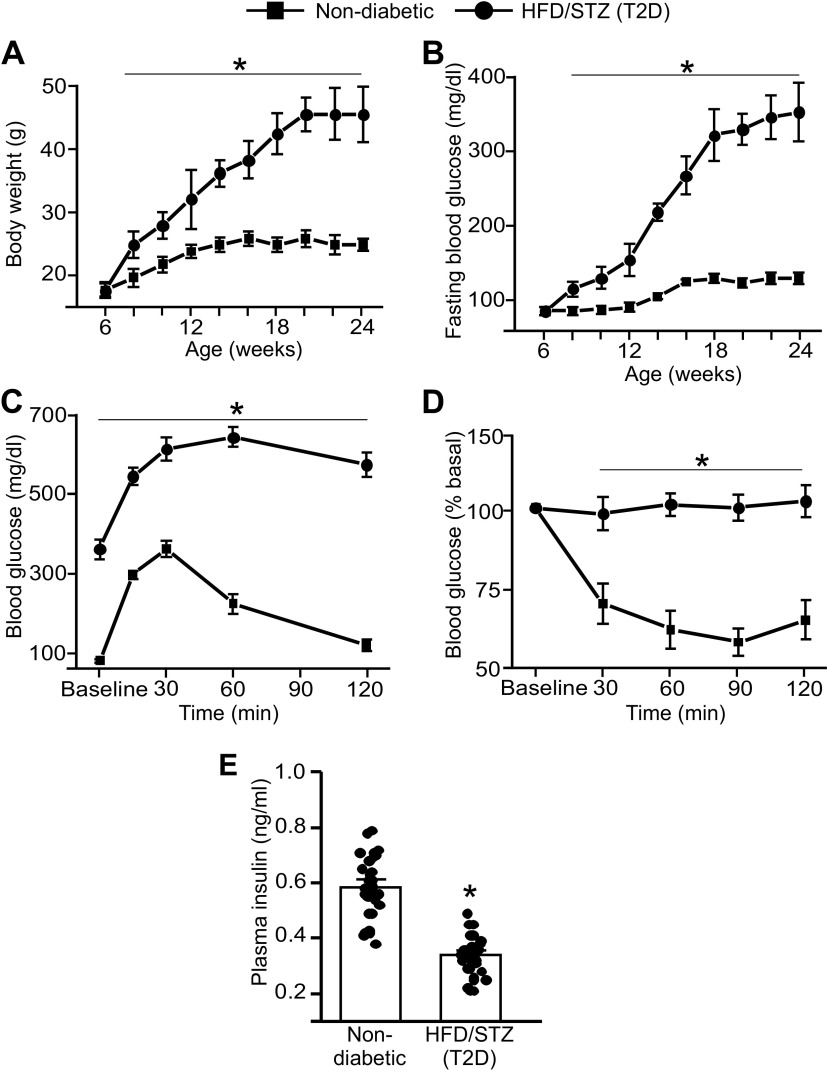
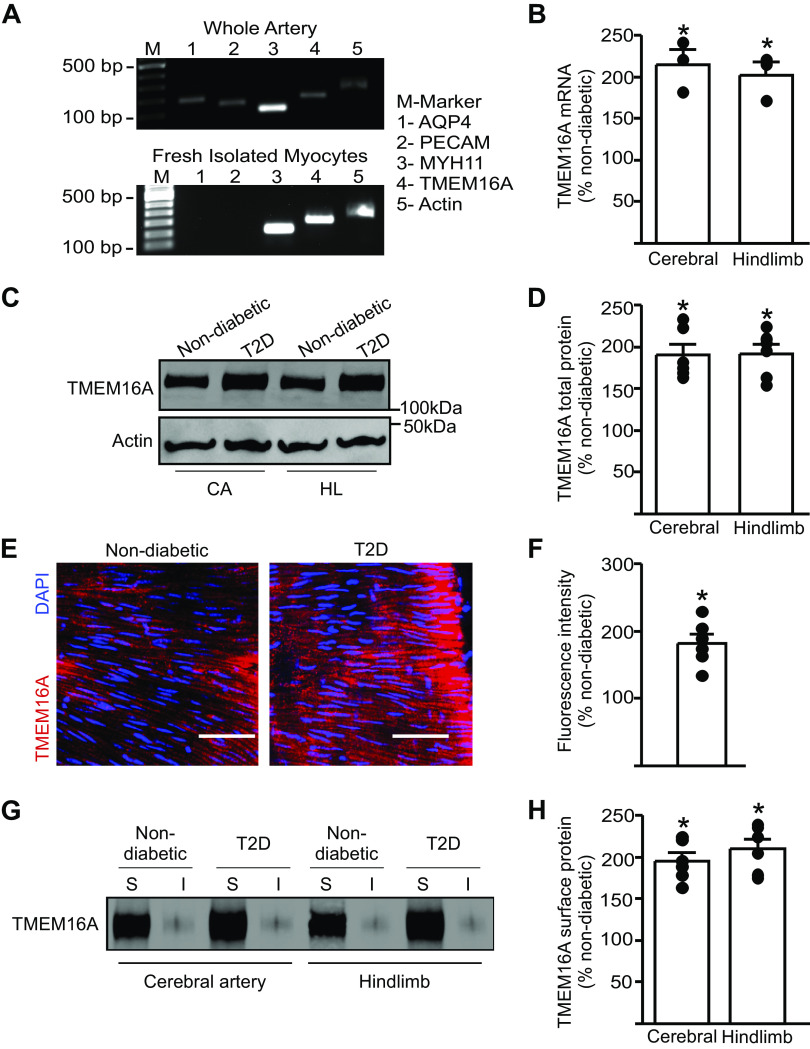
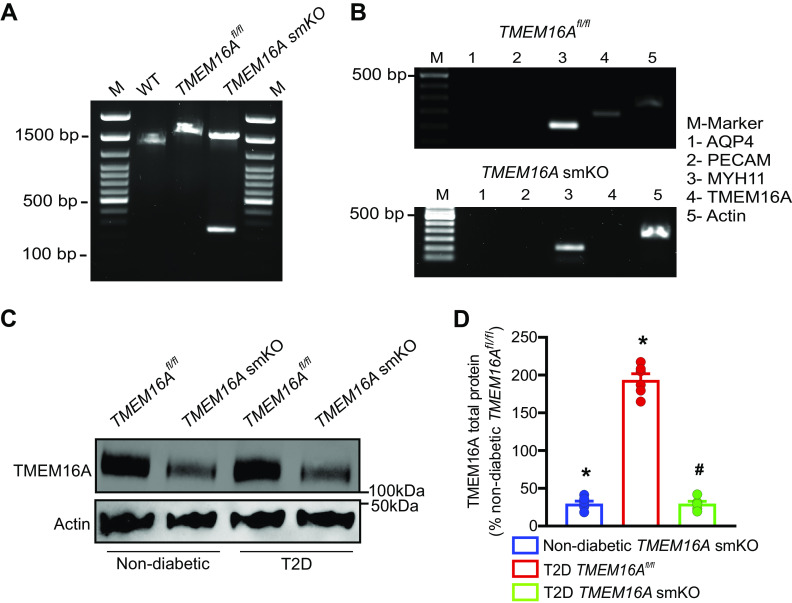
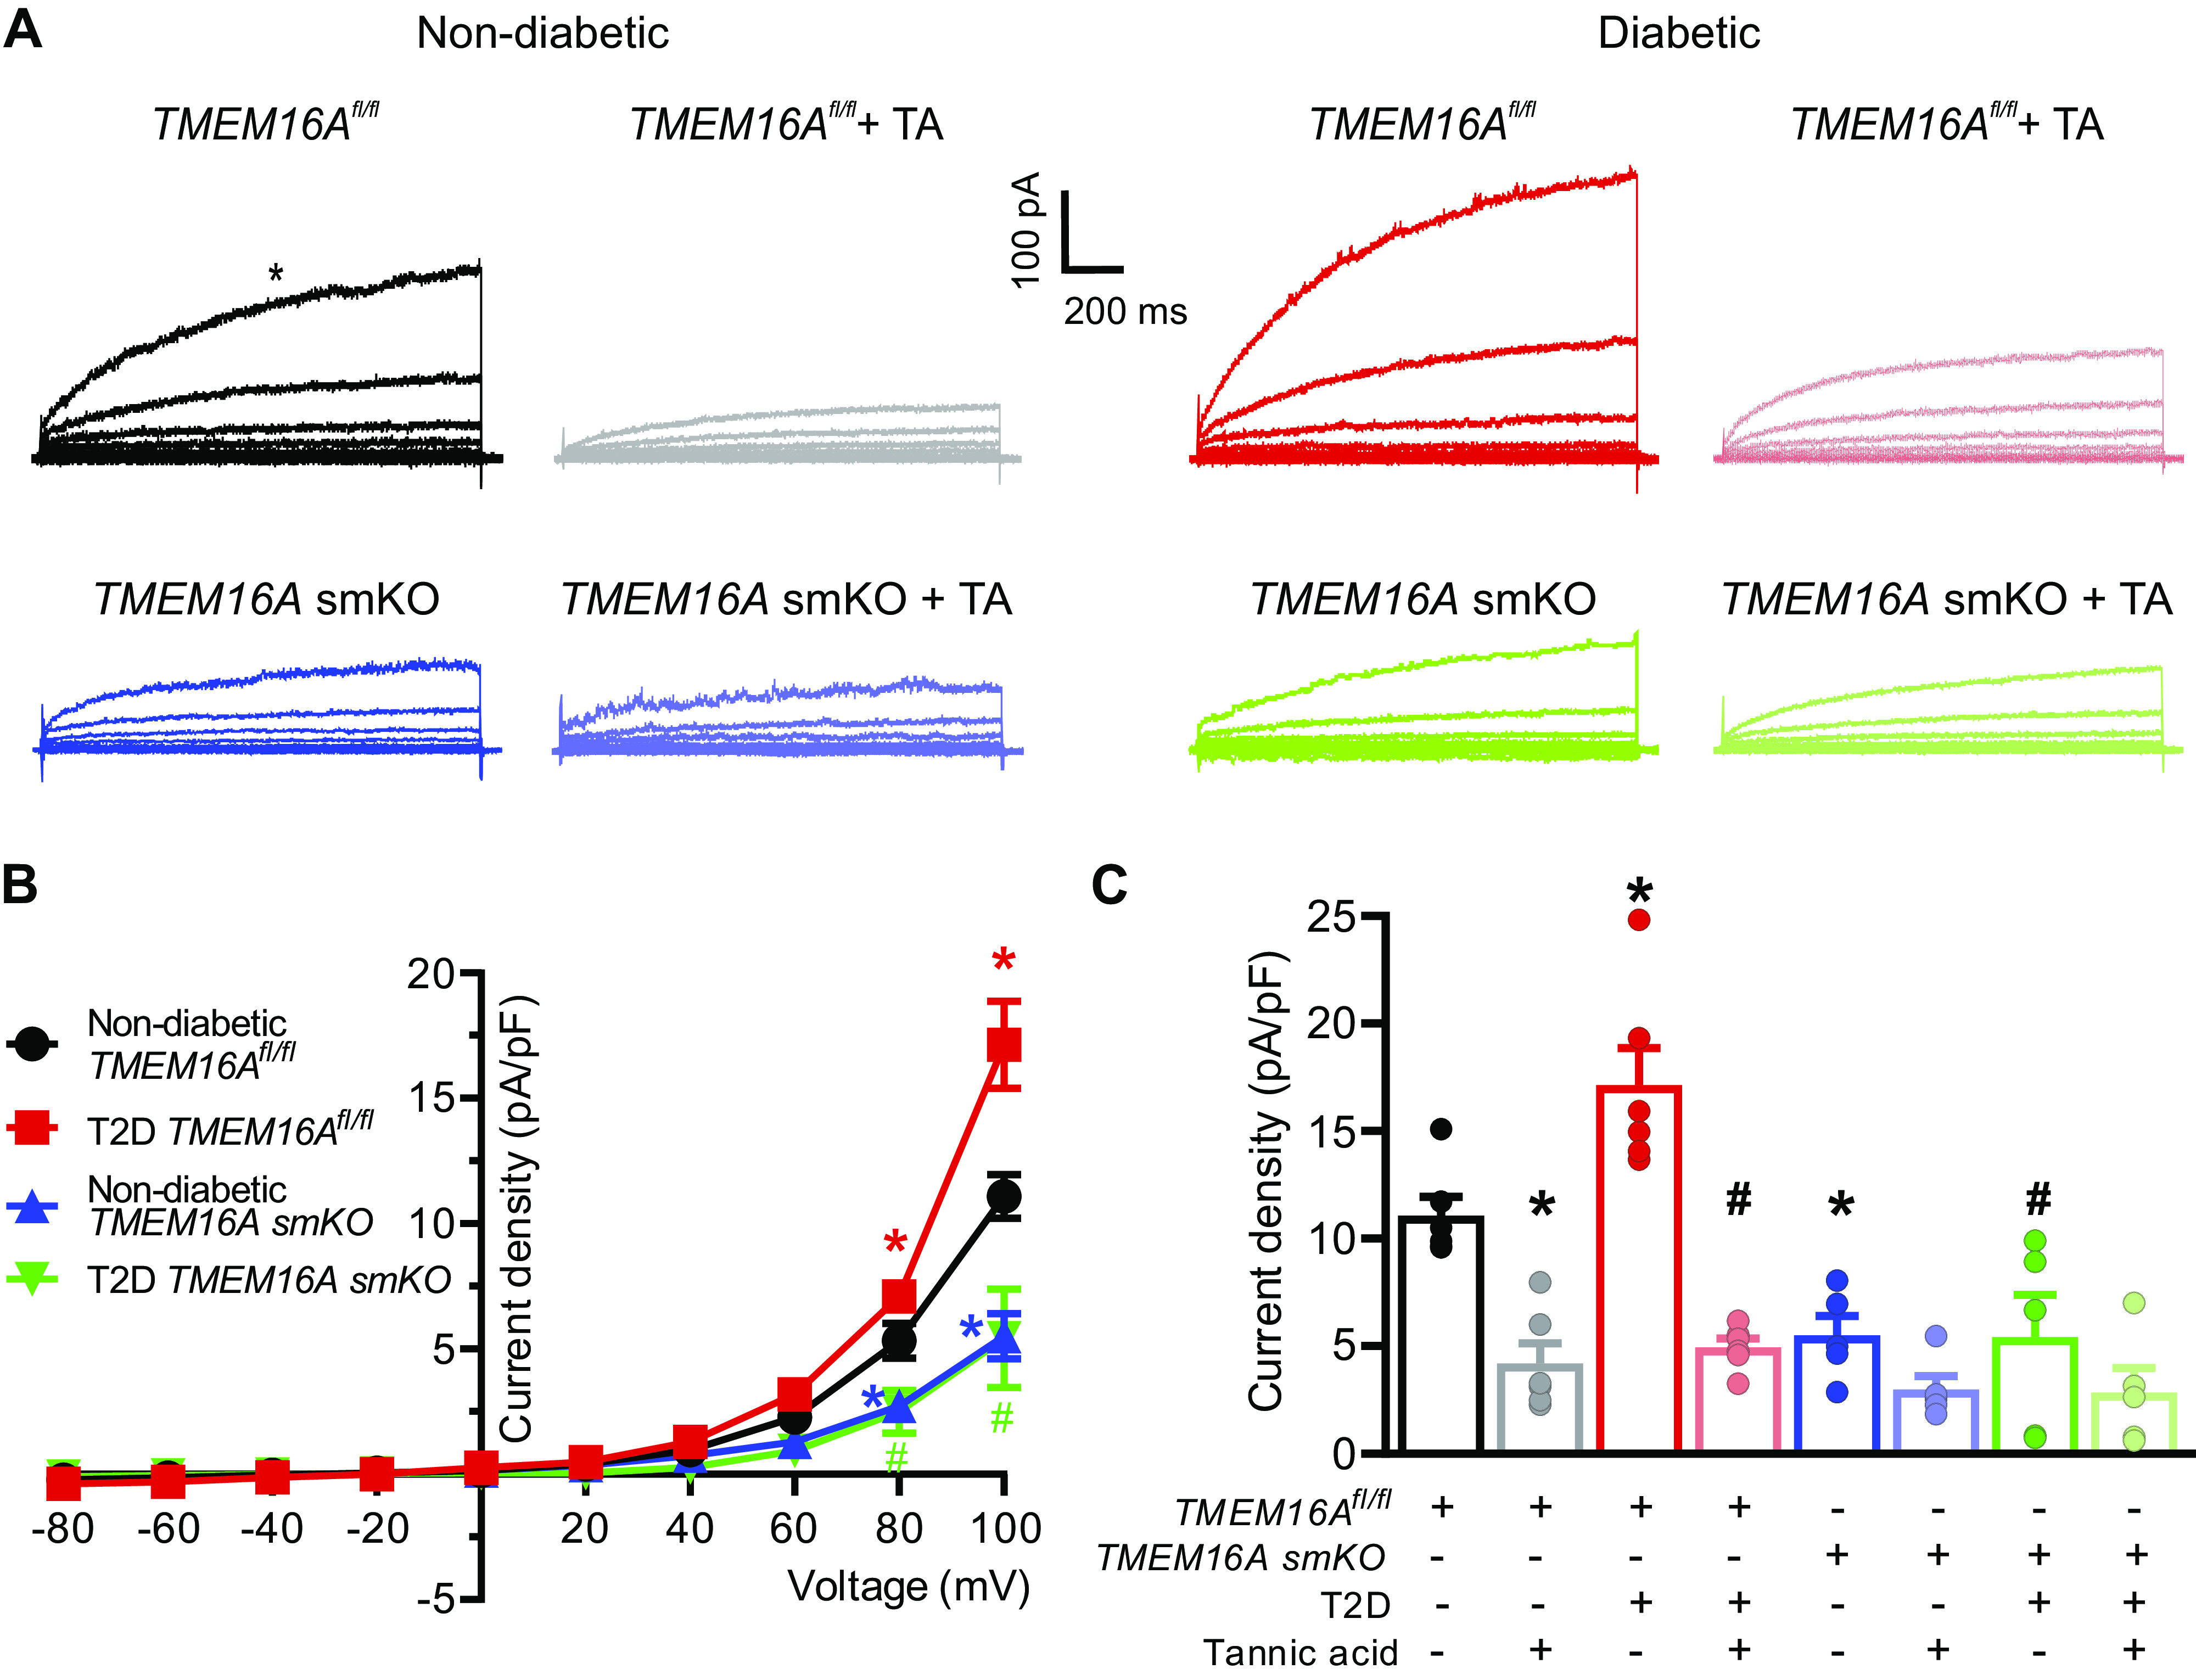
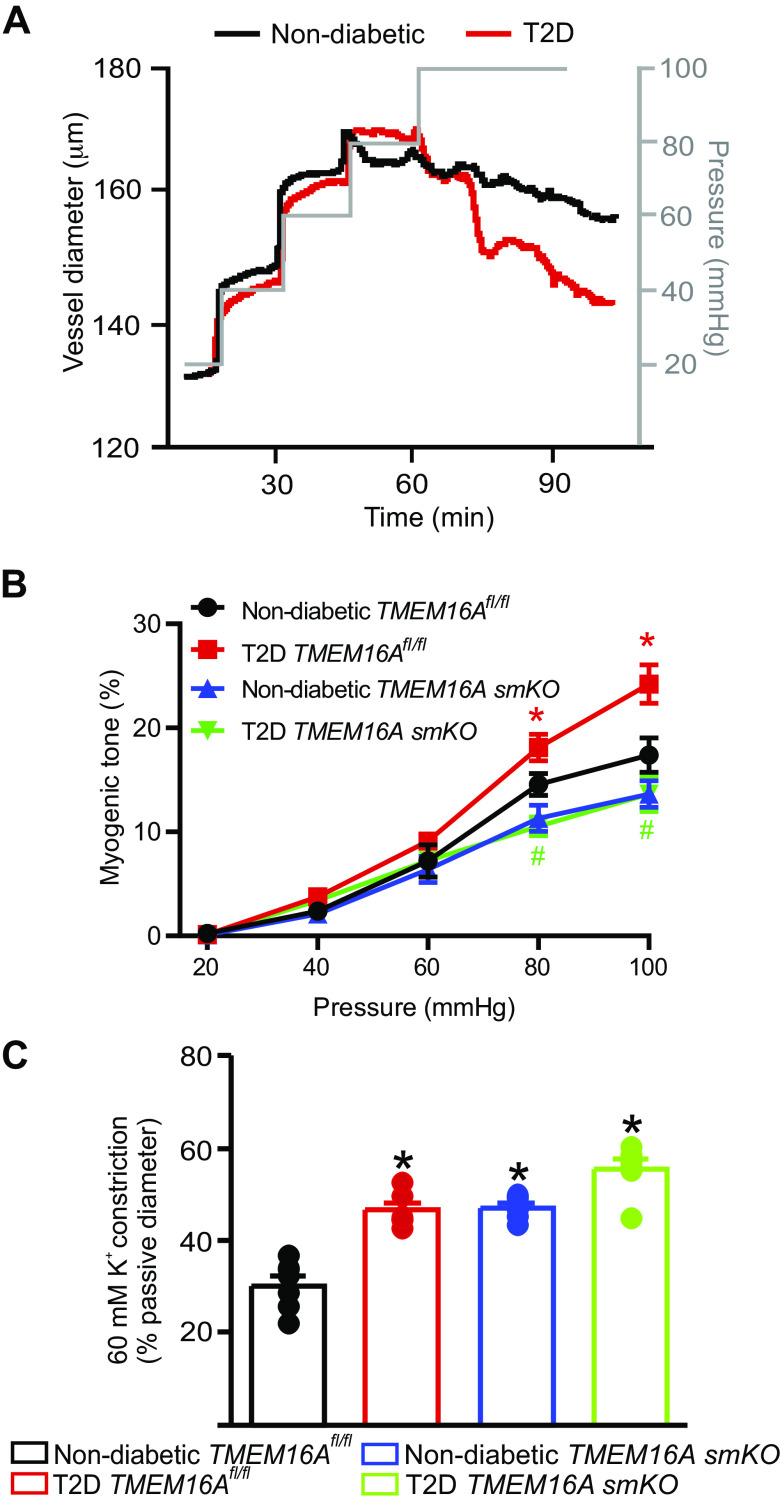
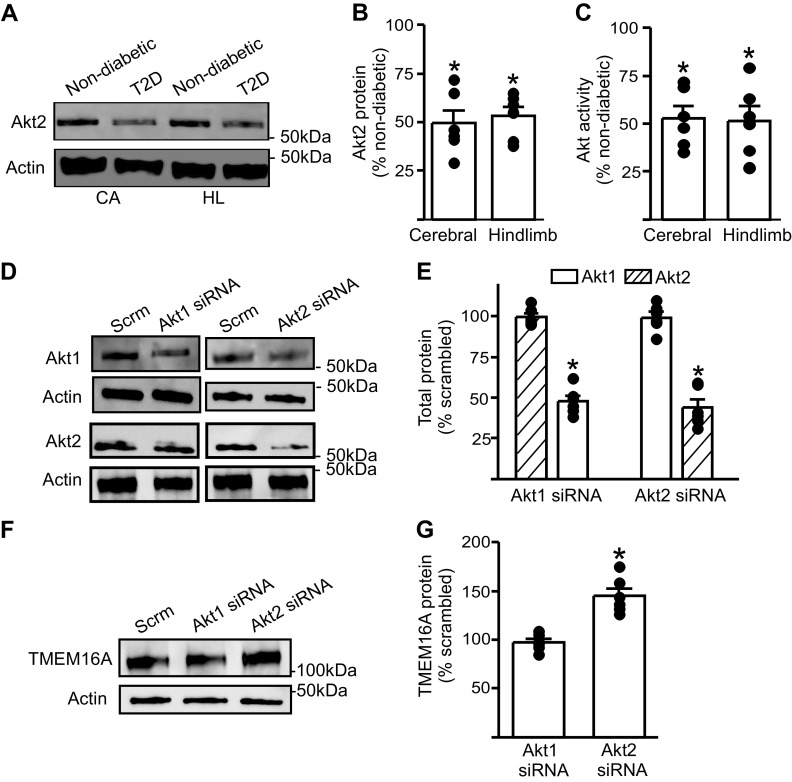
The pathological involvement of anion channels in vascular dysfunction that occurs during type 2 diabetes (T2D) is unclear. Here, we tested the hypothesis that TMEM16A, a calcium-activated chloride (Cl-) channel, contributes to modifications in arterial contractility during T2D. Our data indicate that T2D increased TMEM16A mRNA in arterial smooth muscle cells and total and surface TMEM16A protein in resistance-size cerebral and hindlimb arteries of mice. To examine vascular cell types in which TMEM16A protein increased and the functional consequences of TMEM16A upregulation during T2D, we generated tamoxifen-inducible, smooth muscle cell-specific TMEM16A knockout (TMEM16A smKO) mice. T2D increased both TMEM16A protein and Cl- current density in arterial smooth muscle cells of control (TMEM16Afl/fl) mice. In contrast, T2D did not alter arterial TMEM16A protein or Cl- current density in smooth muscle cells of TMEM16A smKO mice. Intravascular pressure stimulated greater vasoconstriction (myogenic tone) in the arteries of T2D TMEM16Afl/fl mice than in the arteries of nondiabetic TMEM16Afl/fl mice. This elevation in myogenic tone in response to T2D was abolished in the arteries of T2D TMEM16A smKO mice. T2D also reduced Akt2 protein and activity in the arteries of T2D mice. siRNA-mediated knockdown of Akt2, but not Akt1, increased arterial TMEM16A protein in nondiabetic mice. In summary, data indicate that T2D is associated with an increase in TMEM16A expression and currents in arterial smooth muscle cells that produces vasoconstriction. Data also suggest that a reduction in Akt2 function drives these pathological alterations during T2D.NEW & NOTEWORTHY We investigated the involvement of TMEM16A channels in vascular dysfunction during type 2 diabetes (T2D). TMEM16A message, protein, and currents were higher in smooth muscle cells of resistance-size arteries during T2D. Pressure stimulated greater vasoconstriction in the arteries of T2D mice that was abolished in the arteries of TMEM16A smKO mice. Akt2 protein and activity were both lower in T2D arteries, and Akt2 knockdown elevated TMEM16A protein. We propose that a decrease in Akt2 function stimulates TMEM16A expression in arterial smooth muscle cells, leading to vasoconstriction during T2D.

Keywords: Akt; TMEM16A channel; arterial contractility; smooth muscle; type 2 diabetes.


Conflict of interest statement

No conflicts of interest, financial or otherwise, are declared by the authors.

Figures

Figure 1.
Figure 1.
C57BL6/J mice on a high-fat diet with streptozotocin-treatment develop T2D. A: body weight (g) recordings from week 6 to week 24 of mice treated with either control chow and buffer-alone injections or high-fat diet and streptozotocin injections. n = 52 for each trial. *P < 0.05 vs. nondiabetic control. B: fasting blood glucose (mg/dL) recordings from week 6 to week 24 of mice treated with either control chow and buffer-alone injections or high-fat diet and streptozotocin injections. n = 48 for each trial. *P < 0.05 vs. nondiabetic. C: oral glucose tolerance test in control and HFD-STZ mice at week 24. n = 6 for each trial. *P < 0.05 vs. nondiabetic. D: insulin tolerance test in control and HFD-STZ mice at week 24. n = 6 for each trial. *P < 0.05 vs. nondiabetic. E: plasma insulin (in ng/mL) of nondiabetic and HFD-STZ mice at week 24. n = 32 for each trial. *P < 0.05 vs. nondiabetic. HFD-STZ, high-fat diet-streptozotocin; T2D, type 2 diabetes. Statistical analysis was performed using a one-way ANOVA for data in AC, a two-way ANOVA with Bonferroni post hoc test for data in D, and a Student’s t test for data in E.
Figure 2.
Figure 2.
TMEM16A expression is upregulated in resistance-size arteries of T2D mice. A: representative RT-PCR illustrating the purity of smooth muscle cells isolated and collected from cerebral arteries. B: real-time PCR data indicating fold change in mRNA for TMEM16A in smooth muscle cells isolated from arteries of nondiabeticor T2D mice (n = 4). *P < 0.05 vs. nondiabetic. C: representative Western blot illustrating TMEM16A and actin total protein expression in cerebral and hindlimb arteries from nondiabetic and T2D mice. D: mean data (n = 6 for each trial), *P < 0.05 vs. nondiabetic. E: en-face immunofluorescence imaging illustrating TMEM16A protein (red, Alexa Fluor 555) and DAPI (blue) in smooth muscle cells of hindlimb arteries from nondiabetic and T2D mice. Scale bar = 40 µm. F: mean data of relative fluorescence intensity for TMEM16A. n = 6 for each trial, *P < 0.05 vs. nondiabetic. G: representative Western blots illustrating surface (S) and intracellular (I) TMEM16A protein obtained from surface biotinylation experiments in cerebral arteries and hindlimb arteries from nondiabetic and T2D mice. H: mean data, n = 6 for each trial, *P < 0.05 vs. nondiabetic. T2D, type 2 diabetes. Mann–Whitney U test was used for statistical analysis.
Figure 3.
Figure 3.
T2D increases TMEM16A protein in arterial smooth muscle cells. A: generation of TMEM16Afl/fl and TMEM16A smKO mice. Ethidium bromide gel illustrating PCR products in vasculature of C57BL/6J mice and tamoxifen-treated TMEM16Afl/fl and TMEM16Afl/fl:Myh11-cre/ERT2 mice. M, marker; WT, wild-type. B: RT-PCR illustrating the absence of TMEM16A transcripts in isolated smooth muscle cells from tamoxifen-treated TMEM16Afl/fl:Myh11-cre/ERT2 mice. C: Western blot showing the effect of tamoxifen-treatment in TMEM16Afl/fl and TMEM16Afl/fl:Myh11-cre/ERT2 mice on TMEM16A and actin proteins in hindlimb arteries of nondiabetic and T2D mice. D: mean data, n = 6 for each trial, *P < 0.05 vs. nondiabetic TMEM16Afl/fl, #P < 0.05 vs. T2D TMEM16Afl/fl. smKO, smooth muscle cell-specific TMEM16A knockout; T2D, type 2 diabetes. Mann–Whitney U test was used for statistical analysis.
Figure 4.
Figure 4.
TMEM16A currents are larger in arterial smooth muscle cells of T2D mice. A: original recordings of currents elicited by voltage steps in arterial smooth muscle cells of nondiabetic and T2D TMEM16Afl/fl and TMEM16A smKO mice and effects of tannic acid (TA, 10 µM) in the same cells. B: current-voltage relationships obtained in nondiabetic and T2D TMEM16Afl/fl and TMEM16A smKO mice, nondiabetic TMEM16Afl/fl, n = 6; T2D TMEM16Afl/fl, n = 6; nondiabetic TMEM16A smKO, n = 5; T2D TMEM16A smKO, n = 5. *P < 0.05 vs. nondiabetic TMEM16Afl/fl. # P < 0.05 vs. T2D TMEM16Afl/fl. Color coded statistical symbols illustrate data being compared. C: mean data illustrating inhibition by tannic acid at +100 mV for the same cells shown in Fig. 4B. Data at +100 mV in the absence of tannic acid are reproduced from Fig. 4B for comparison. Nondiabetic TMEM16Afl/fl+TA, n = 6; T2D TMEM16Afl/fl+TA, n = 6; nondiabetic TMEM16A smKO + TA, n = 5; T2D TMEM16A smKO + TA, n = 5. *P < 0.05 vs. nondiabetic TMEM16Afl/fl, #P < 0.05 vs. T2D TMEM16Afl/fl. smKO, smooth muscle cell-specific TMEM16A knockout; T2D, type 2 diabetes. Statistical analysis used was two-way ANOVA with Bonferroni post hoc test for data in B and one-way ANOVA with Bonferroni post hoc test for data in C.
Figure 5.
Figure 5.
Smooth muscle cell TMEM16A channels contribute to augmented pressure-induced vasoconstriction in hindlimb arteries of T2D mice. A: representative traces illustrating diameter responses to intravascular pressure in hindlimb arteries of nondiabetic and T2D mice. B: mean data for myogenic tone in hindlimb arteries, n = 6–8 for each trial, *P < 0.05 vs. nondiabetic TMEM16Afl/fl and #P < 0.05 vs. T2D TMEM16Afl/fl. C: mean data for 60 mM K+-induced constriction in pressurized hindlimb arteries, n = 6–8 for each, *P < 0.05 vs. nondiabetic TMEM16Afl/f. T2D, type 2 diabetes. Statistical analysis was performed using a one-way ANOVA with Bonferroni post hoc test for data in B and C.
Figure 6.
Figure 6.
Akt expression and activity are attenuated during T2D and Akt2 knockdown stimulates an increase in TMEM16A protein in hindlimb arteries. A: representative Western blot illustrating Akt2 and actin total protein in cerebral (CA) and hindlimb (HL) arteries from nondiabetic and T2D mice. B: mean data (n = 6 for each trial), *P < 0.05 vs. respective nondiabetic. C: mean data for total Akt activity in cerebral and hindlimb arteries of T2D mice. n = 6 for each trial, *P < 0.05 vs. respective nondiabetic. D: representative Western blots of Akt1, Akt2, and actin proteins in hindlimb arteries transfected with scrambled (Scrm), Akt1, or Akt2 siRNA. E: mean data (n = 6 for each trial). *P < 0.05 vs. scrambled controls. F: representative Western blots illustrating TMEM16A and actin proteins in hindlimb arteries transfected with scrambled, Akt1, or Akt2 siRNA. G: mean data (n = 6 for each trial). *P < 0.05 vs. scrambled control. T2D, type 2 diabetes. Mann–Whitney U test was used for statistical analysis.

Similar articles

Cited by

References

    1. Centers for Disease Control and Prevention. National Diabetes Statistics Report Atlanta, Atlanta, GA: Centers for Disease Control and Prevention, U.S. Dept of Health and Human Services, 2017.
    1. Deshpande AD, Harris-Hayes M, Schootman M. Epidemiology of diabetes and diabetes-related complications. Phys Ther 88: 1254–1264, 2008. doi:10.2522/ptj.20080020. - DOI - PMC - PubMed
    1. Paneni F, Beckman JA, Creager MA, Cosentino F. Diabetes and vascular disease: pathophysiology, clinical consequences, and medical therapy: part I. Eur Heart J 34: 2436–2443, 2013. doi:10.1093/eurheartj/eht149. - DOI - PMC - PubMed
    1. Green JB. Understanding the type 2 diabetes mellitus and cardiovascular disease risk paradox. Postgrad Med 126: 190–204, 2014. doi:10.3810/pgm.2014.05.2767. - DOI - PubMed
    1. Kalofoutis C, Piperi C, Kalofoutis A, Harris F, Phoenix D, Singh J. Type II diabetes mellitus and cardiovascular risk factors: current therapeutic approaches. Exp Clin Cardiol 12: 17–28, 2007. - PMC - PubMed

Publication types

MeSH terms

LinkOut - more resources