

Kinetics of cytochrome P450 3A4 inhibition by heterocyclic drugs defines a general sequential multistep binding process
- PMID: 33449875
- PMCID: PMC7948456
- DOI: 10.1074/jbc.RA120.016855
Kinetics of cytochrome P450 3A4 inhibition by heterocyclic drugs defines a general sequential multistep binding process
Abstract
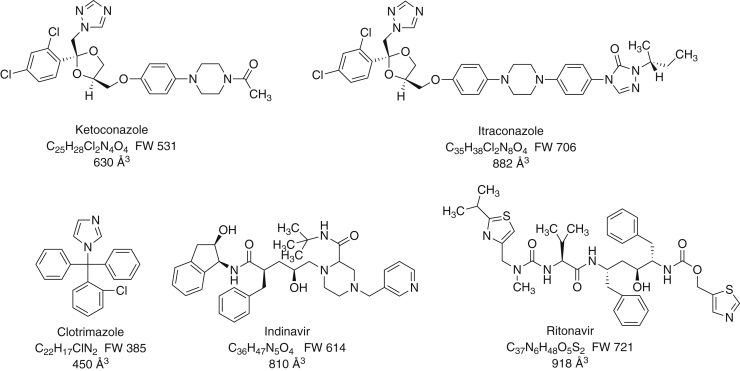
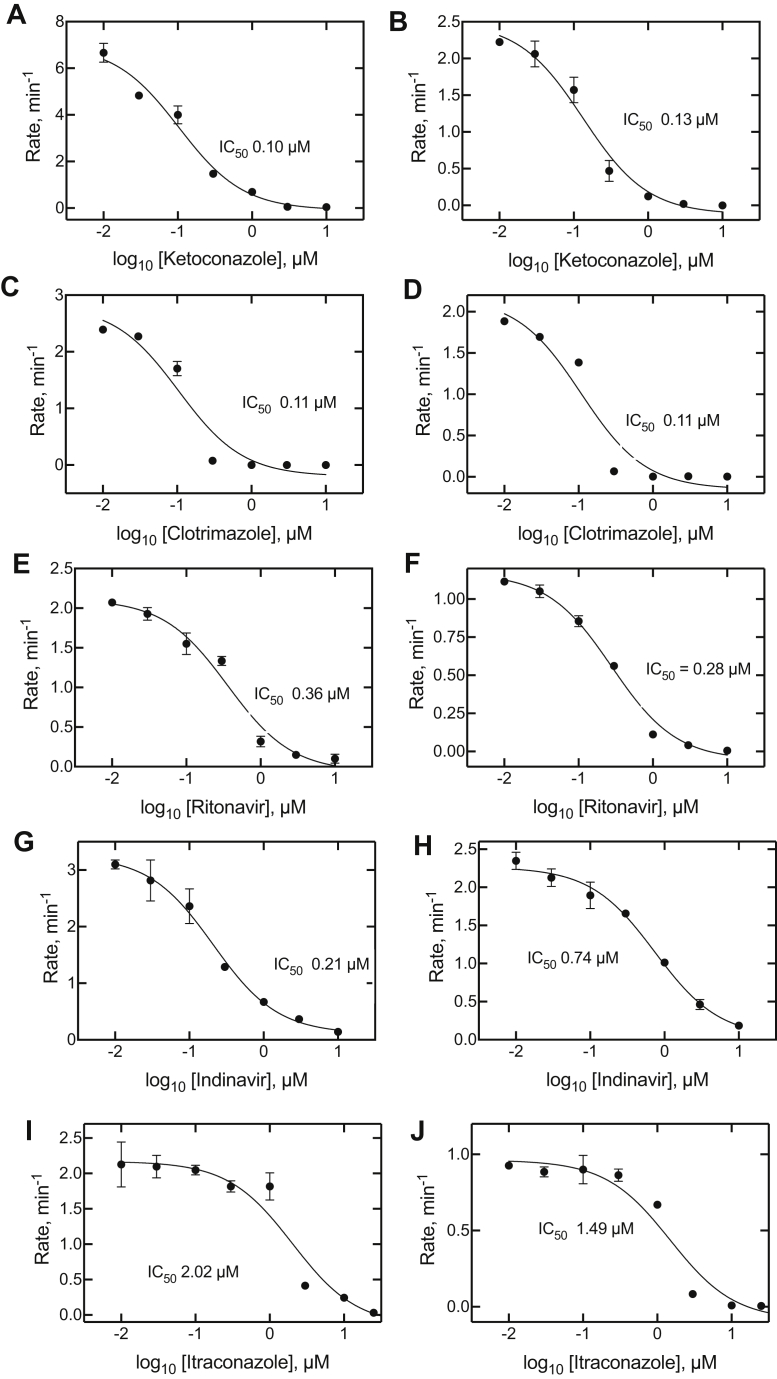
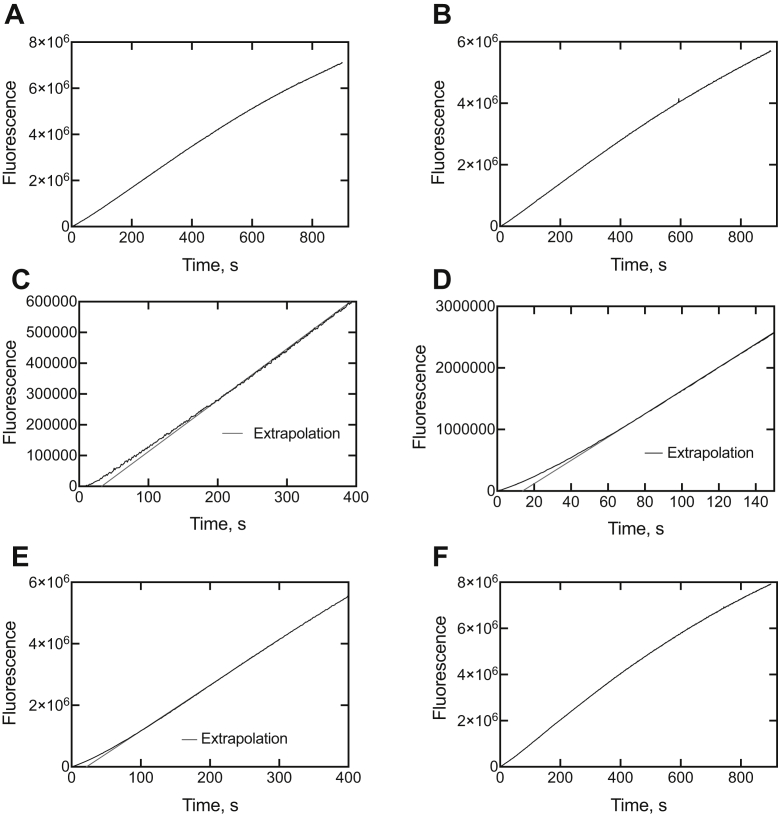
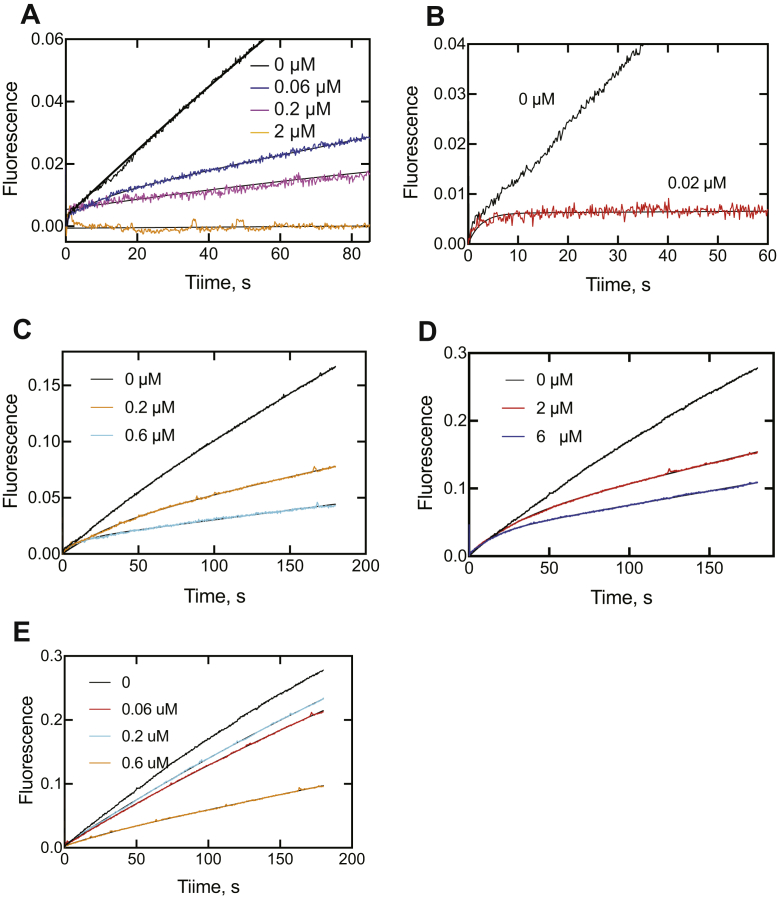
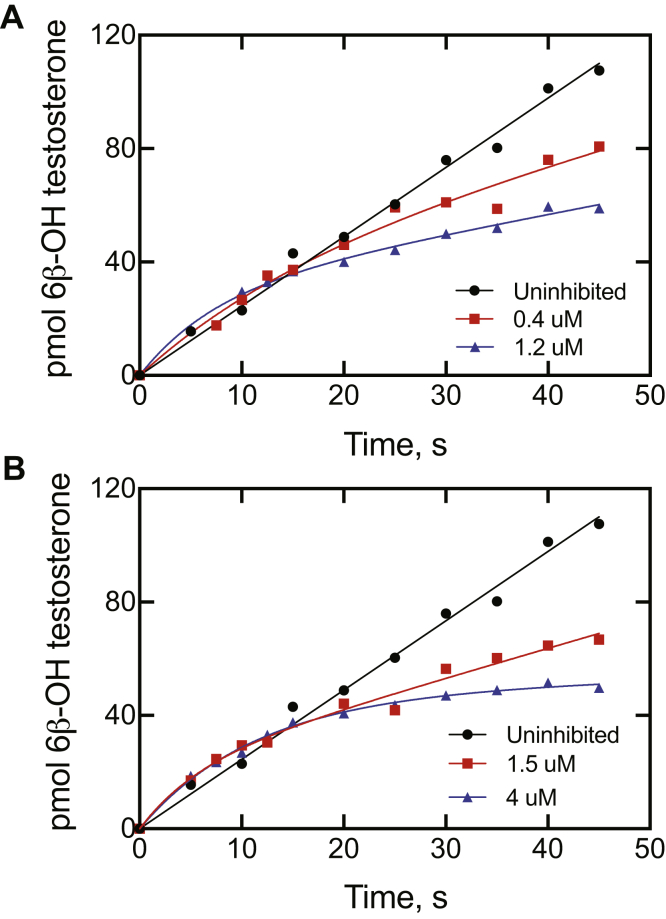
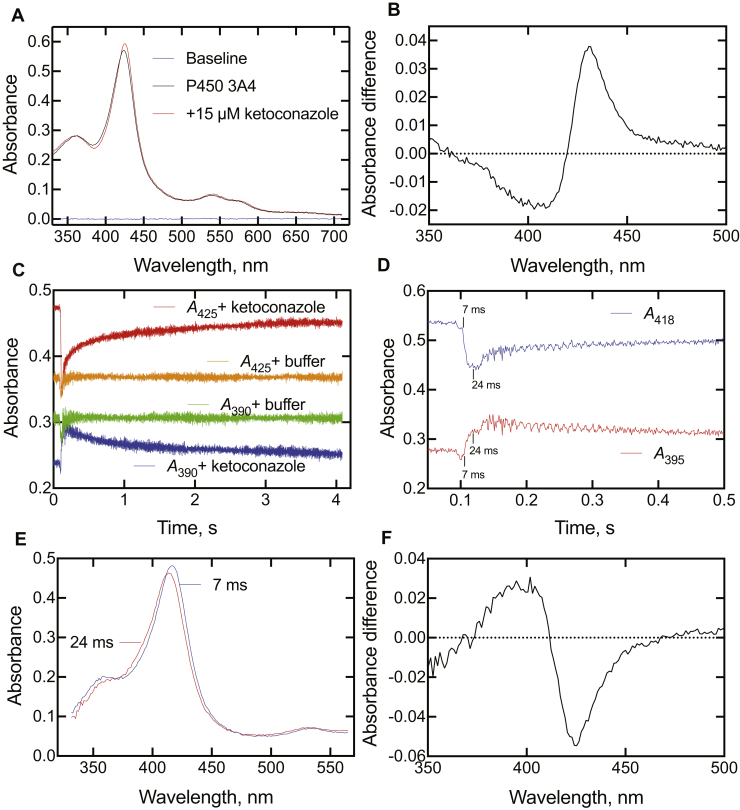
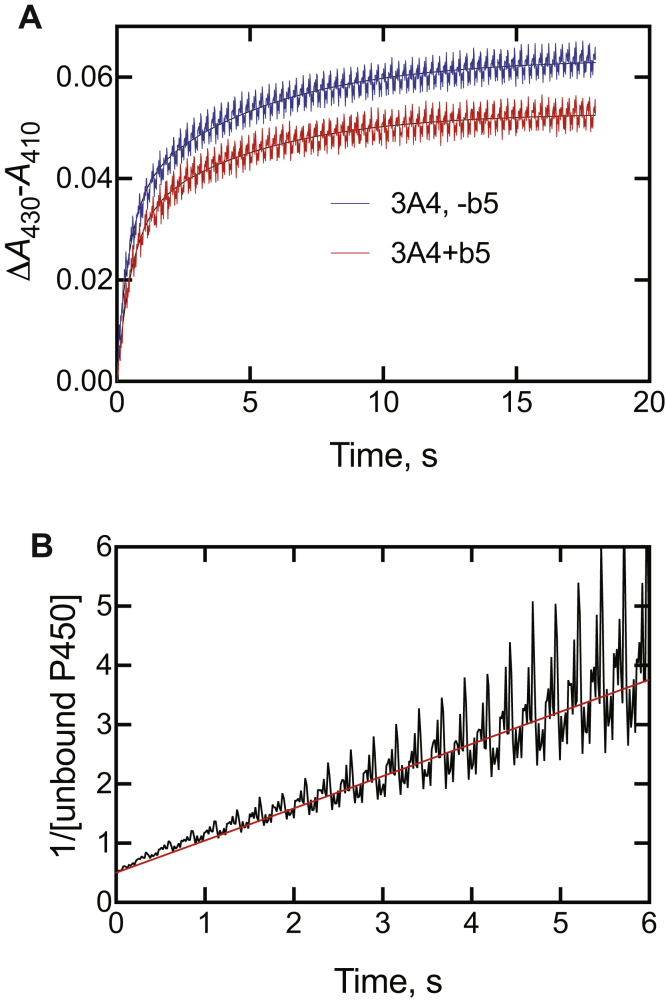
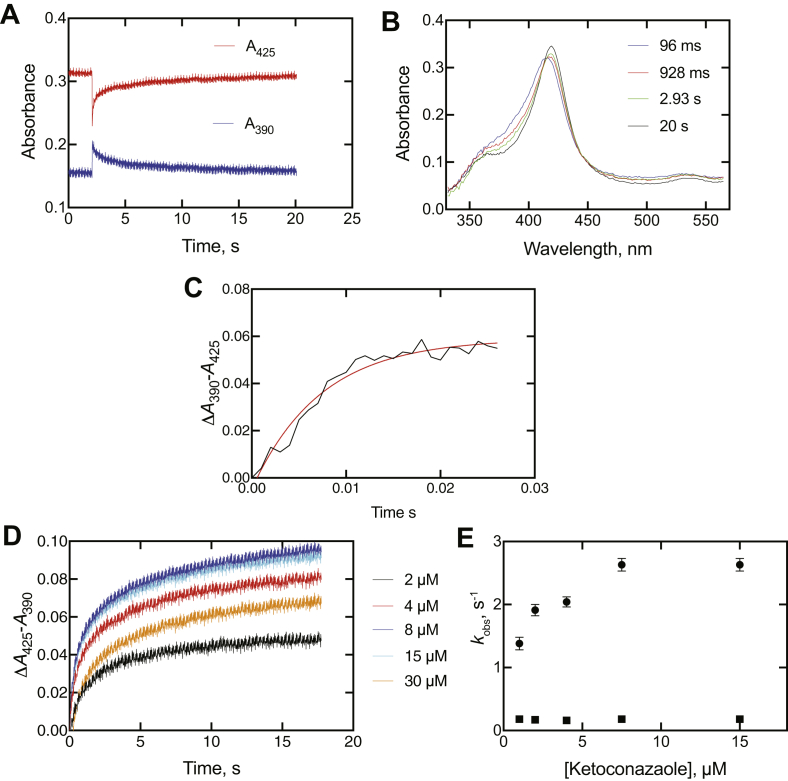
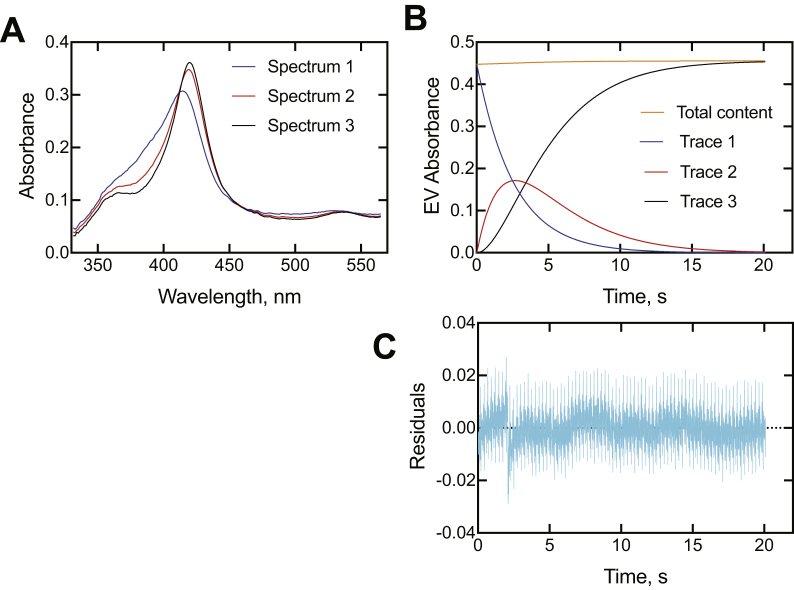
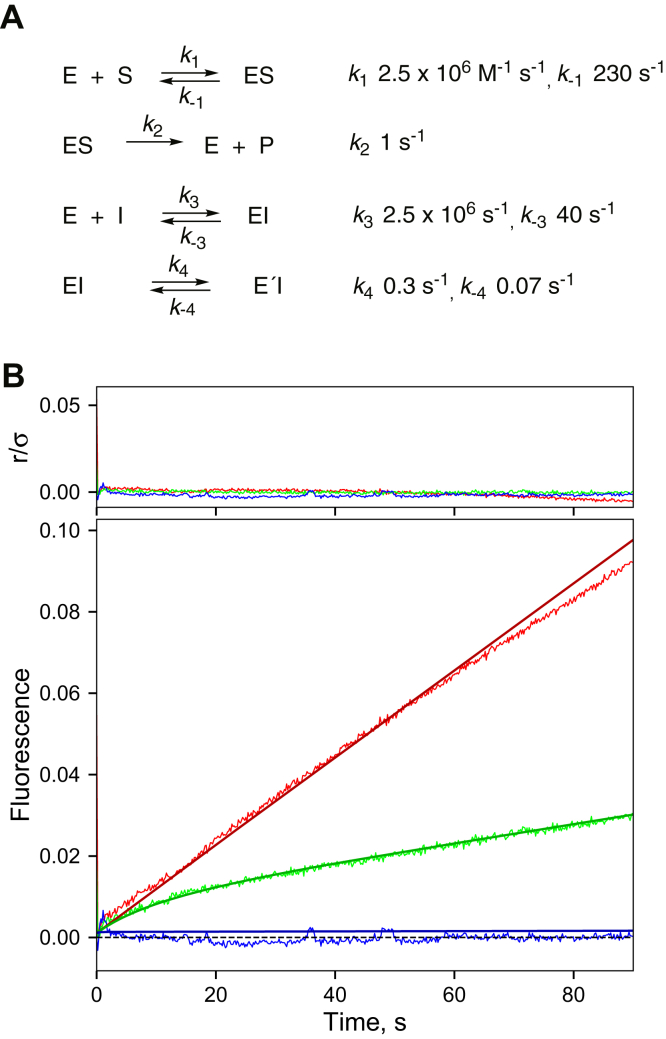
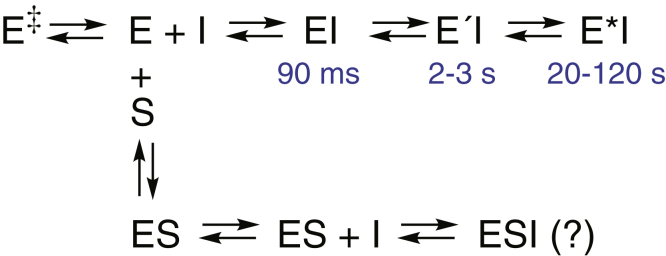
Cytochrome P450 (P450) 3A4 is the enzyme most involved in the metabolism of drugs and can also oxidize numerous steroids. This enzyme is also involved in one-half of pharmacokinetic drug-drug interactions, but details of the exact mechanisms of P450 3A4 inhibition are still unclear in many cases. Ketoconazole, clotrimazole, ritonavir, indinavir, and itraconazole are strong inhibitors; analysis of the kinetics of reversal of inhibition with the model substrate 7-benzoyl quinoline showed lag phases in several cases, consistent with multiple structures of P450 3A4 inhibitor complexes. Lags in the onset of inhibition were observed when inhibitors were added to P450 3A4 in 7-benzoyl quinoline O-debenzylation reactions, and similar patterns were observed for inhibition of testosterone 6β-hydroxylation by ritonavir and indinavir. Upon mixing with inhibitors, P450 3A4 showed rapid binding as judged by a spectral shift with at least partial high-spin iron character, followed by a slower conversion to a low-spin iron-nitrogen complex. The changes were best described by two intermediate complexes, one being a partial high-spin form and the second another intermediate, with half-lives of seconds. The kinetics could be modeled in a system involving initial loose binding of inhibitor, followed by a slow step leading to a tighter complex on a multisecond time scale. Although some more complex possibilities cannot be dismissed, these results describe a system in which conformationally distinct forms of P450 3A4 bind inhibitors rapidly and two distinct P450-inhibitor complexes exist en route to the final enzyme-inhibitor complex with full inhibitory activity.
Keywords: UV–visible spectroscopy; cytochrome P450; enzyme inhibitor; enzyme kinetics; enzyme mechanism; pre–steady-state kinetics.
Copyright © 2020 The Authors. Published by Elsevier Inc. All rights reserved.
Conflict of interest statement
Conflict of interest The authors declare that they have no conflict of interest with the contents of this article.
Figures
Similar articles
-
Modulation of the interaction between human P450 3A4 and B. megaterium reductase via engineered loops.Biochim Biophys Acta Proteins Proteom. 2018 Jan;1866(1):116-125. doi: 10.1016/j.bbapap.2017.07.009. Epub 2017 Jul 19. Biochim Biophys Acta Proteins Proteom. 2018. PMID: 28734977
-
Stepwise binding of inhibitors to human cytochrome P450 17A1 and rapid kinetics of inhibition of androgen biosynthesis.J Biol Chem. 2021 Aug;297(2):100969. doi: 10.1016/j.jbc.2021.100969. Epub 2021 Jul 15. J Biol Chem. 2021. PMID: 34273352 Free PMC article.
-
Differential inhibition of cytochrome P450 3A4, 3A5 and 3A7 by five human immunodeficiency virus (HIV) protease inhibitors in vitro.Basic Clin Pharmacol Toxicol. 2006 Jan;98(1):79-85. doi: 10.1111/j.1742-7843.2006.pto_249.x. Basic Clin Pharmacol Toxicol. 2006. PMID: 16433896
-
Ritonavir is the best alternative to ketoconazole as an index inhibitor of cytochrome P450-3A in drug-drug interaction studies.Br J Clin Pharmacol. 2015 Sep;80(3):342-50. doi: 10.1111/bcp.12668. Epub 2015 Jun 1. Br J Clin Pharmacol. 2015. PMID: 25923589 Free PMC article. Review.
-
Ritonavir analogues as a probe for deciphering the cytochrome P450 3A4 inhibitory mechanism.Curr Top Med Chem. 2014;14(11):1348-55. doi: 10.2174/1568026614666140506120647. Curr Top Med Chem. 2014. PMID: 24805065 Free PMC article. Review.
Cited by
-
IK Channel-Independent Effects of Clotrimazole and Senicapoc on Cancer Cells Viability and Migration.Int J Mol Sci. 2023 Nov 14;24(22):16285. doi: 10.3390/ijms242216285. Int J Mol Sci. 2023. PMID: 38003471 Free PMC article.
-
Roles of Individual Human Cytochrome P450 Enzymes in Drug Metabolism.Pharmacol Rev. 2024 Oct 16;76(6):1104-1132. doi: 10.1124/pharmrev.124.001173. Pharmacol Rev. 2024. PMID: 39054072 Review.
-
Roles of cytochrome P450 enzymes in pharmacology and toxicology: Past, present, and future.Adv Pharmacol. 2022;95:1-47. doi: 10.1016/bs.apha.2021.12.001. Epub 2022 Jul 18. Adv Pharmacol. 2022. PMID: 35953152 Free PMC article.
-
An Insight into the Metabolism of 2,5-Disubstituted Monotetrazole Bearing Bisphenol Structures: Emerging Bisphenol A Structural Congeners.Molecules. 2023 Feb 2;28(3):1465. doi: 10.3390/molecules28031465. Molecules. 2023. PMID: 36771130 Free PMC article.
-
Secondary Binding Site of CYP17A1 in Enhanced Sampling Simulations.J Chem Inf Model. 2024 Oct 14;64(19):7679-7686. doi: 10.1021/acs.jcim.4c01293. Epub 2024 Sep 26. J Chem Inf Model. 2024. PMID: 39325660 Free PMC article.
References
-
- Ortiz de Montellano P.R., editor. Cytochrome P450: Structure, Mechanism, and Biochemistry. 4th Ed. Springer; New York, NY: 2015.
-
- Guengerich F.P., Martin M.V., Beaune P.H., Kremers P., Wolff T., Waxman D.J. Characterization of rat and human liver microsomal cytochrome P-450 forms involved in nifedipine oxidation, a prototype for genetic polymorphism in oxidative drug metabolism. J. Biol. Chem. 1986;261:5051–5060. - PubMed
-
- Guengerich F.P. Cytochrome P-450 3A4: regulation and role in drug metabolism. Annu. Rev. Pharmacol. Toxicol. 1999;39:1–17. - PubMed
-
- Guengerich F.P. Human cytochrome P450 enzymes. In: Ortiz de Montellano P.R., editor. Cytochrome P450: Structure, Mechanism, and Biochemistry. 4th Ed. Springer; New York, NY: 2015. pp. 523–785.
Publication types
MeSH terms
Substances
Grants and funding
LinkOut - more resources
Full Text Sources
Other Literature Sources
Research Materials
