

Prevalence and outcome of dysnatremia in patients with COVID-19 compared to controls
- PMID: 33449918
- PMCID: PMC9494345
- DOI: 10.1530/EJE-20-1374
Prevalence and outcome of dysnatremia in patients with COVID-19 compared to controls
Abstract
Objective: The pandemic of coronavirus disease (COVID-19) has rapidly spread globally and infected millions of people. The prevalence and prognostic impact of dysnatremia in COVID-19 is inconclusive. Therefore, we investigated the prevalence and outcome of dysnatremia in COVID-19.
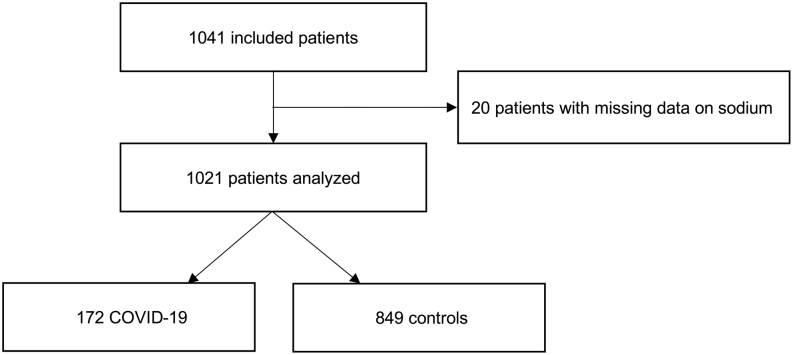
Design: The prospective, observational, cohort study included consecutive patients with clinical suspicion of COVID-19 triaged to a Swiss Emergency Department between March and July 2020.
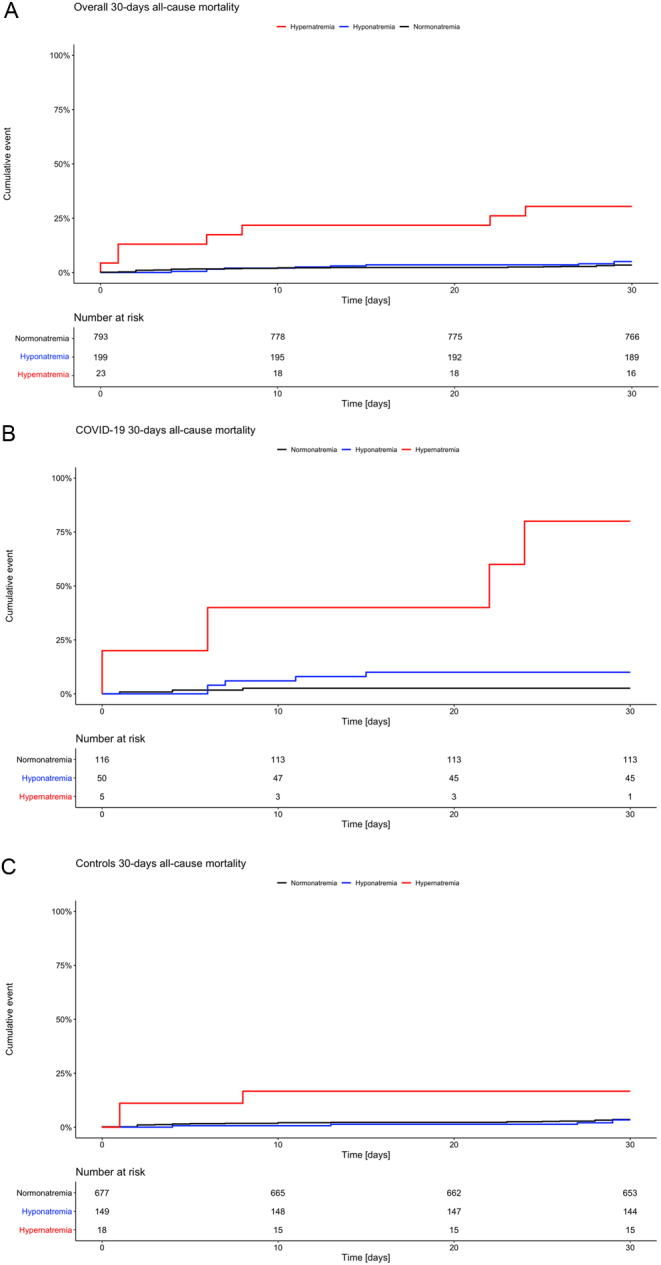
Methods: Collected data included clinical, laboratory and disease severity scoring parameters on admission. COVID-19 cases were identified based on a positive nasopharyngeal swab test for SARS-CoV-2, patients with a negative swab test served as controls. The primary analysis was to assess the prognostic impact of dysnatremia on 30-day mortality using a cox proportional hazard model.
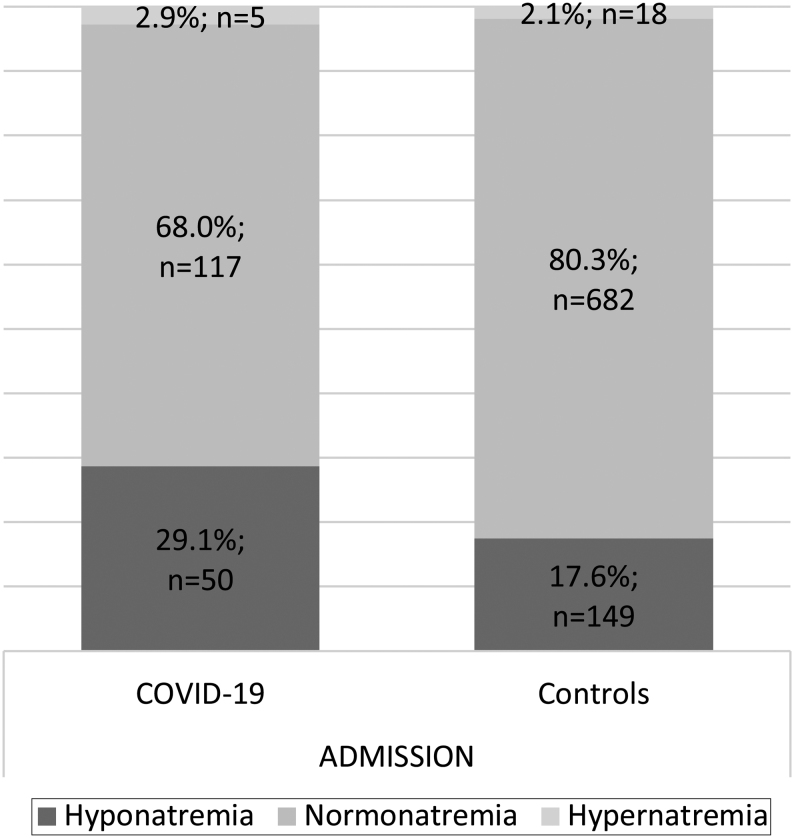
Results: 172 (17%) cases with COVID-19 and 849 (83%) controls were included. Patients with COVID-19 showed a higher prevalence of hyponatremia compared to controls (28.1% vs 17.5%, P < 0.001); while comparable for hypernatremia (2.9% vs 2.1%, P = 0.34). In COVID-19 but not in controls, hyponatremia was associated with a higher 30-day mortality (HR: 1.4, 95% CI: 1.10-16.62, P = 0.05). In both groups, hypernatremia on admission was associated with higher 30-day mortality (COVID-19 - HR: 11.5, 95% CI: 5.00-26.43, P < 0.001; controls - HR: 5.3, 95% CI: 1.60-17.64, P = 0.006). In both groups, hyponatremia and hypernatremia were significantly associated with adverse outcome, for example, intensive care unit admission, longer hospitalization and mechanical ventilation.
Conclusion: Our results underline the importance of dysnatremia as predictive marker in COVID-19. Treating physicians should be aware of appropriate treatment measures to be taken for patients with COVID-19 and dysnatremia.
Figures
References
-
- Qian GQ, Yang NB, Ding F, Ma AHY, Wang ZY, Shen YF, Shi CW, Lian X, Chu JG, Chen Let al. Epidemiologic and clinical characteristics of 91 hospitalized patients with COVID-19 in Zhejiang, China: a retrospective, multi-centre case series. QJM 2020113474–481. ( 10.1093/qjmed/hcaa089) - DOI - PMC - PubMed
-
- Krüger S, Ewig S, Giersdorf S, Hartmann O, Frechen D, Rohde G, Suttorp N, Welte TCAPNETZ study group. Dysnatremia, vasopressin, atrial natriuretic peptide and mortality in patients with community-acquired pneumonia: results from the german competence network CAPNETZ. Respiratory Medicine 20141081696–1705. ( 10.1016/j.rmed.2014.09.014) - DOI - PubMed
Publication types
MeSH terms
LinkOut - more resources
Full Text Sources
Other Literature Sources
Medical
Miscellaneous
